-
-

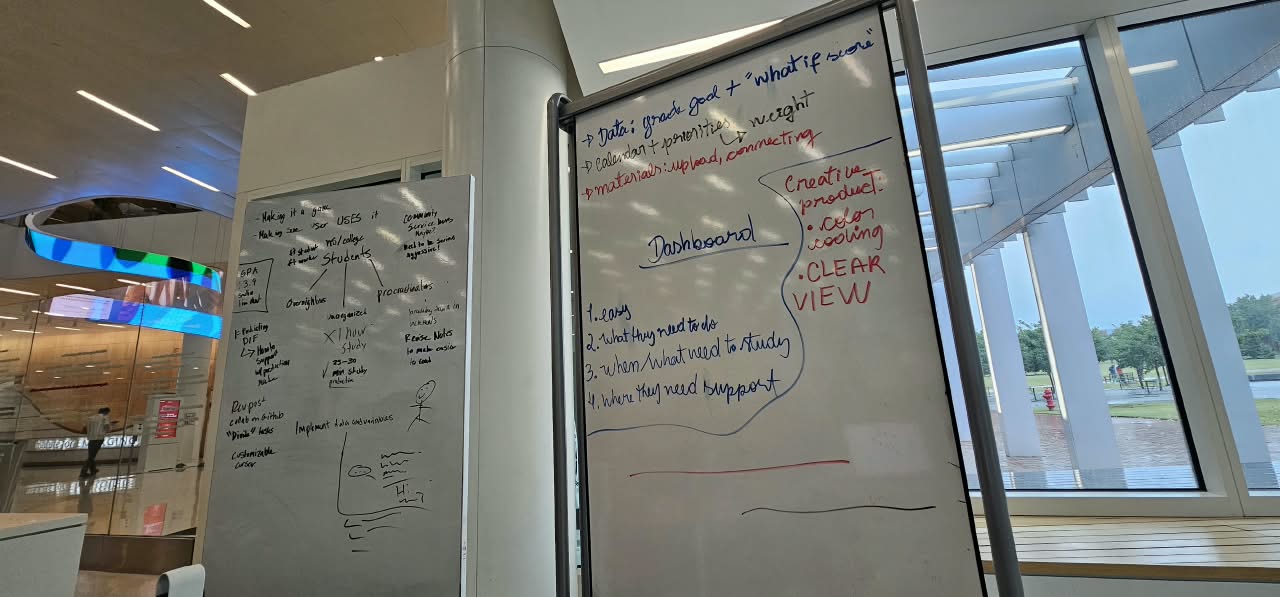
designing
-
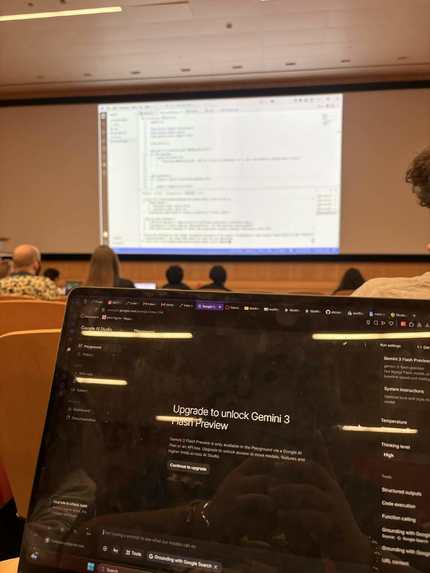
gemini api workshop
-
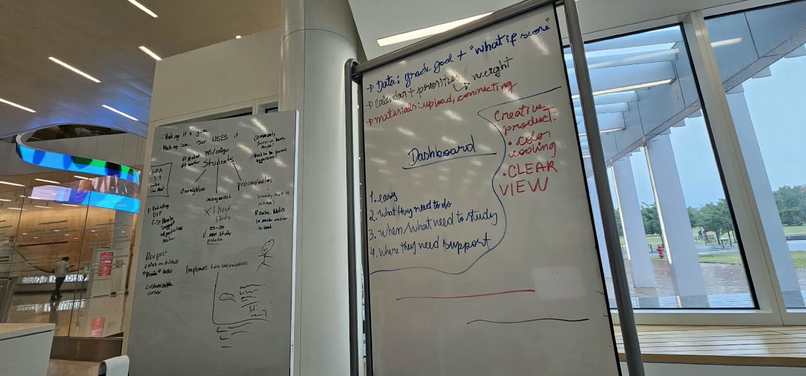
brainstorming
-
registering the project
-

our team
-
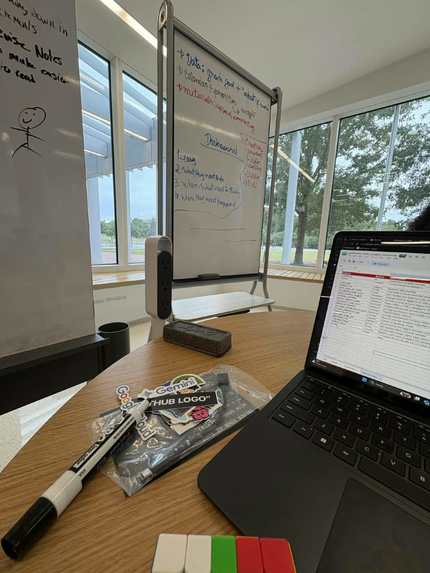
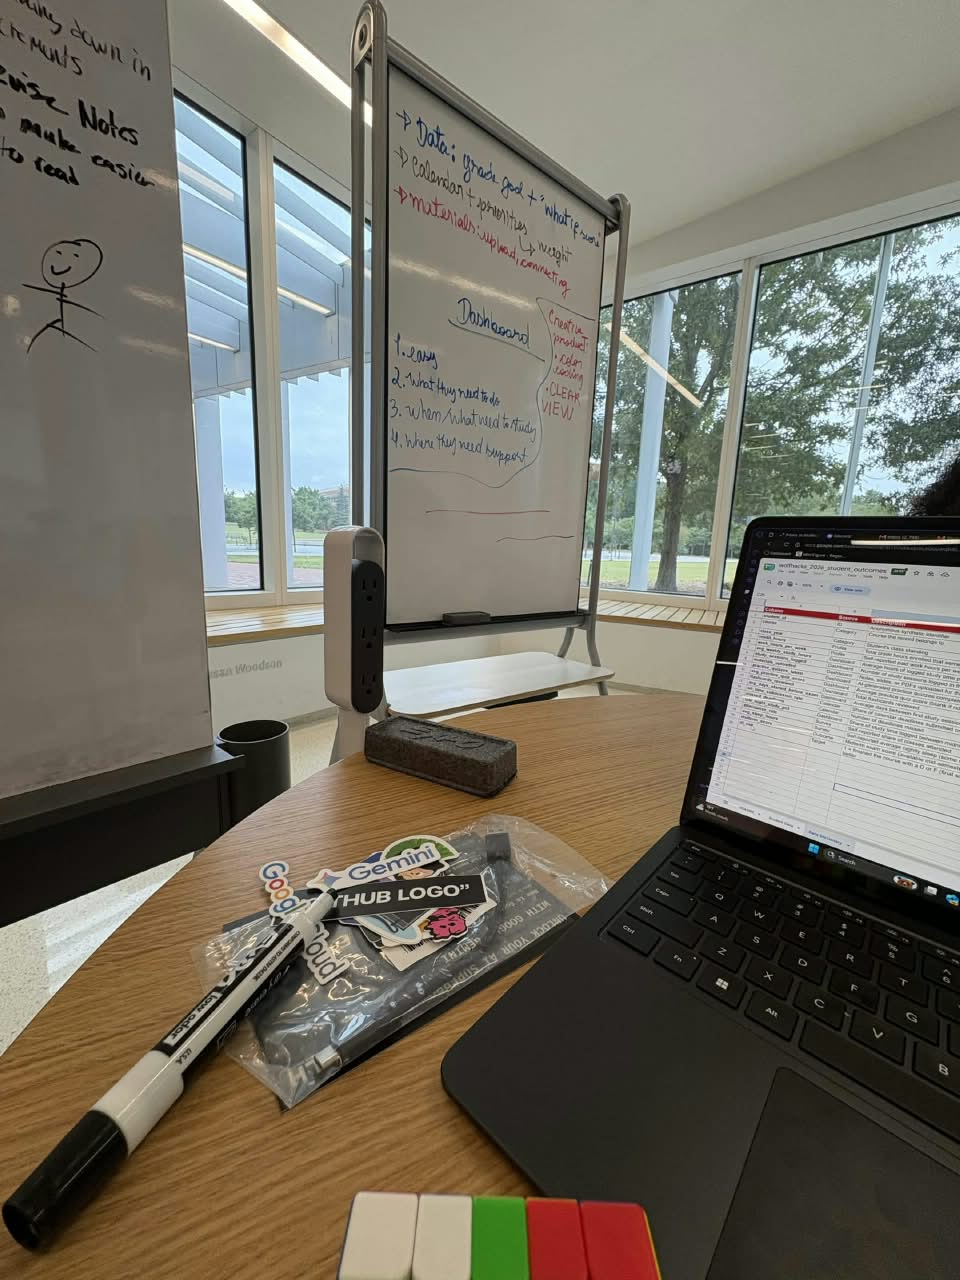
studying the data set
-
coding
-
coding
-
coding


inspiration
as students ourselves, we have been there. students keep deadlines in one place, notes in another and grades in a third, and usually find out they are in trouble when it is too late to fix. we wanted one place that answers three questions: what do i need to do, what do i need to study, and where do i need support.
what it does
- one real student, everywhere: the dashboard follows a student from the wolfhacks dataset. switch the student id and every page updates.
- overview: a calendar where you add, tick off and remove deadlines and exams, with "due soon" counted from your list.
- my progress: twelve numbers for the semester (midterm, attendance, on-time rate, study hours and more), each next to the average of the other students in the same course.
- notes: upload a pdf, image or text file and get a summary, key points and a clickable practice quiz, generated by google gemini.
- support check: a decision tree estimates whether a course needs "extra support", "some support" or is "on track", explains why in plain language, and gives a next step for each reason. change a number and check again to see what would move the result.
- spookie's pond: a rubber duck in a witch hat for talking through what's stuck in a class. spookie knows what the dashboard shows for you, asks one question at a time, and ends with one small step.
- resources: links to campus academic support, so a next step always has somewhere to go.
- how the model works: recall, baseline comparison, the overfitting chart, the tree itself and its limits, on one page.
how we built it
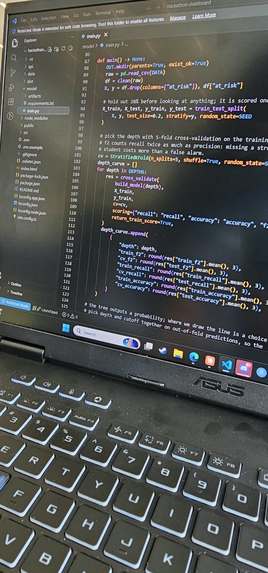
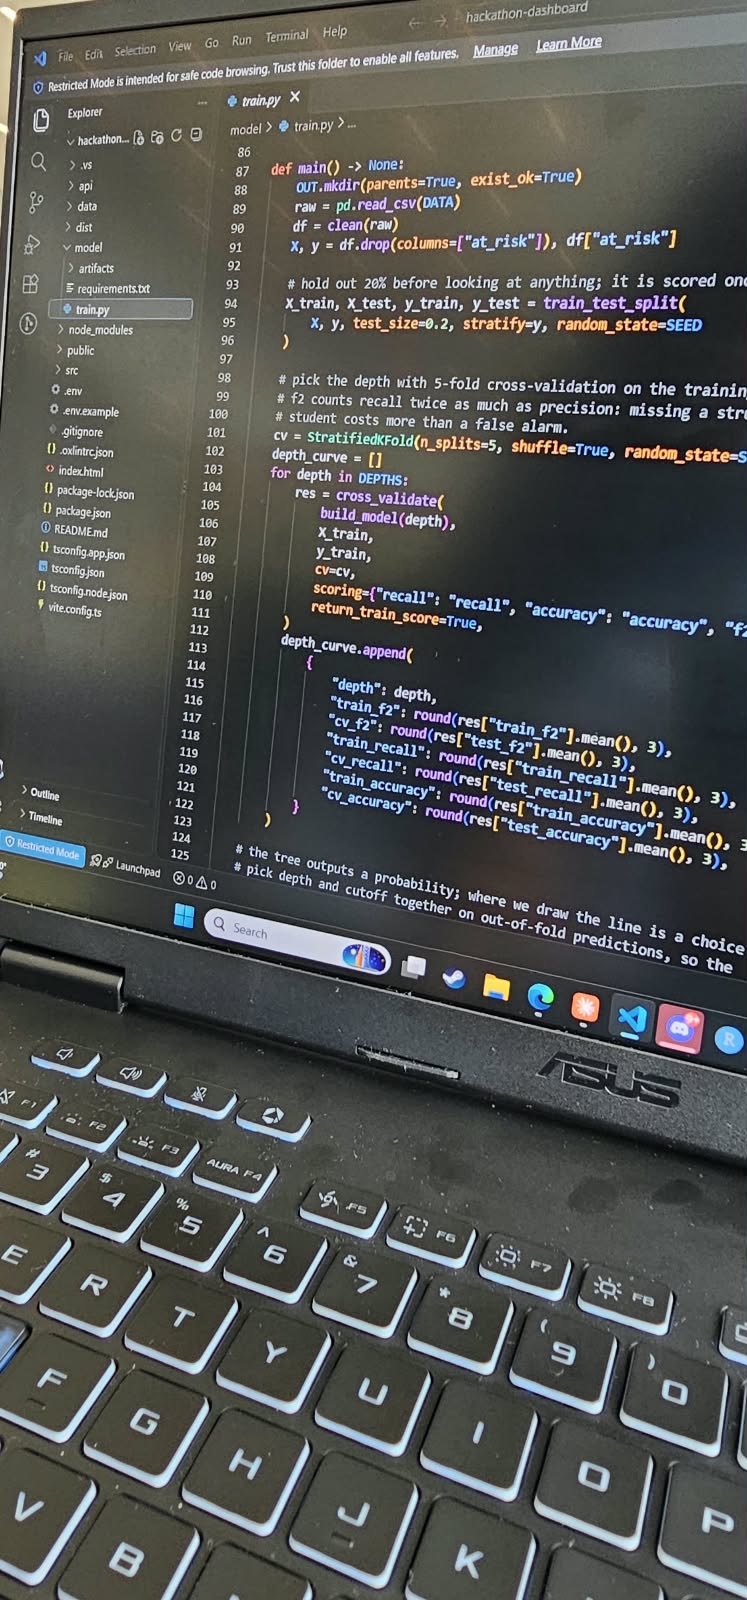
- model: a scikit-learn decision tree trained on the 800-row wolfhacks synthetic dataset. we held out 20% (160 rows) before doing anything else, and chose the tree depth and the decision cutoff with 5-fold cross-validation on the training rows only.
- data cleaning: three percent columns converted to fractions. blanks in work hours and sleep filled with the training median. a blank practice quiz score always meant "no quizzes taken", so we added that as its own feature.
- explanations: for each student we walk their path through the tree. at every split we compare the branch they took with the one they didn't: if theirs carries more risk, it becomes a reason with a matching action; otherwise it becomes a strength.
- api: fastapi serves the model, the explanations, the evaluation metrics and the gemini study aids.
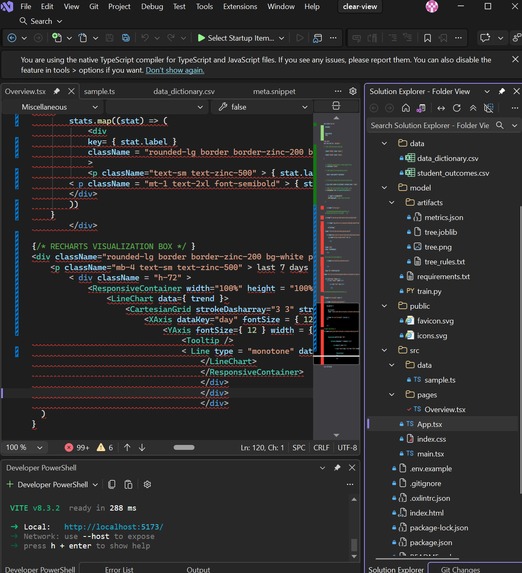
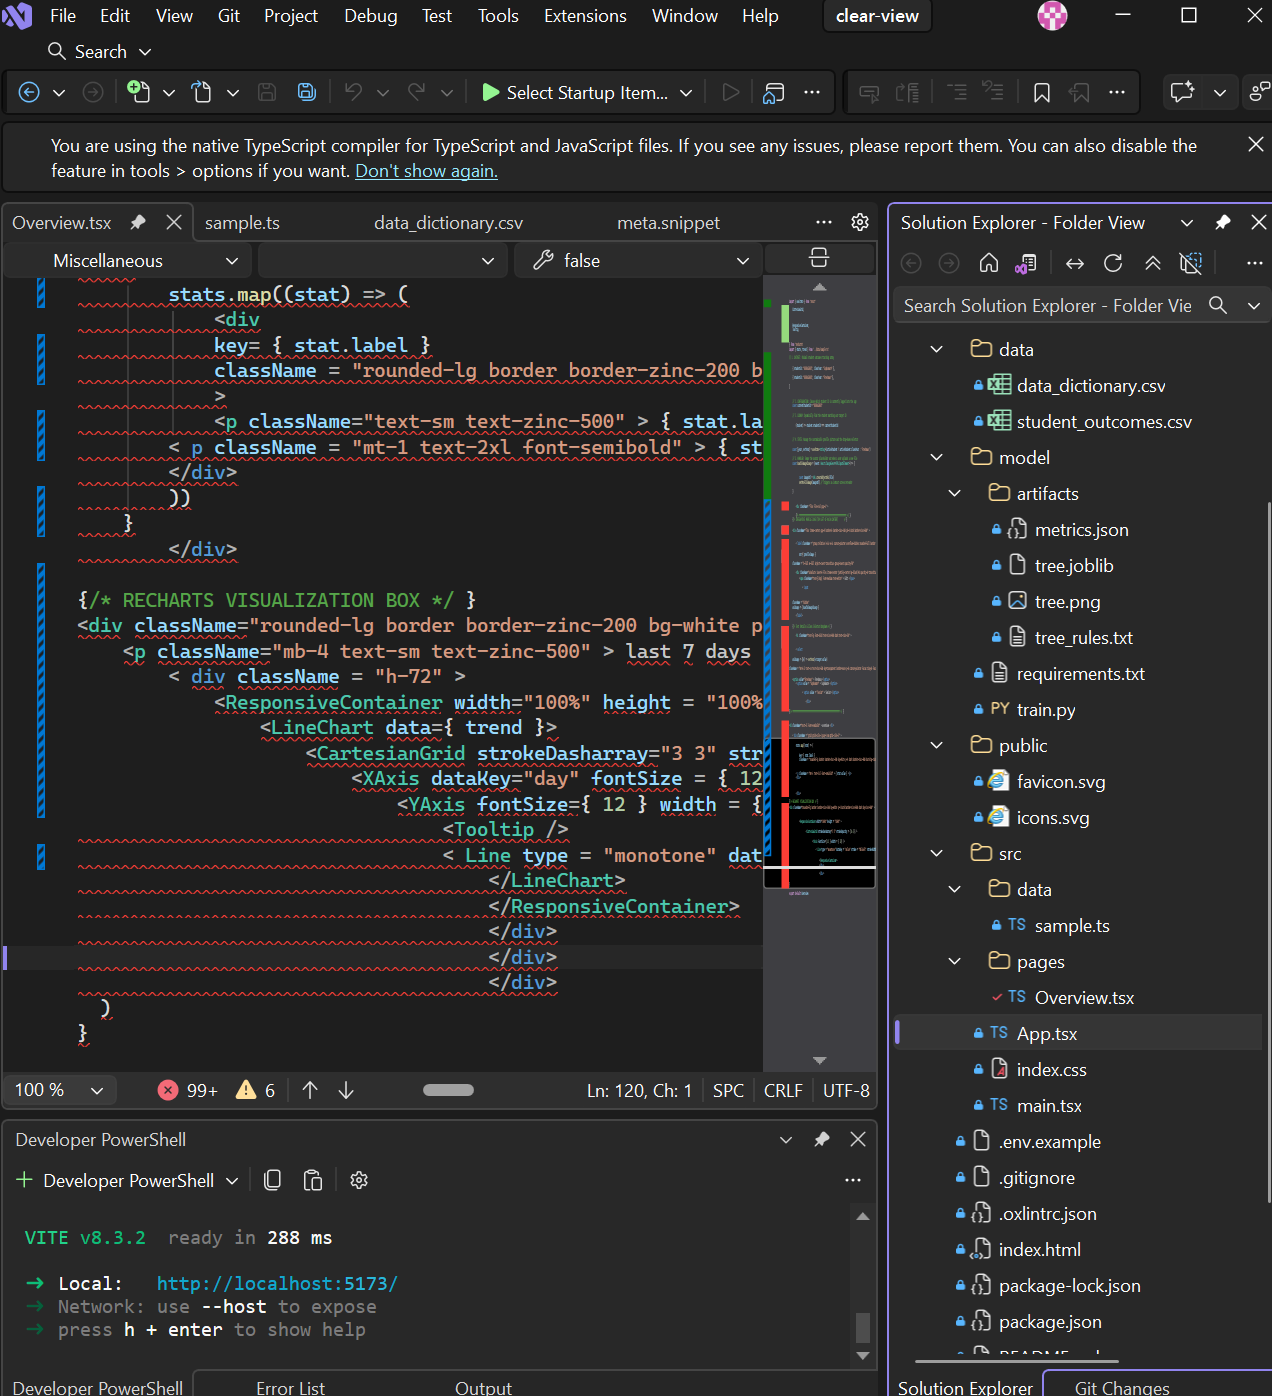
- frontend: react, typescript, vite, tailwind css and recharts.
what it does
- one real student, everywhere: the dashboard follows a student from the wolfhacks dataset. switch the student id and every page updates.
- overview: a calendar where you add, tick off and remove deadlines and exams, with "due soon" counted from your list.
- my progress: twelve numbers for the semester (midterm, attendance, on-time rate, study hours and more), each next to the average of the other students in the same course.
- notes: upload a pdf, image or text file and get a summary, key points and a clickable practice quiz, generated by google gemini.
- support check: a decision tree estimates whether a course needs "extra support", "some support" or is "on track", explains why in plain language, and gives a next step for each reason. change a number and check again to see what would move the result.
- spookie's pond: a rubber duck in a witch hat for talking through what's stuck in a class. spookie knows what the dashboard shows for you, asks one question at a time, and ends with one small step.
- resources: links to campus academic support, so a next step always has somewhere to go.
- how the model works: recall, baseline comparison, the overfitting chart, the tree itself and its limits, on one page.
results
on the held-out rows the tree catches 89% of at-risk students (recall), with 49% precision and 72% accuracy. always predicting "not at risk" scores 73% accuracy but catches nobody.
we also compared against a one-line rule, "flag everyone with a midterm below 68". it catches 98% with 51% precision, so on this split it beats the tree. across 30 repeated splits the two roughly tie. we kept the tree because a midterm cutoff can only say "your midterm was low", while the tree points at attendance, deadlines and late-night studying, which a student can still change.
challenges
- the tree did not clearly beat a simple rule. we decided to report that instead of hiding it.
- recall versus false alarms. missing a struggling student costs more than a false alarm, so we scored recall twice as heavily as precision and lowered the cutoff to 0.20.
- overfitting. recall drops from 97% on training rows to 89% on held-out rows.
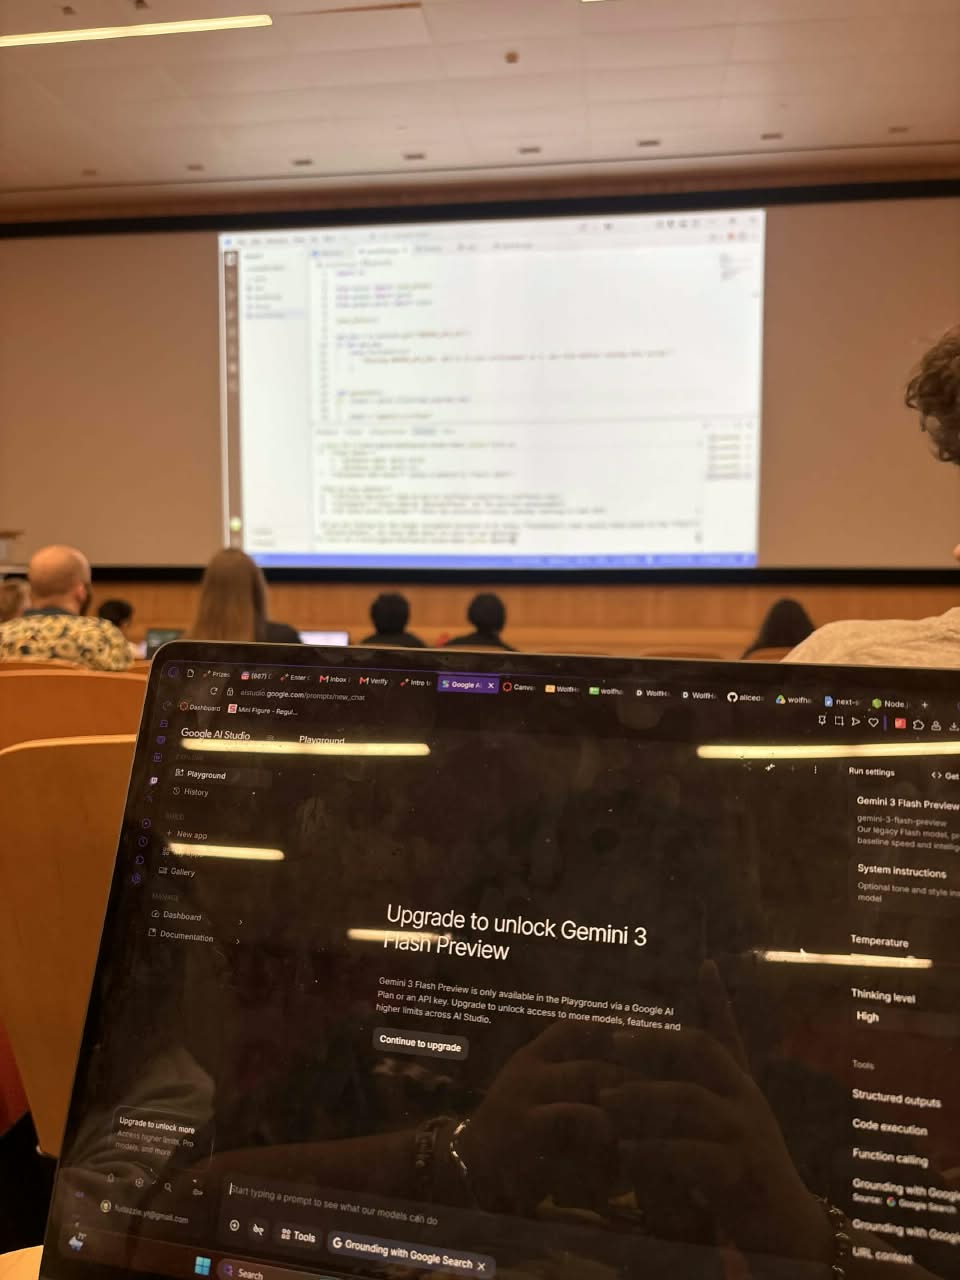
- gemini reliability. the api sometimes answered "high demand", so we added retries.
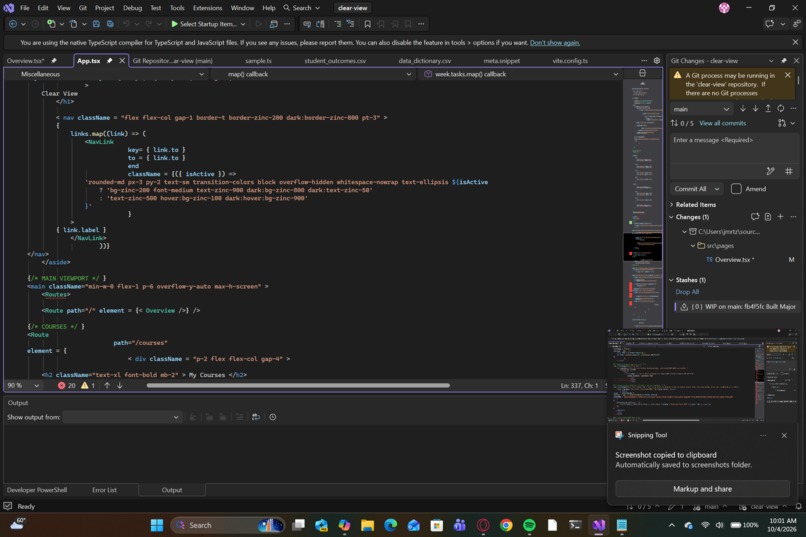
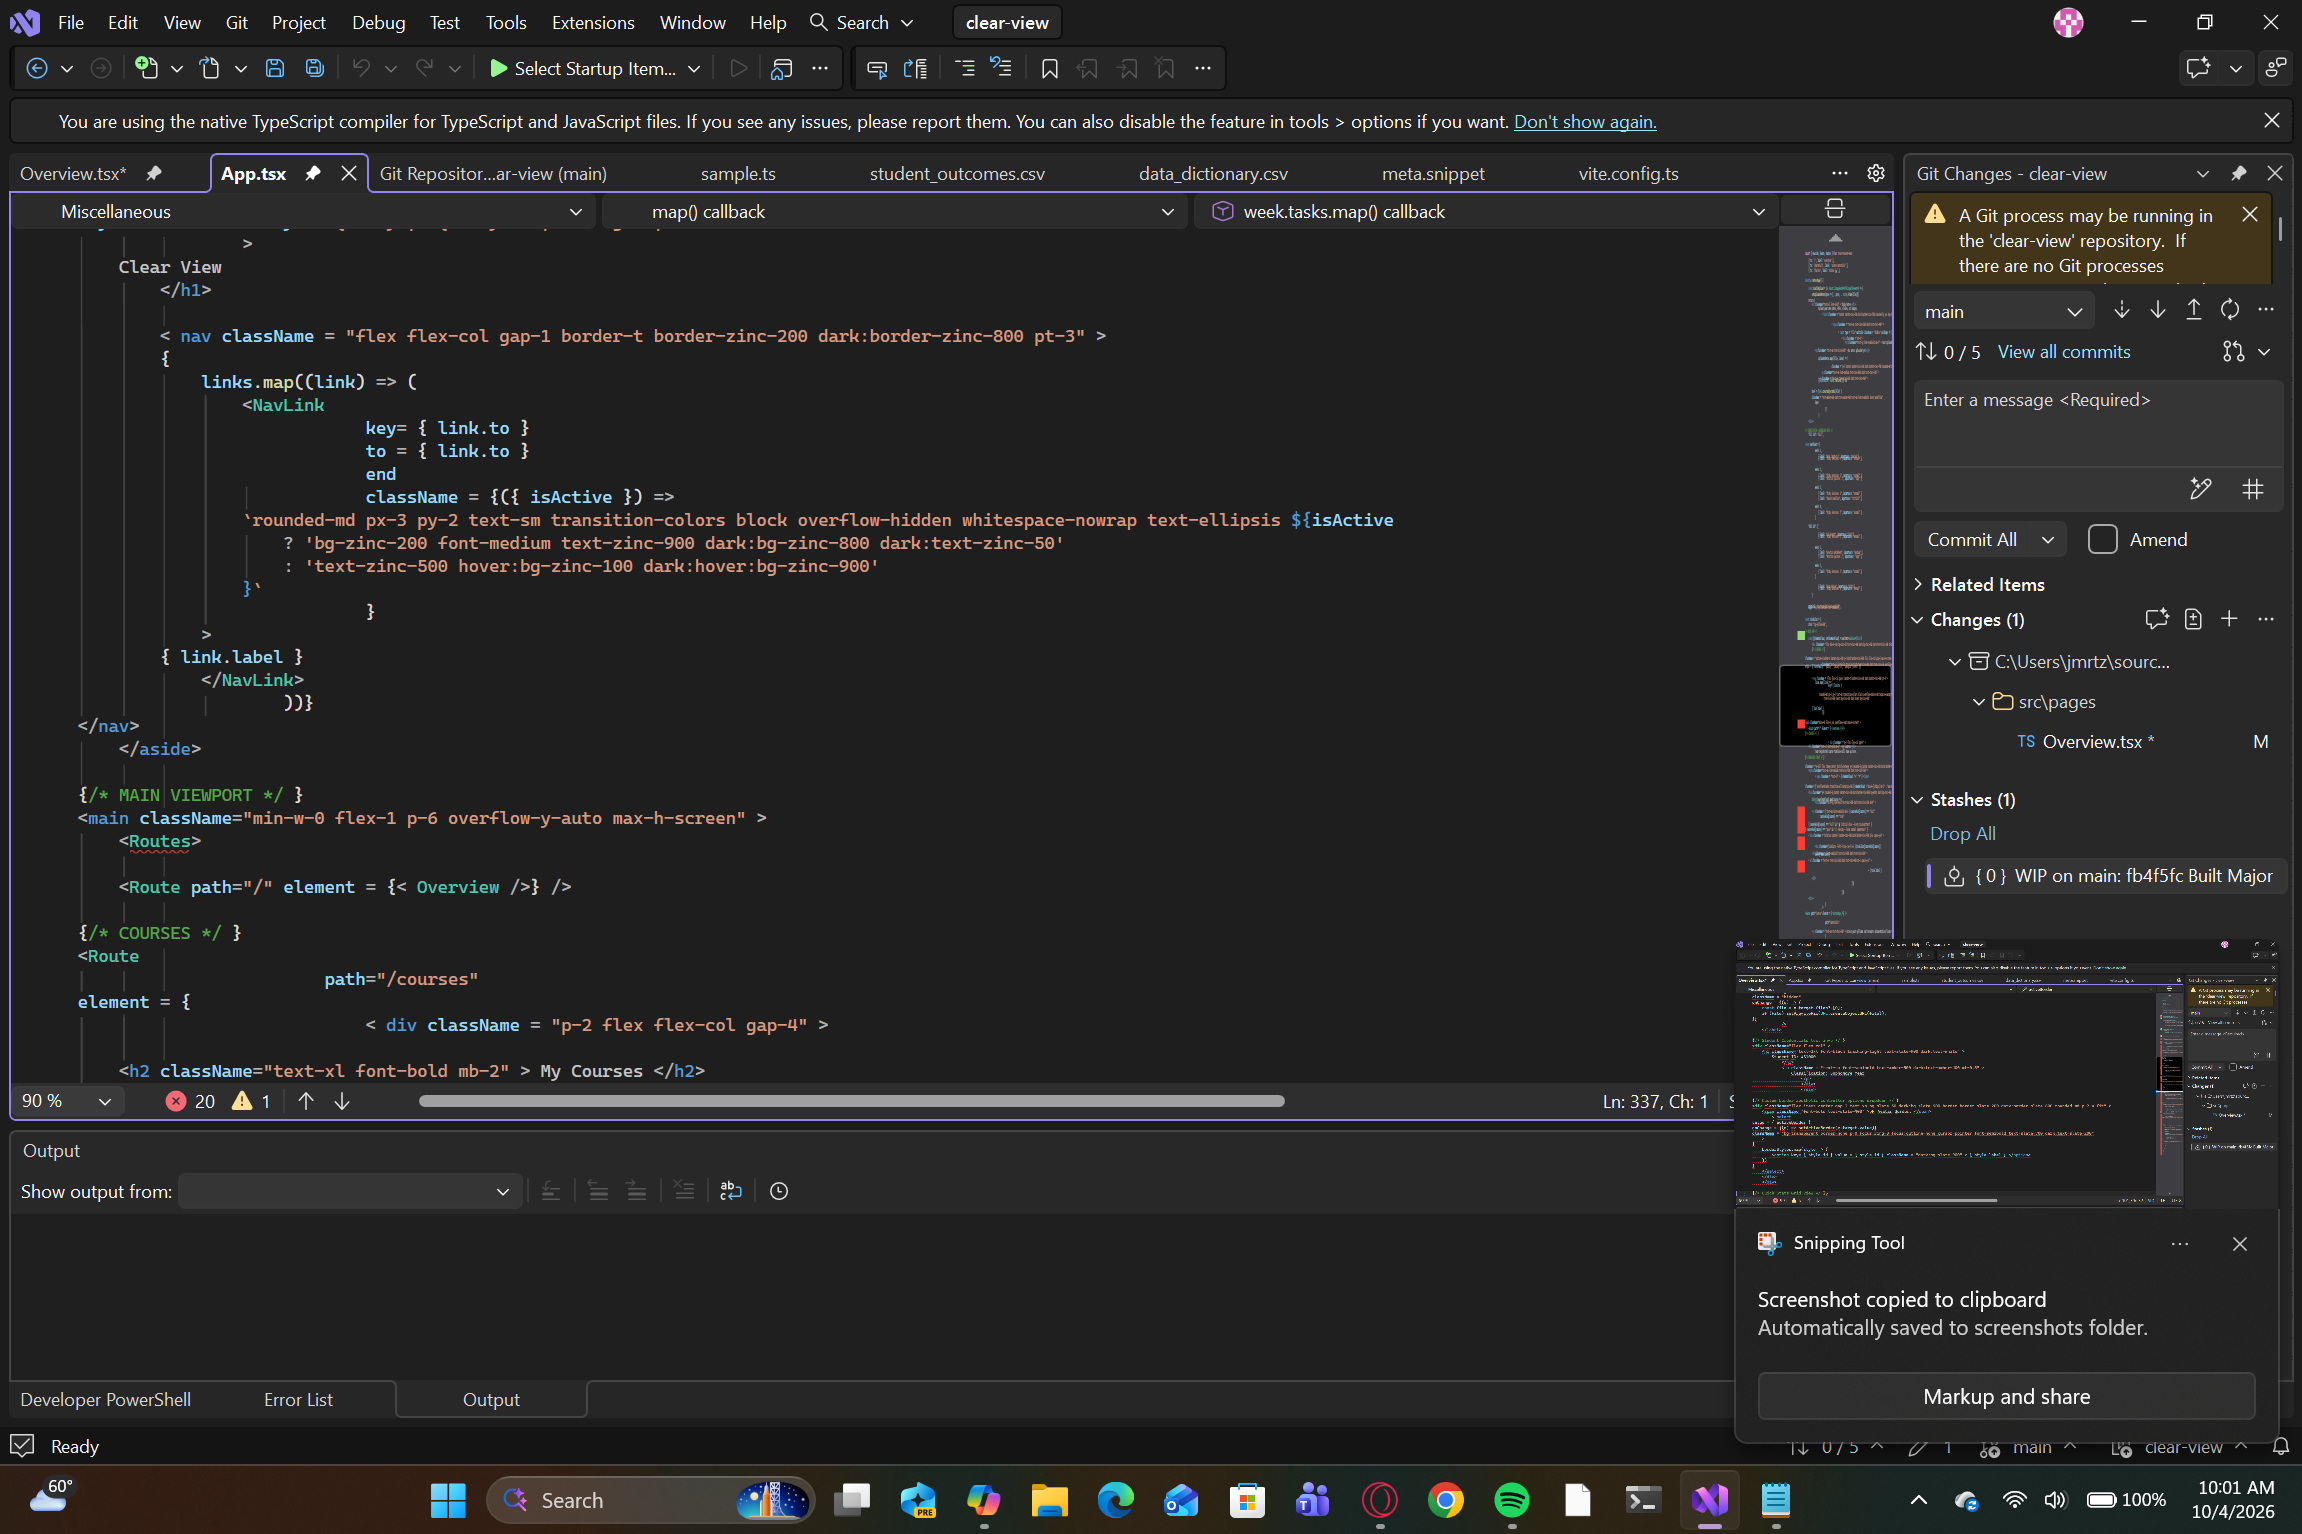
- merging two people's work overnight. one push didn't compile after a formatter broke the markup, so we repaired it and connected the pages to the api in the morning.
responsible ai
- supportive wording: results are shown as "on track", "some support" or "extra support", never as a prediction of failure, and always with strengths and next steps.
- limitations: the data is synthetic, small and partly self-reported. the score is relative, not a calibrated probability, and the model has not been tested on real students.
- privacy: uploaded notes are sent to google gemini to generate the summary and quiz. our api does not store or log them. no real student data is used.
- ai disclosure: summaries and quizzes are generated by google gemini. parts of the code were written with claude code, as cited in the readme.
what we learned
a model that is easy to explain can be worth more to a student than one that scores slightly higher, and comparing against a strong baseline taught us more than the accuracy number did.
what's next
a weekly study plan built from your deadlines and the habits the model flags, and real course data in place of the example weekly plans.
Built With
- fastapi
- github
- google-gemini
- pandas
- python
- react
- react-router
- recharts
- scikit-learn
- tailwindcss
- typescript
- uvicorn
- vite

Log in or sign up for Devpost to join the conversation.