-
-
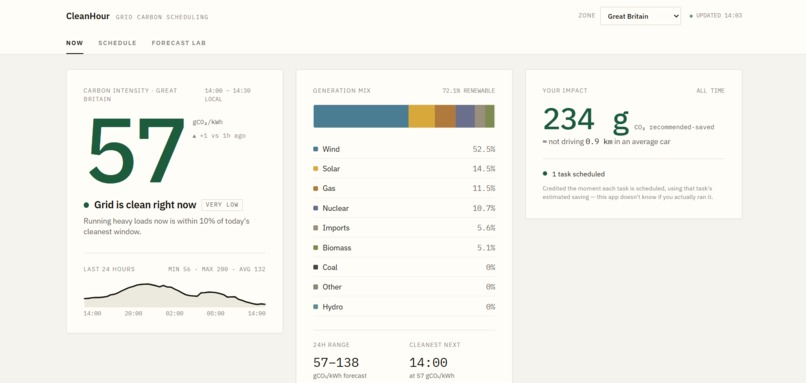
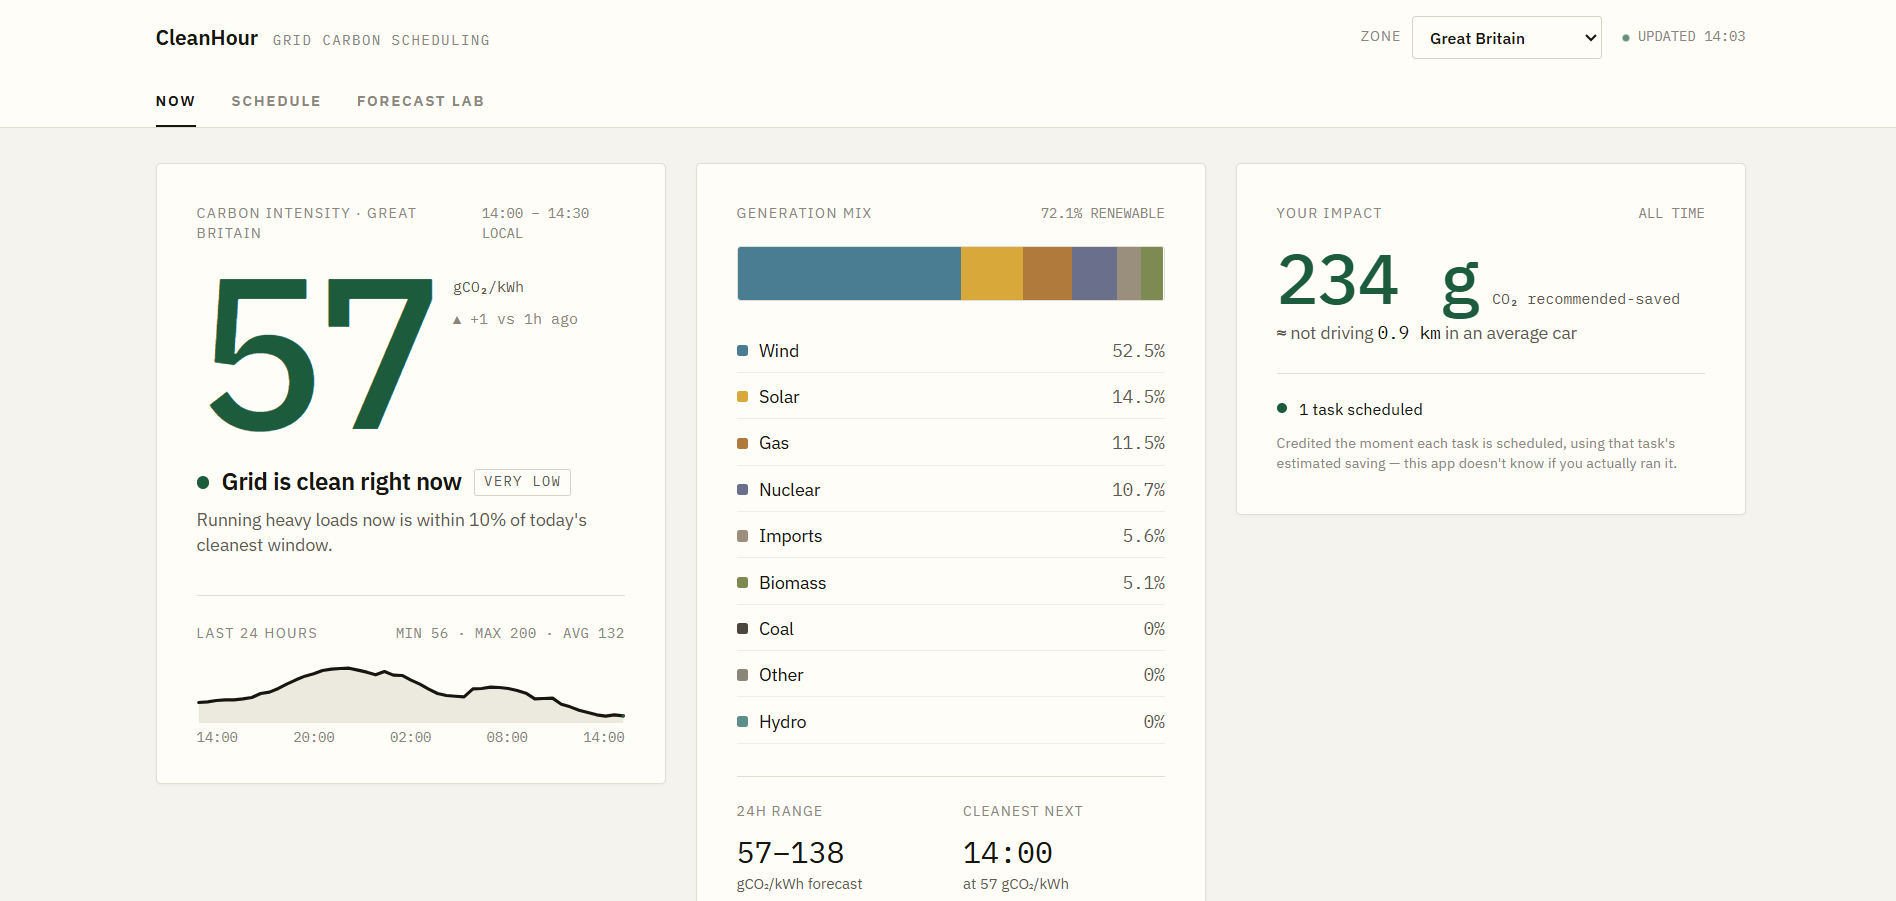
Live carbon intensity, generation mix, and lifetime impact for Great Britain, from real grid data, auto-refreshing every 30 seconds.
-
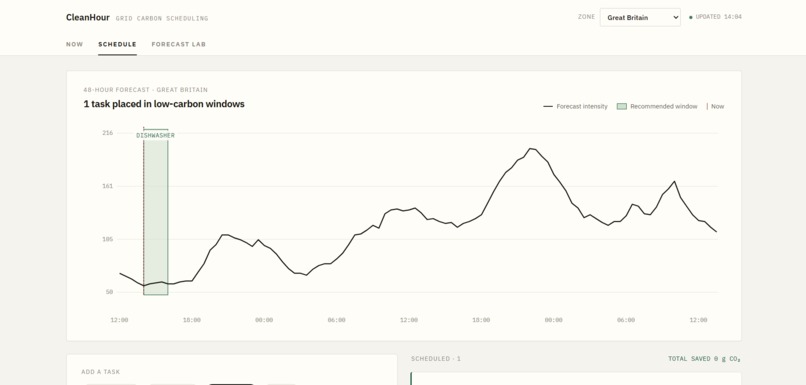
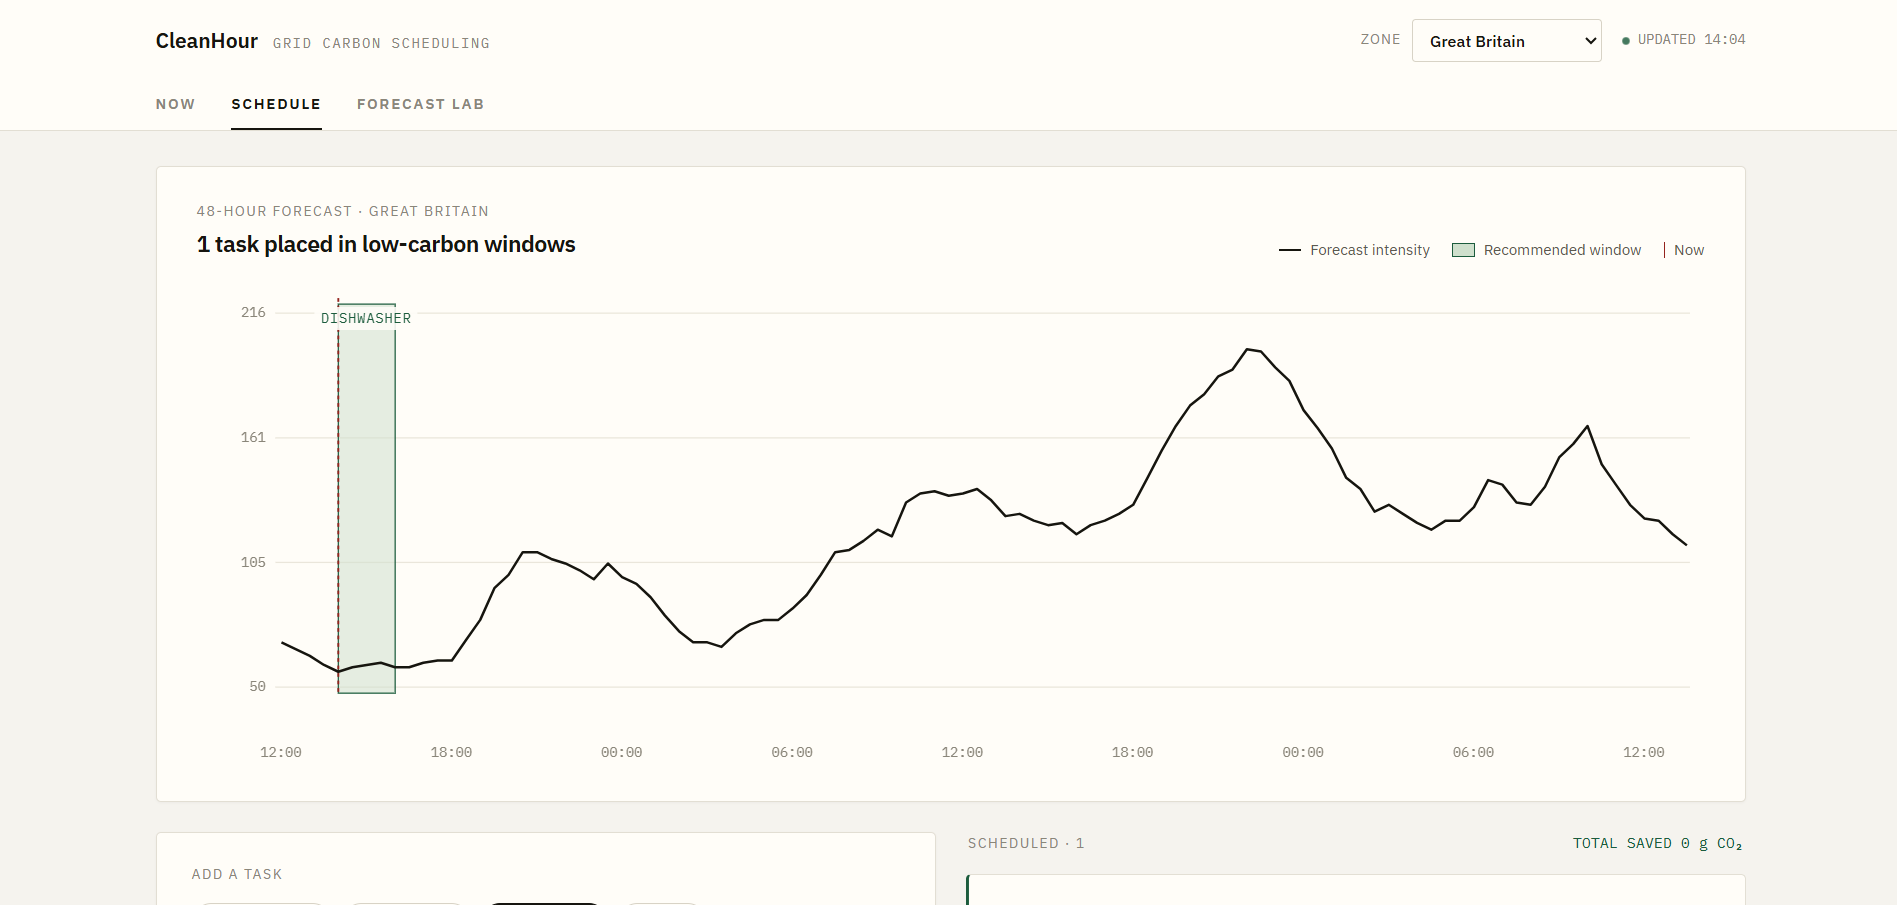
A dishwasher scheduled into the actual cleanest window in the next 48 hours, a real start time that still meets the deadline.
-
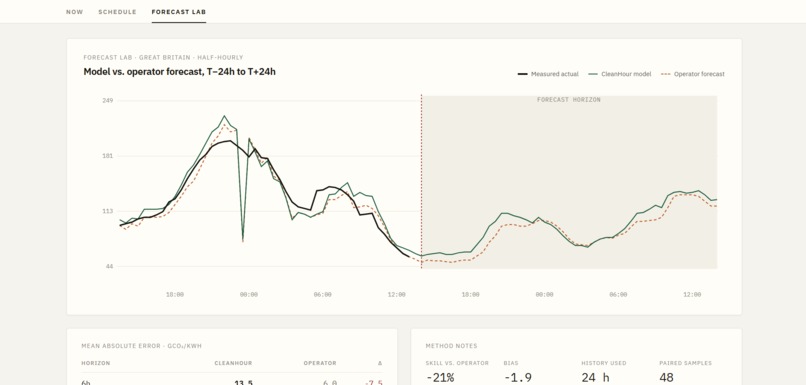
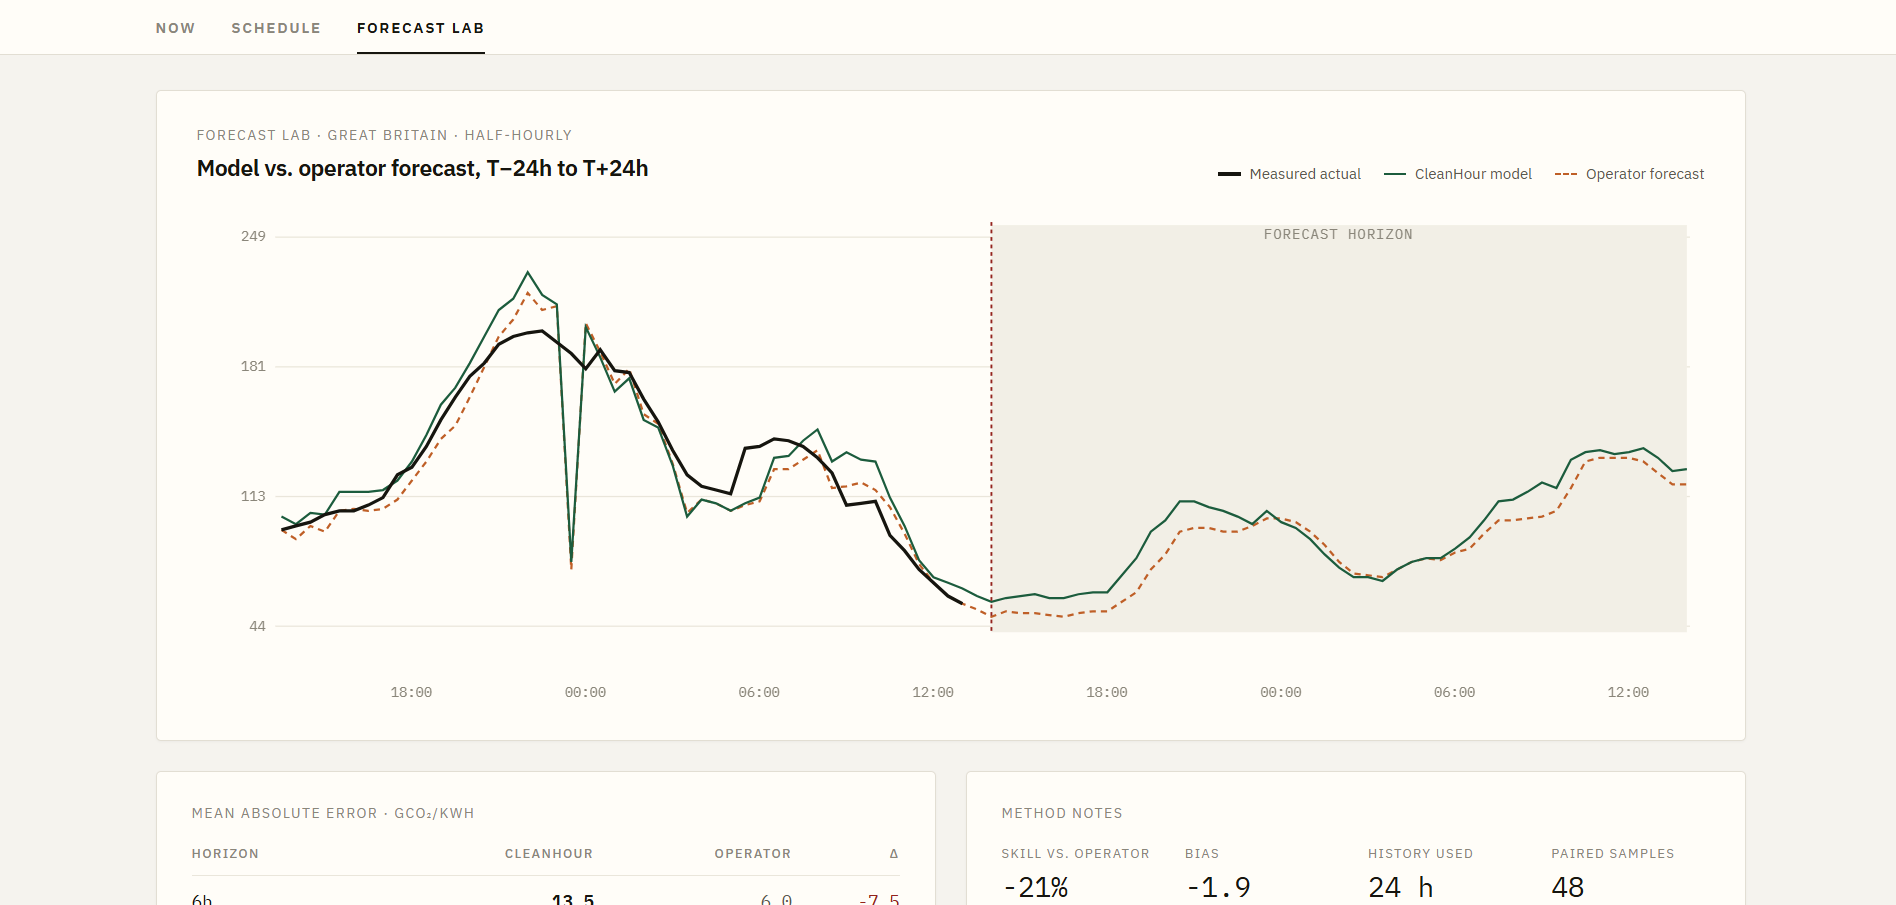
An honest backtest of CleanHour's model vs. the operator's forecast vs. reality. The model doesn't always win, and that's shown too.
Inspiration
Run a dishwasher right now versus three hours from now, and the actual carbon footprint behind it can be completely different. Same appliance. Same electricity bill. Totally different mix of wind, gas, coal, or solar behind the socket. Basically nobody has an easy way to see that difference, let alone act on it. For Earth Forward, that felt like the right problem to go after. Not a new device, not a new power source, just using the grid that already exists a little smarter.
Before vs. during the hackathon: CleanHour started as a UI-only mockup (just layout and design, no live data or working logic) built earlier in the NextStep Hacks 2026 period. Everything that actually works was built during this specific session, Sep 10 to 12, 2026: the live carbon-intensity integrations across 17 grid zones, the scheduling algorithm, the honest forecast and backtest model, state persistence, the lifetime-impact tracking feature, and the visual design.
What it does
CleanHour shows live carbon intensity for 17 real grid zones: Great Britain, France, Germany, and 14 US regions, pulled straight from grid operators, not estimates. On the Schedule tab you give it a task (dishwasher, laundry, an EV charge), its duration, power draw, and a deadline, and it finds the actual cleanest window in the next 48 hours that still meets that deadline. Every task's savings gets credited to a lifetime "Your Impact" counter that sticks around across visits, translated into something you can actually picture: kilometers of driving avoided.
The Forecast Lab tab is the part I'm proudest of. It's an honest backtest of CleanHour's own model against the grid operator's forecast against what actually happened. It doesn't always win. A couple US regions, a simple 3-day baseline genuinely beats the model, and that gets shown too, not hidden.
How I built it
It's a single self-contained HTML file. No backend, no server, every zone is a live client-side fetch. Each region turned out to be its own separate technical problem.
Great Britain and France (National Grid ESO, RTE) publish clean carbon-intensity numbers directly. For these I fit a per-time-of-day bias correction on top of the operator's own forecast, using a rolling 30-day window of forecast versus actual.
Germany (SMARD / Bundesnetzagentur) has no combined generation-mix endpoint, so the app pulls roughly ten separate per-fuel-type feeds and stitches them into one mix.
The US (EIA) publishes with about a 27-hour lag. That's invisible until you notice a "last 24 hours" chart is quietly showing yesterday's data, so the fetch window has to look back over a week to find the actual latest settled point.
For zones without an official forecast to correct, the Forecast Lab instead compares two honest baselines built from measured history: a 3-day same-hour average versus yesterday's same hour.
State (selected zone, power cap, scheduled tasks, the lifetime impact counter) persists in localStorage, and the live numbers quietly auto-refresh every 30 seconds without flashing a loading state.
Challenges I ran into
Early on, the Forecast Lab's accuracy numbers looked too good. Suspiciously good. Turned out the backtest was comparing the model's forecast against the actual reading for hours that had already happened. That's not a forecast, that's cheating. Fixed it into a real backtest, even though that meant admitting the model loses sometimes.
Taiwan almost made it in as an 18th zone. Found a great live feed, then found out their server lets you browse the page just fine but blocks the identical request the moment it looks like code asking for it. It's not in this version. Everything that is in here is real and live.
What's next
A Fingrid (Finland) integration is next on the list, plus figuring out whether the bias-correction approach holds up for more operators that publish their own forecasts.
Built With
- claude
- css3
- github
- html5
- javascript
- localstorage
- rest-api
- svg


Log in or sign up for Devpost to join the conversation.