-
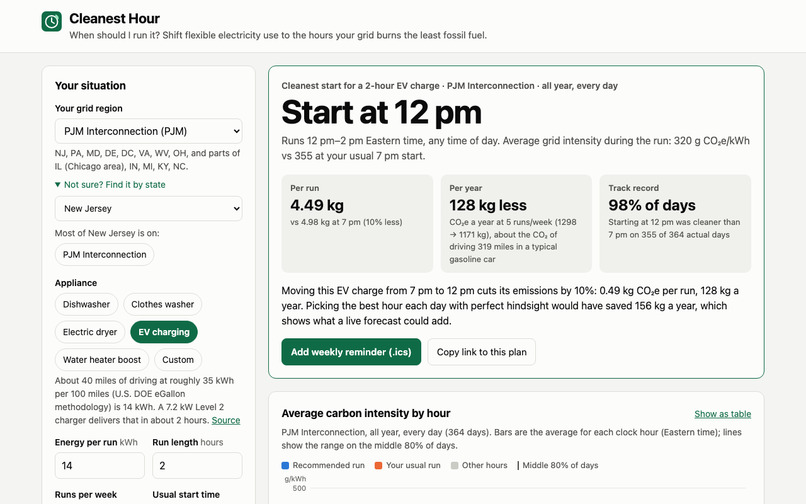
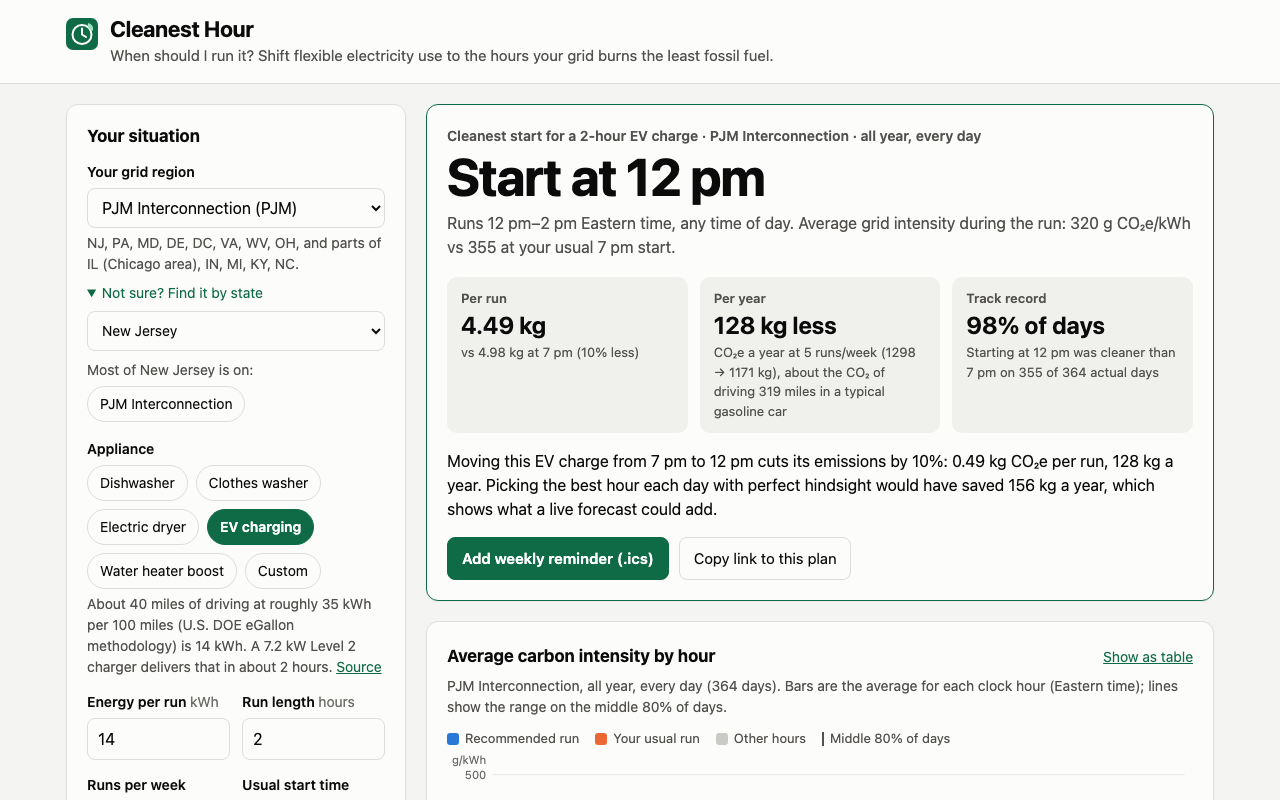
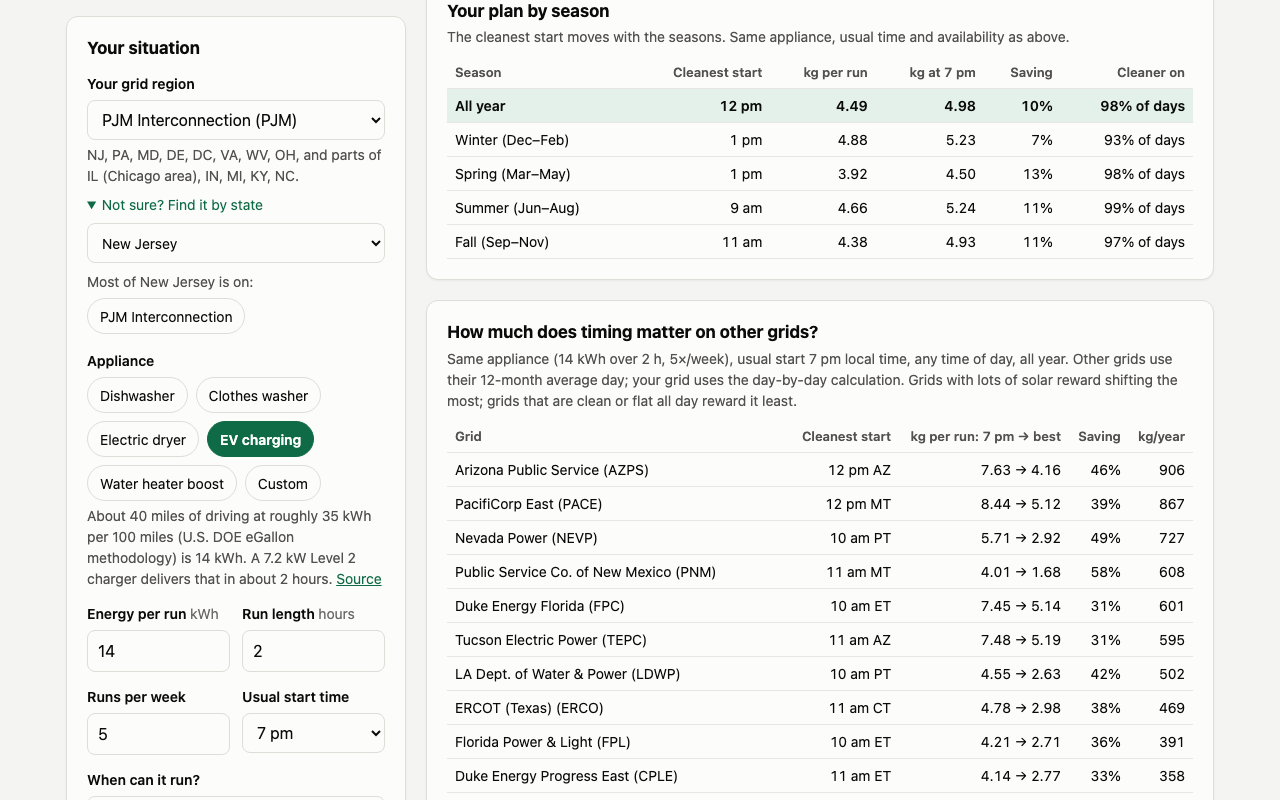
New Jersey (PJM) EV charging: start at 12 pm, 4.49 vs 4.98 kg CO₂e per charge, 128 kg less a year, cleaner on 98% of real days.
-
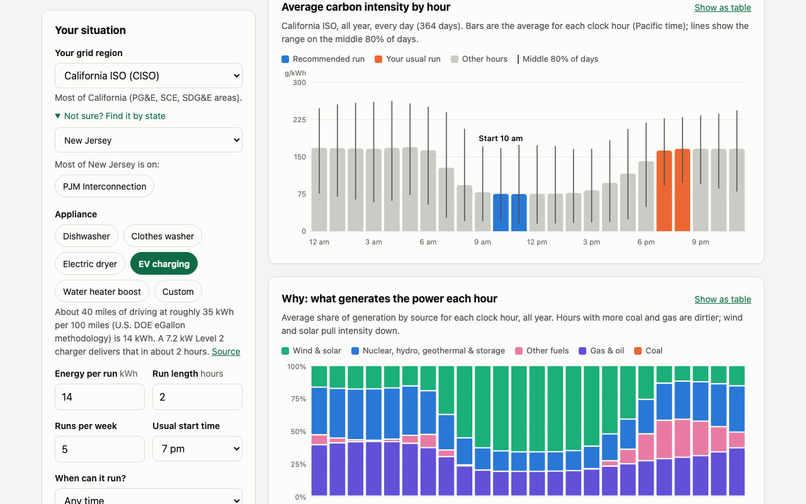
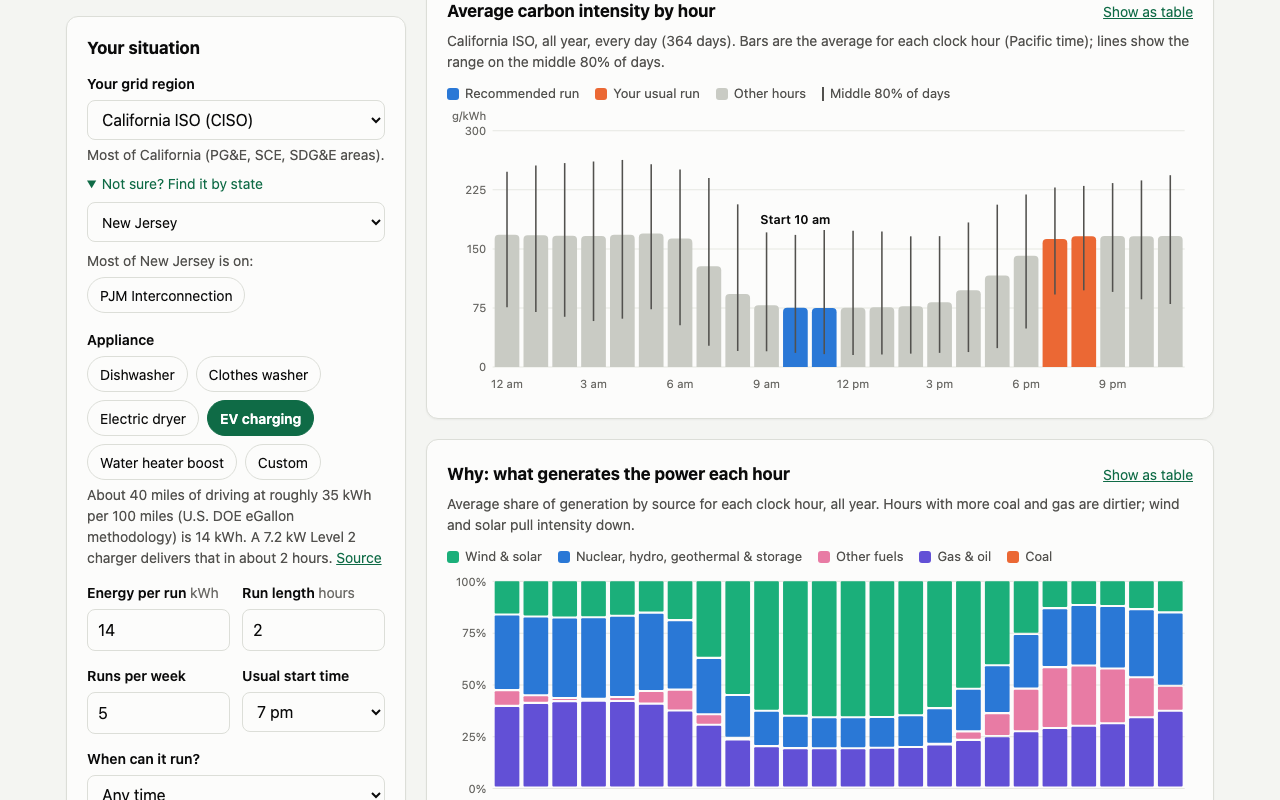
California's carbon intensity by hour: the midday solar dip, the recommended 10 am run (blue) vs the usual 7 pm (orange), and the mix.
-
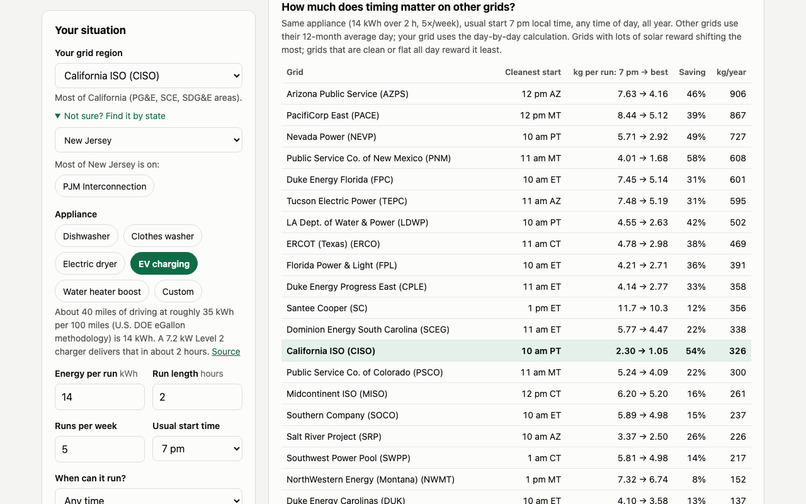
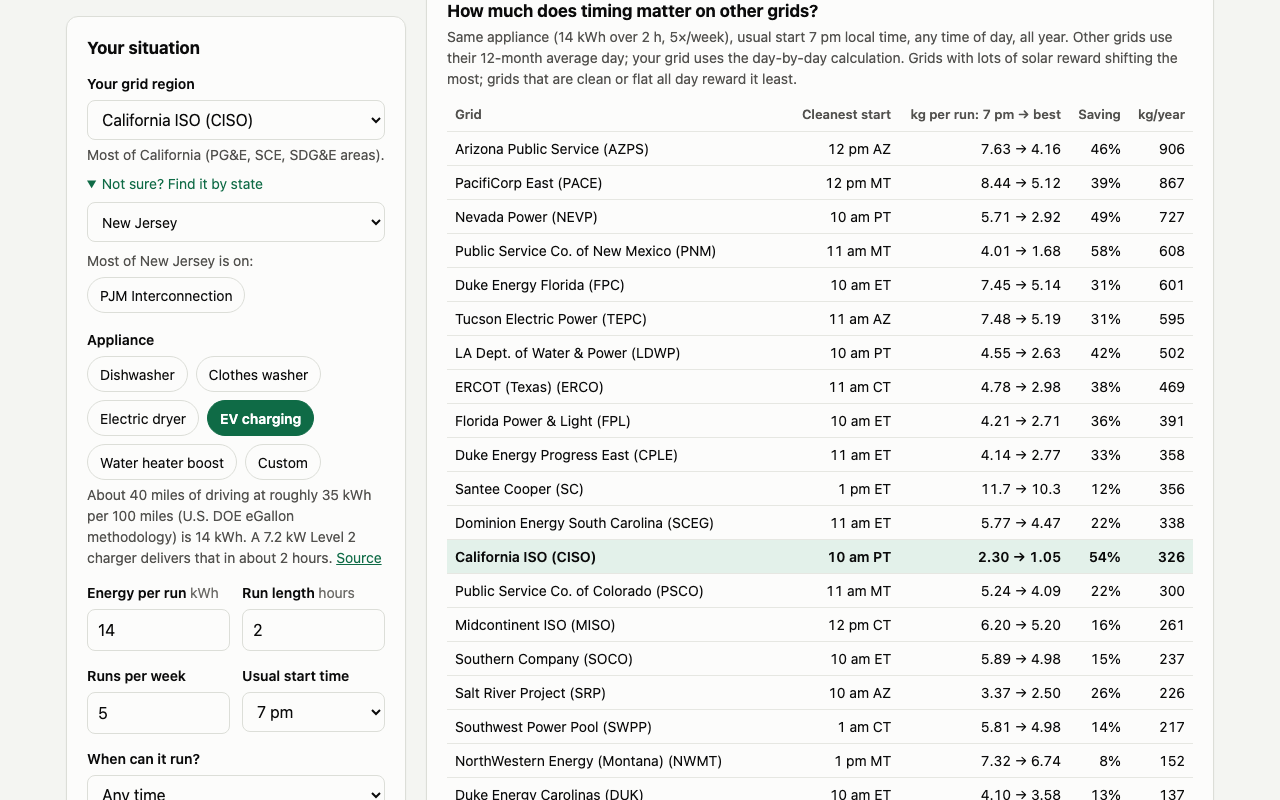
The same EV habit across 31 U.S. grids. Solar-heavy grids reward shifting the most.
-
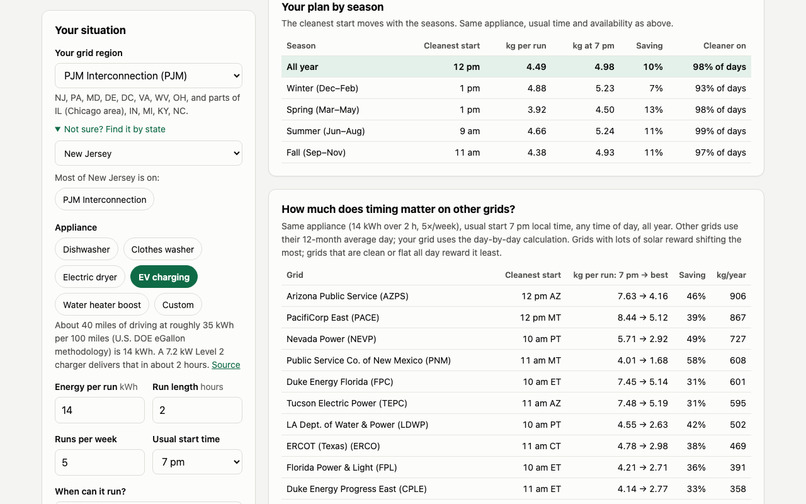
The cleanest start for each season in PJM, with the saving and the share of days it won.
-
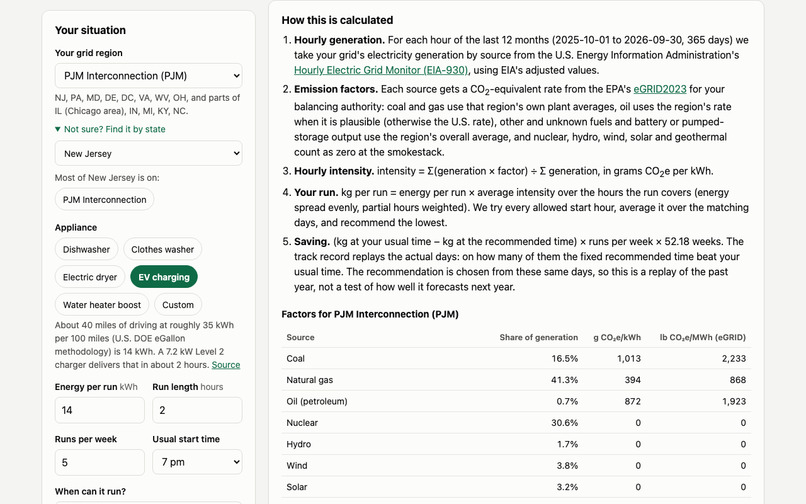
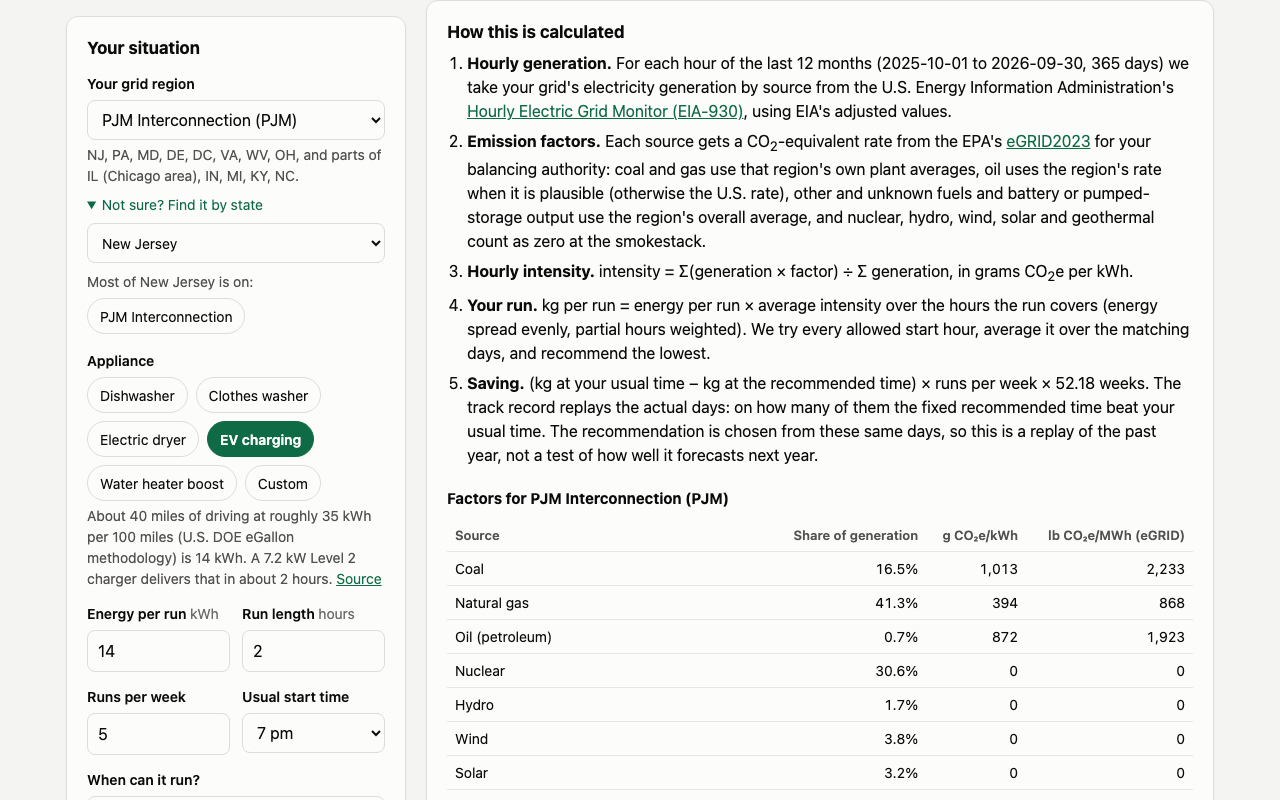
"How this is calculated": the formula, data sources and the exact emission factor for each fuel.
Try it
- Live demo (no install, no account, works offline after the first visit): https://bowen1314.github.io/cleanest-hour/
- Demo video (2 min 28 s, captioned, no audio): https://github.com/Bowen1314/cleanest-hour/blob/main/demo/demo.mp4 (transcript)
- Source code (MIT), including the data build script: https://github.com/Bowen1314/cleanest-hour
- Setup: none. Open the live demo, pick a grid region and an appliance.
Expected environmental benefit, quantified
Cleanest Hour cuts the emissions of electricity you were going to use anyway by moving it to cleaner hours. Every number below comes from the app's own calculation on 12 months of U.S. EIA hourly grid data (Oct 2025 – Sep 2026) and EPA eGRID2023 emission factors:
- New Jersey (PJM grid), EV charging (14 kWh, 5×/week): moving the charge from 7 pm to 12 pm saves 0.49 kg CO₂e per charge (10%), 128 kg a year. The noon start was cleaner than 7 pm on 355 of 364 actual days.
- All five presets together in PJM (dishwasher, washer, dryer, EV, water-heater boost at typical frequencies): 204 kg CO₂e a year, 10% of those loads' emissions.
- "Charge overnight" is the wrong rule on solar-heavy grids. For the same EV charge, the best overnight start in California is 1% dirtier than 7 pm and in Texas only 7% cleaner. A midday start is 54% cleaner in California (326 kg/yr) and 38% cleaner in Texas (470 kg/yr).
- The method is shown in the app: the formula, the exact emission factor for each fuel in your region, and the appliance energy sources. Users can see where every kg comes from.
Scale illustration (arithmetic on the PJM result above, not a measured outcome): 1,000 New Jersey EV drivers moving a 7 pm charge to noon would avoid about 128 t CO₂e a year.
Inspiration / Problem
A lot of household electricity use is flexible: dishwashers and washers have delay timers, EVs sit plugged in for hours, and water heaters can pre-heat. But the carbon intensity of grid power changes hour by hour, and people have no simple way to see when their own grid is cleanest. The popular rule ("run it at night") comes from time-of-use pricing, not emissions. On grids with a lot of solar, the cleanest power is at midday. The information exists (the U.S. EIA publishes hourly generation by fuel for every balancing authority), but not in a form a household can act on.
What it does
- Pick your grid region: 31 U.S. balancing authorities, including PJM (New Jersey), MISO, ERCOT, CAISO, SPP, NYISO and ISO-NE. A state finder helps if you don't know yours.
- Pick an appliance preset (energy per run and run length cited from ENERGY STAR / DOE, all editable), runs per week, your usual start time, and optionally when it is allowed to run (for example overnight only).
- You get the recommended start hour, kg CO₂e per run vs. your usual time, the yearly saving, and a track record (on how many real days of the past year the recommended hour won).
- Charts show the hourly intensity, with the spread across days, and the generation mix behind it. A season-by-season plan and a comparison across all 31 grids follow.
- A weekly calendar reminder (.ics) and a shareable link turn the result into a habit.
- A "How this is calculated" panel lists the method, factors, assumptions and limitations in plain language.
Intended users
Households with flexible electric loads (dishwasher, washer, dryer, EV, electric water heater) anywhere in the contiguous U.S. The demo uses New Jersey (PJM). It also suits sustainability clubs, campus housing and utilities' customer-education pages that want a free, transparent tool with no sign-up.
Approach
- Data pipeline (Python, run once, committed to the repo): reads EIA-930 six-month balance files (adjusted hourly net generation by energy source), assigns each fuel an EPA eGRID2023 CO₂e output emission rate for that balancing authority, and computes hourly intensity = Σ(generation × factor) ÷ Σ generation for 365 days × 24 hours. Hours are re-indexed from UTC into each region's customer time zone. EIA's "local time" for MISO, for example, is UTC−5 all year. Regions must pass a coverage and fuel-sum check against EIA's total generation.
- Static web app (plain HTML, CSS and JavaScript, hand-drawn SVG charts, no frameworks): evaluates every allowed start hour over the matching days and recommends the lowest. It replays the actual days for the track record and shows a perfect-hindsight bound. A service worker makes it work offline after the first visit. No server, no API keys, no tracking.
- Validation: the 12-month average intensity per region is compared against eGRID2023's annual average. 24 of 31 regions are within ±25%, and each outlier traces to a different generation mix in eGRID2023 vs. the 2025–26 data. Unit tests cover the math; an end-to-end Playwright test on the live site checks the displayed numbers against the calculation module run outside the browser.
How I built it
Python (csv, zoneinfo, openpyxl) for the build script; vanilla JavaScript ES modules for the app; SVG for charts, with a palette checked for color-vision deficiency; Node's test runner for unit tests; Playwright for end-to-end tests and the captioned demo recording; GitHub Pages for hosting.
Tools
JavaScript, HTML, CSS, SVG, Python, Node.js, Playwright, GitHub Pages. Data: U.S. EIA Hourly Electric Grid Monitor (EIA-930), U.S. EPA eGRID2023, ENERGY STAR certified-product data, U.S. DOE eGallon methodology. All are public domain. Built with an AI coding assistant (Claude); design decisions, testing and write-up reviewed by the author.
Challenges
- Messy official data. Some eGRID oil rates are implausible (one BA reports 63,048 lb/MWh, others are negative), so oil falls back to the U.S. rate outside a plausible band. California reports its batteries inside "Other": about −5.7 GW charging at 2 pm and +9.3 GW discharging at 8 pm on a June day. I made storage handling consistent across regions instead of letting reporting conventions change the answer.
- Time zones. EIA's "local time" isn't always the customers' clock. I rebuilt every hour from UTC and checked alignment against California's solar peak.
- Being honest about the method. Average vs. marginal emissions, history vs. forecast, and in-sample track records are easy to blur. The app states each one where the numbers appear.
Accomplishments
- A working, offline-capable tool for 31 U.S. grids that turns public hourly data into a single action ("start at 12 pm") with a kg figure attached.
- Every number on screen can be traced to a cited source and reproduced from scripts in the repo.
- A finding that matters for real advice: "overnight" is not the clean time on solar-heavy grids.
What I learned
The best hour is very grid-specific: midday on solar grids, the middle of the night on wind-heavy SPP, and only modest differences on nuclear- and gas-heavy PJM and NYISO. Publishing the spread (the track record, the middle-80% band) makes a recommendation more trustworthy than the average alone.
Limitations
- Average, not marginal, emissions. The plant that actually responds to a shifted load can be cleaner or dirtier than the average, so real avoided emissions may be smaller or larger than shown.
- History, not a forecast. The recommendation is a fixed habit from the past 12 months, and the track record is in-sample (the hour is chosen and scored on the same days).
- Generation-based: imports between regions are not traced.
- Smokestack (combustion) emissions only, using 2023 eGRID factors on 2025–26 generation, one factor per fuel per region.
- Storage discharge gets the region's average rate.
- Appliance energy is assumed even over the run. Presets are typical values, editable by the user.
- Balancing-authority boundaries don't follow state lines. Alaska and Hawaii aren't covered.
- No user testing with households has been done yet.
- The per-household saving is modest: tens to hundreds of kg a year. The value is that it is free, repeats weekly, and scales.
What's next
Marginal emission rates (NREL Cambium, a free public dataset) alongside the average; an optional day-ahead mode using EIA's demand forecast; smart-plug and EV-charger schedule export; and a short user test with student households to measure whether people actually shift their usage.
Built during the event and credits
All project work (data pipeline, app, tests, screenshots, video and this write-up) was created during Green Shift Hacks, starting October 24, 2026. No pre-existing project code was reused. Data: U.S. EIA Hourly Electric Grid Monitor (EIA-930), U.S. EPA eGRID2023, ENERGY STAR certified-product data and the U.S. DOE eGallon methodology, all public domain. Code: MIT. Built with an AI coding assistant (Claude); design decisions, testing and write-up reviewed by the author.

Log in or sign up for Devpost to join the conversation.