Inspiration
Air Quality is often an overlooked statistic in weather apps that people usually ignore. Extreme Air quality can have harmful effects such as coughing, wheezing, and shortness of breath. After the Canadian Wildfires, Air quality became a major issue for a brief moment in the US. People were forced to realize that Air quality is something they should worry about their health. We decided to build an app that helps relieve this worry.
What it does
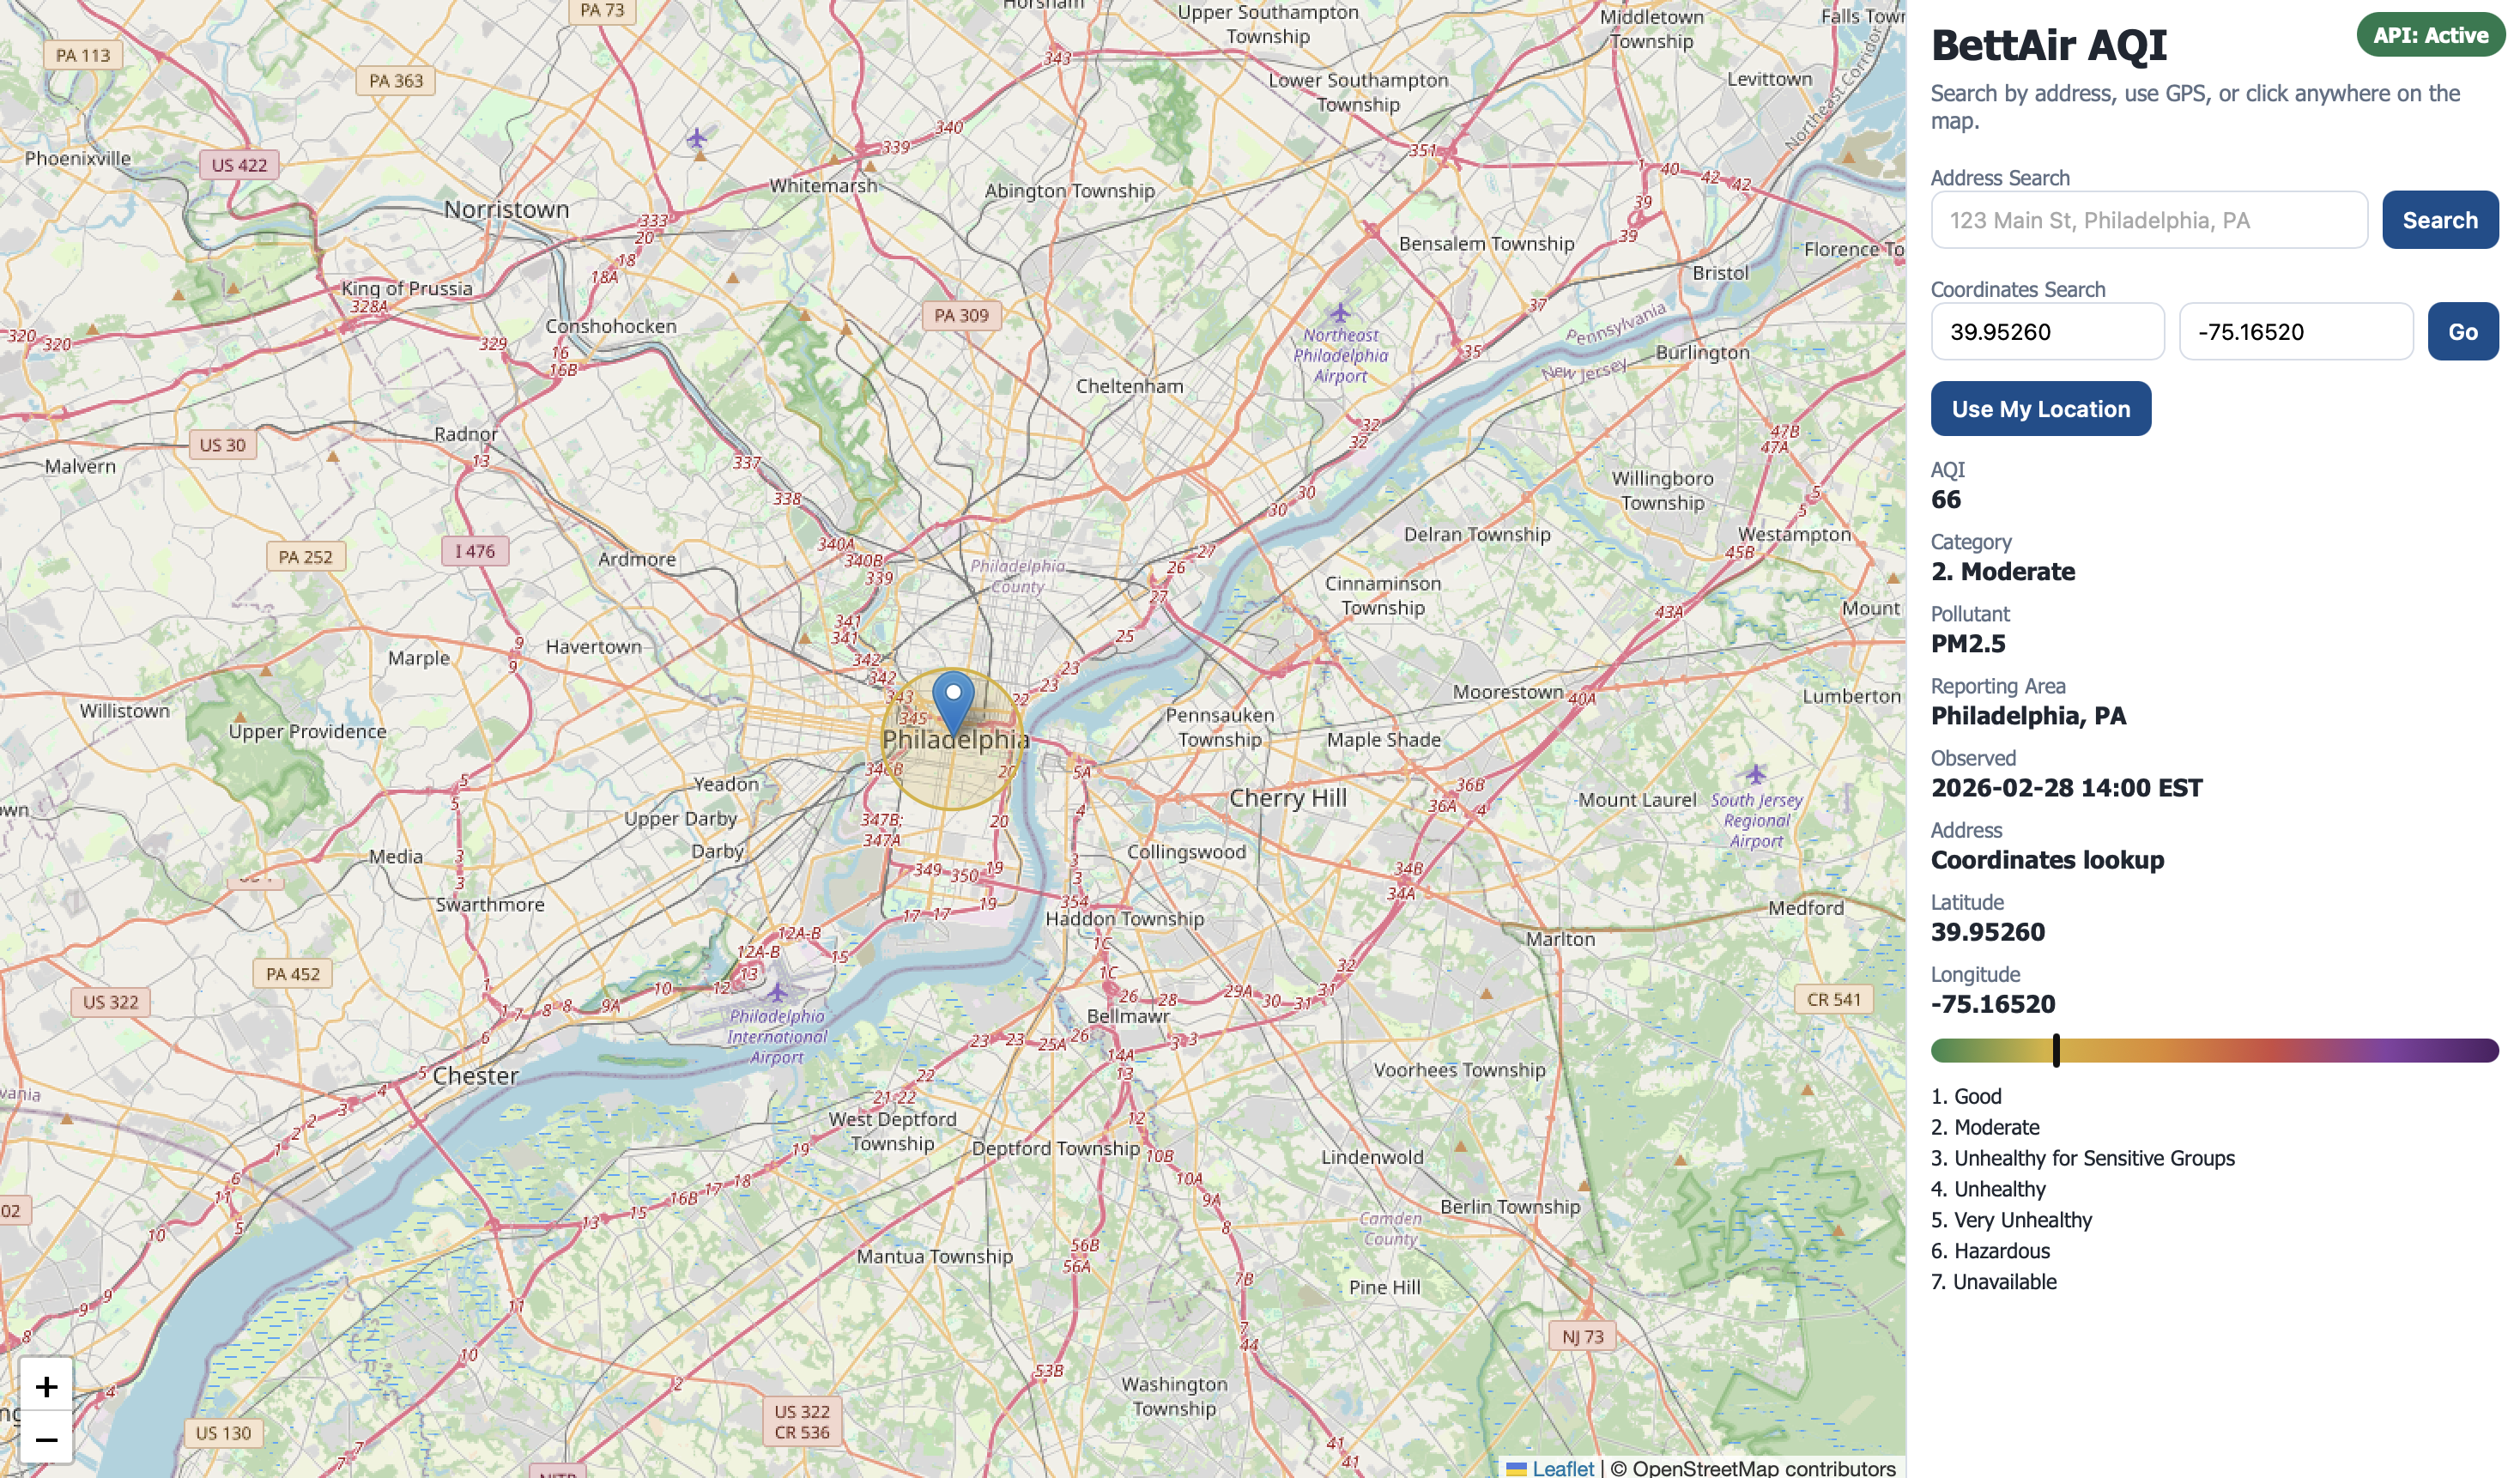
BettAir is a USA-focused web app that allows users to search an address and view outdoor air-quality information for that location. After the user enters an address, the app finds the corresponding latitude and longitude, places that point on an interactive map, and displays the AQI in a clear visual format. The interface also includes a color-based air-quality meter and the pollutant being reported from the AirNow API, so users can quickly understand the current air conditions in that area. BettAir is designed to turn raw location and AQI data into something easy to read and useful at a glance.
How we built it
We built BettAir using HTML, CSS, JavaScript, and Leaflet on the front end, with Flask and Python on the back end. We used the Geocodio API to convert addresses into latitude and longitude coordinates, and we used the AirNow API to retrieve air-quality data for those locations. Our back end handles the API requests and sends the relevant information to the front end, where JavaScript processes the response and updates the interface. We also created a color-based index system so users can quickly understand whether the air quality in a selected area is better or worse.
Challenges we ran into
One of the biggest challenges was connecting multiple parts of the project into one smooth process. We had to make sure that an address entered by the user could be converted into coordinates correctly, then passed into a second API call, and then returned to the front end in a way that was easy to display. Another challenge was simplifying the final output so that users could understand the result quickly instead of reading through raw API responses. Since we were building a fast demo, we also had to stay focused on the core features and make sure the main user flow worked reliably.
Accomplishments that we're proud of
We are proud that we built a working prototype that connects address search, geocoding, AQI retrieval, pollutant reporting, and map display into one experience. We successfully created a full flow from user input to live output, which made the project feel interactive and real instead of just conceptual. We are also proud that BettAir presents air-quality information in a way that is simple, visual, and easier for everyday users to understand.
What we learned
We learned a lot about how data moves through a full-stack application. This project showed us how front-end and back-end systems work together when handling user input, external API calls, JSON responses, and dynamic updates on a map. We also learned that design matters just as much as functionality when working with public-facing information. Even when the data is correct, it still has to be presented in a way that people can understand quickly.
What's next for BettAir
Our next step is to improve the accuracy, clarity, and usability of the platform. We want to make the AQI display more informative, refine the pollutant breakdown, and continue improving how the data is presented visually on the map. We also want to make BettAir more polished as a user experience so that it feels like a tool people could realistically use to better understand outdoor air quality in Philadelphia.

Log in or sign up for Devpost to join the conversation.