-

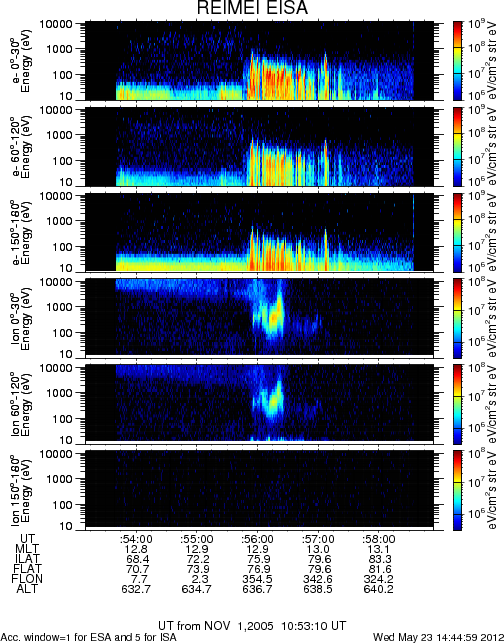
Sample uncropped REIMEI EISA QuickLook plot of alfvenic aurora.
-
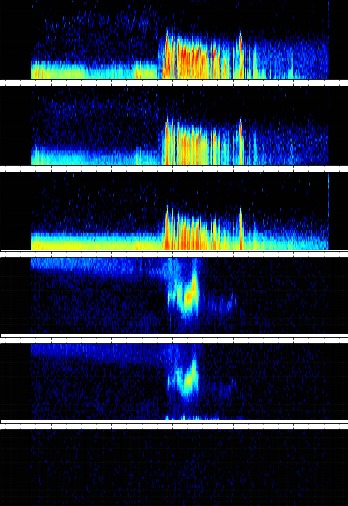
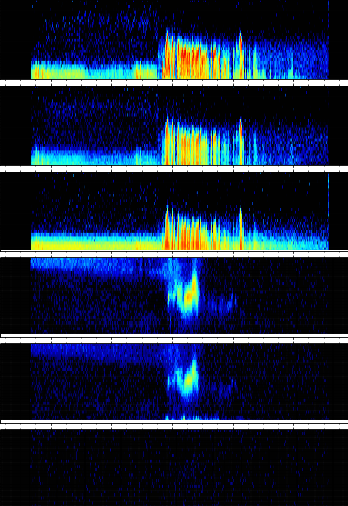
Sample cropped REIMEI EISA QuickLook plot of alfvenic aurora.
-
 GIF
GIF
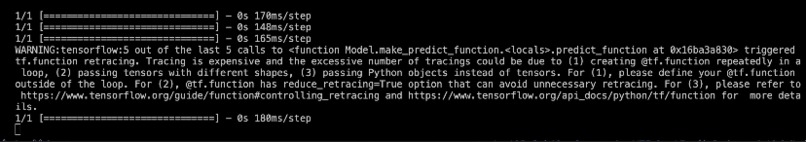
Plot/image classification progress - slower because I was screen recording.
-

Almost 8.5k plots/images were classified. This ~1GB of images represents close to 200GB worth of satellite data.
-

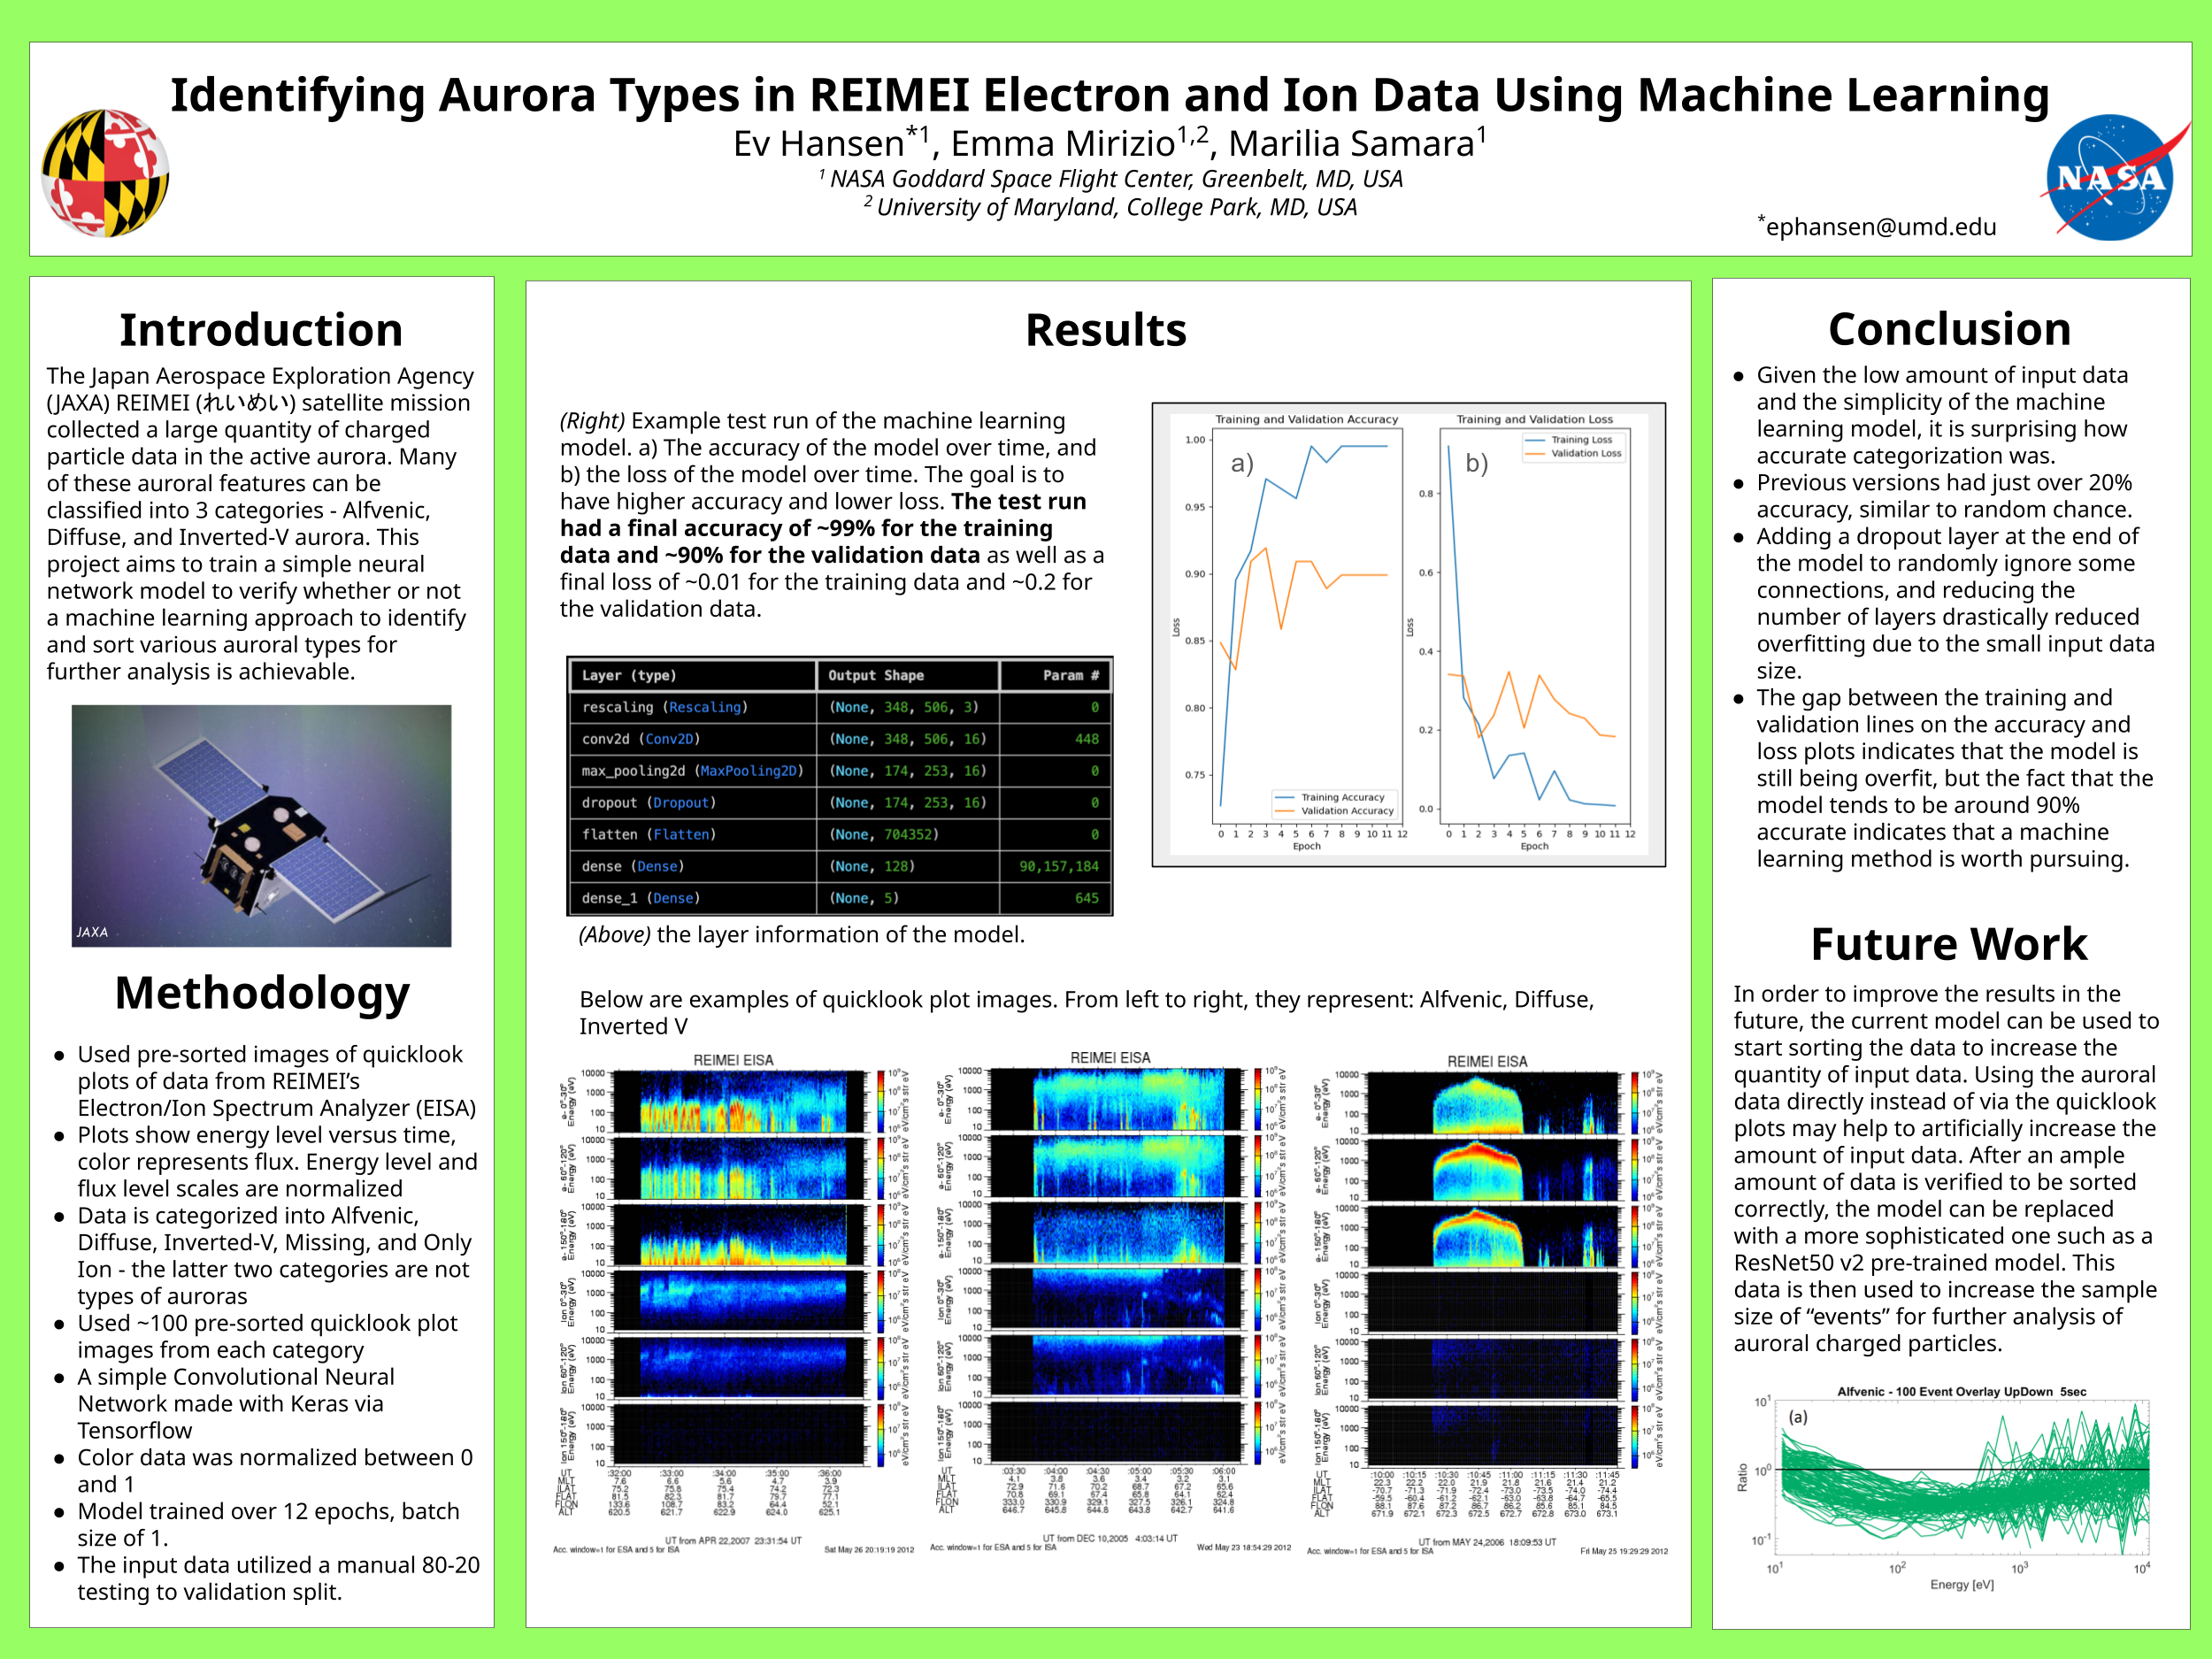
Poster from the end of my Summer 2024 internship, before the automation process was completed @ Technica. Unfortunately, it got compressed.
Inspiration
This project is a continuation of a Summer 2024 heliophysics research internship @ NASA GSFC that I will be presenting at AGU 2024. My mentors are working on models of the ionosphere using this data, and suggested the project to me given my programming experience and the amount of data that still needs to be categorized.
REIMEI, a Japanese satellite mission, collected a lot of data from the northern lights (or aurora) from 2005 to 2012. There are different types of auroral phenomena, some include Alfvenic, Diffuse, and Inverted-V aurora. Given there is around 200GB of raw data to comb through, an automation process would be handy to help ease some of the work.
The data that is being sorted consists of EISA QuickLook plots from REIMEI. The top 3 plots of each image corresponds to ion data, and the bottom 3 represent electron data. Each image represents a small period of time, mostly around 4-5 minutes. The horizontal axis is a time axis, vertical axis corresponds with the energy level, and the color represents the flux measured. Flux and energy levels are on logarithmic scales and are normalized across all plots. Each top, middle, and bottom plot from each category (ion, electron) represents data measured at different pitchangle ranges. The plots were not generated by me, but were already available to my team.
What it does
Multiple scripts are included in the project.
crop_images.pycrops REIMEI EISA QuickLook plots to just the plot regiontrain_model.pytrains and saves a CNN model using pre-categorized plotsuse_model.pyuses models to categorize/sort plots
How I built it
Fully written in python, utilizing TensorFlow/Keras for a CNN.
Challenges I ran into
GitHub won't let me push the .keras model files, meaning those checking the repo can't try the program at the moment, especially since I am unsure if I can redistribute the training data. Additionally, there probably is not enough training data, though the goal of this stage is to use my project to gain more training data for a future model, so this aspect is currently less important.
Accomplishments that I'm proud of
Automation of the sorting process was completed, allowing the use of multiple saved models to "vote" for each input's classification, a process that should help improve accuracy.
What I learned
GitHub doesn't let you push files over a certain size limit – makes sense.
What's next for Classifying REIMEI Auroral Plots using CNNs
The sorted/classified plots need to be verified by my mentors before further work can be done. After verifying a new set of plots, the trained models can be fully evaluated based on their accuracy with new data. The goal will be to make better and better CNNs (or other relatively simple ML models) to replace older ones, before eventually replacing simple models with a more sophisticated one such as a RESNET50 model.
Built With
- cnn
- git
- github
- keras
- machine-learning
- matplotlib
- numpy
- python
- tensorflow
- visual-studio-code


Log in or sign up for Devpost to join the conversation.