Inspiration
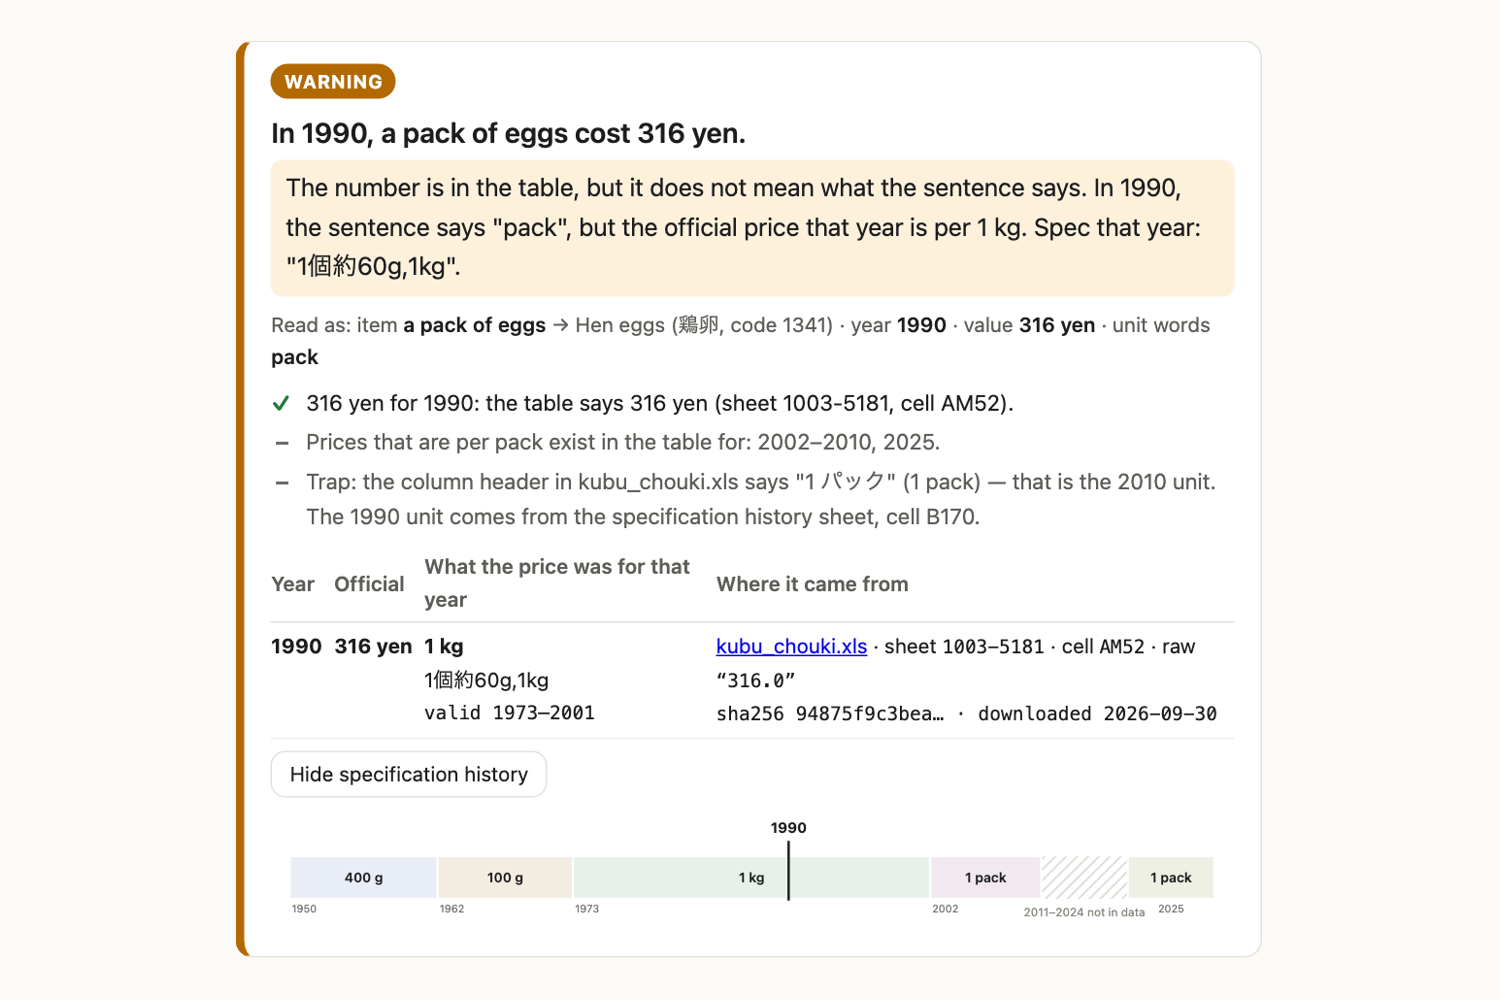
I make short Japanese quiz videos about everyday prices, and every number comes from the government's Retail Price Survey. One script said "a pack of eggs cost 316 yen in 1990." The number is in the official table, and our fact-check sheet had marked it as matching. But the 1990 egg price is per 1 kg: the survey priced eggs by weight from 1973 to 2001 and switched to a 10-egg pack in 2002. The spreadsheet's column header says "1 pack" because that is the 2010 unit; the unit for each year is only in a separate "change of items and specifications" sheet. We noticed a day before publication, by looking at a chart of the whole series. A number can match and still be wrong.
What it does
Paste a script in English or Japanese. Every sentence with an item, a year and a yen value (or a ratio such as "1.5 times") becomes a card:
- MATCH — the value, and its unit if the sentence names one, agrees with the table
- WARNING — the number is in the table but measures something else: the unit that year differs from the sentence, the specification changed between the two years compared, or the two years are different survey items
- MISMATCH — the table says a different number or ratio
- NOT COVERED — outside the data, instead of a guess
Each card cites the file, sheet, cell, raw cell text, download date and SHA-256 of the official file, shows the specification that applied that year, and draws the item's specification timeline with the claimed years marked. The same check runs on the command line and exits non-zero on WARNING or MISMATCH, so a video pipeline can run it before publishing.
Who it's for
Creators of short money and explainer videos, teachers and writers who quote Japanese "then vs now" prices — and our own quiz series, where production is automated and needs a check that shows its evidence.
How we built it
Built from an empty folder during the submission period with Claude Code and the Devpost Learn skills (scope → PRD → spec → build; the planning documents are in the repository's devpost/ folder). I delegate day-to-day production to the agent and set the direction; the agent wrote the code, the planning documents and this write-up from my project records, and I watched the demo before submitting.
- Python standard library for checking and the local web page; xlrd and openpyxl only to rebuild the data.
- Data: 33 official files — the long-term Tokyo ward area table (1950–2010, 287 items, with the specification-history sheets) and the 2025 annual tables (522 items).
- Claims are read by small rules, not a language model, so every answer is reproducible and points to a cell.
- 22 regression checks, including the egg case.
Challenges we ran into
- The specification history is written in Japanese era years ("昭和48年~平成13年" = 1973–2001) in several formats; three lines had no colon. All 1,160 history lines now parse.
- Pairing values with years: "204 yen in 2002 to 307 yen in 2025" puts each value before its year, while Japanese puts the year first. Pairing by order of appearance fixed both.
- Deciding what counts as a warning: a unit change is a warning; the same unit with different wording (eggs: L size in 2002, mixed sizes in 2025) is shown as a note listing only the words that differ.
What we learned
Checking that a number exists in the source is not the same as checking the claim. The definition of the number in that year has to be looked up where the source records it — and that lookup belongs in the tool, not in a reviewer's memory.
What's next
Years 2011–2024 (about 32 files per year), other official series (CPI, wages), and running it on every quiz script before it is published.
Data: 総務省統計局「小売物価統計調査」(https://www.stat.go.jp/data/kouri/doukou/3.html)を加工して作成 — Statistics Bureau of Japan, Retail Price Survey, processed by ClaimCheck JP. Not made or endorsed by the Statistics Bureau.
Built With
- claude-code
- css3
- devpost-learn
- e-stat
- html5
- javascript
- python

Log in or sign up for Devpost to join the conversation.