Our Approach
Manually reviewing tractor driving data is both time-consuming and expensive. The goal of this project was therefore to explore ways to reduce the amount of data that needs to be inspected manually and to better understand how this process could be made more efficient. One of the main challenges is not just detecting known objects or standard situations, but also identifying unknown or unusual scenarios as relevant. In agricultural environments, unexpected objects or situations can be safety-critical and should not be missed.
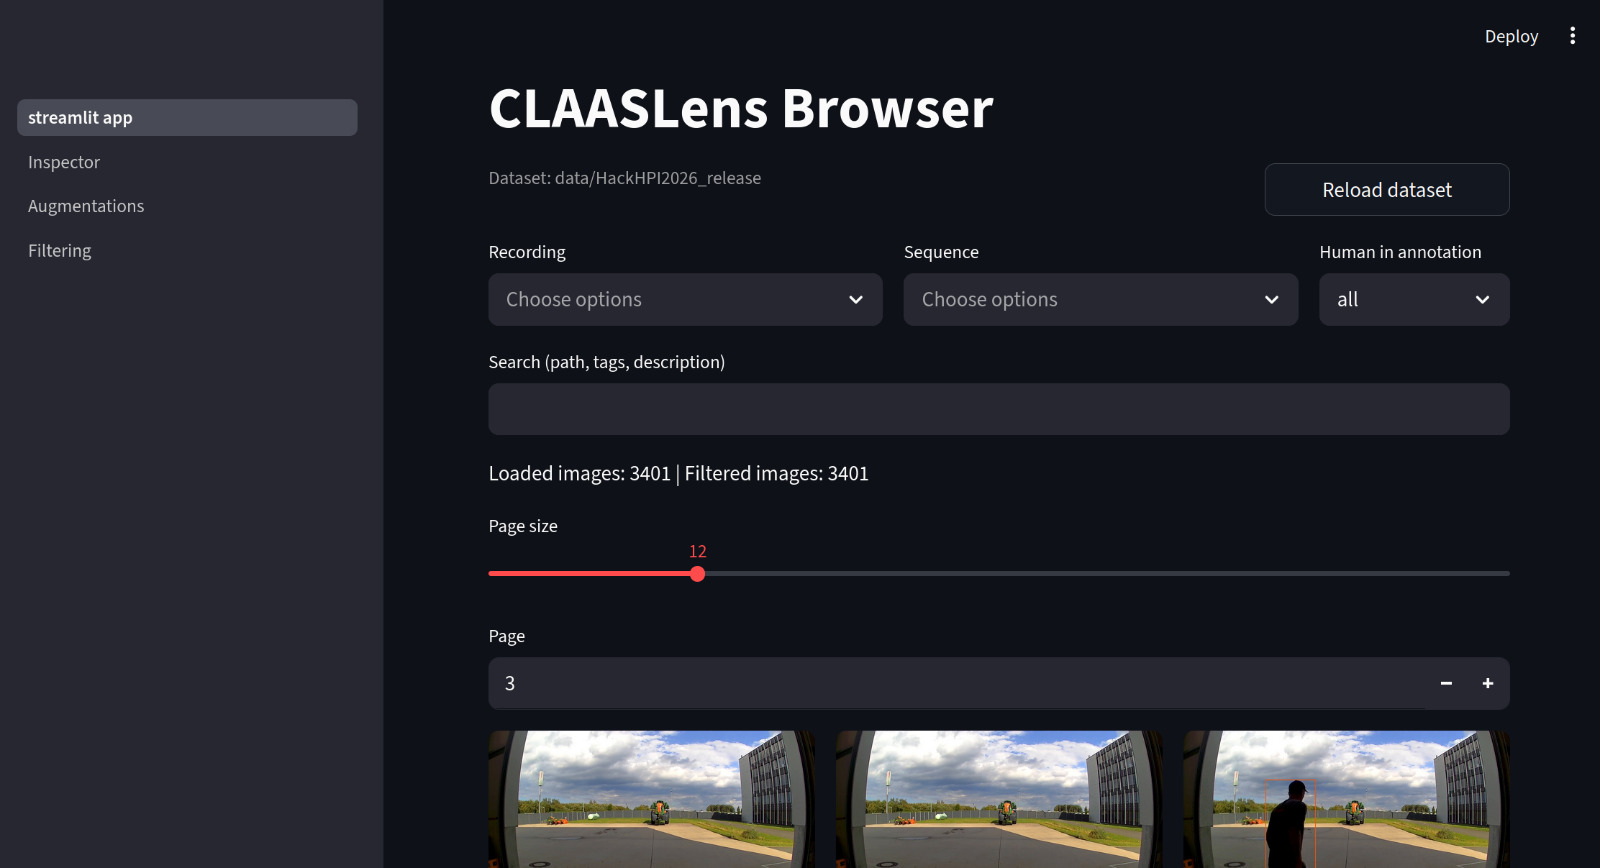
Data Analysis
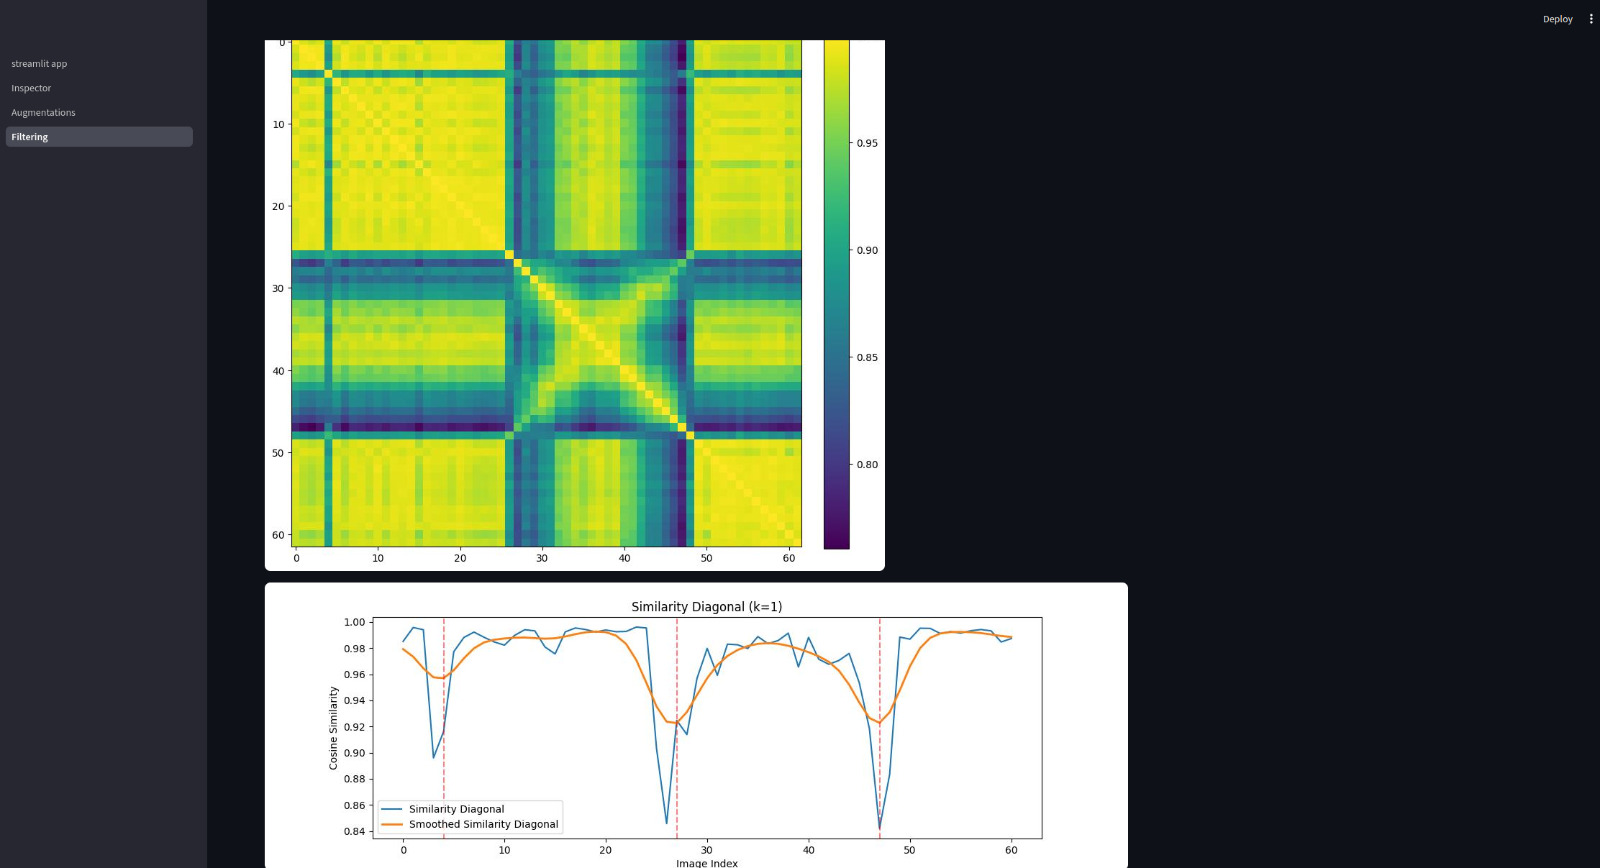
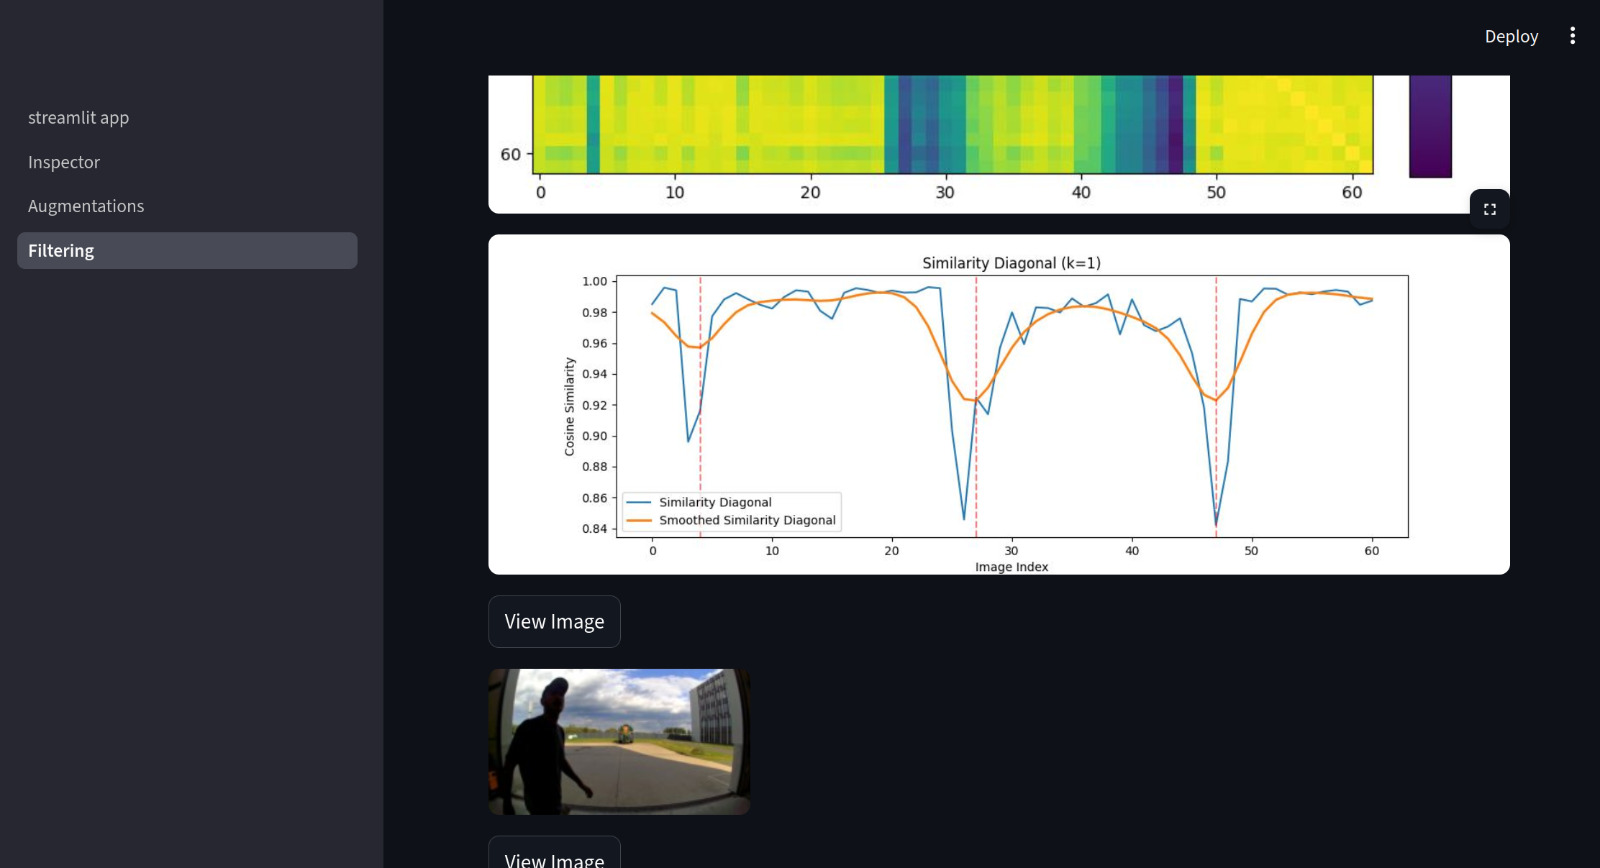
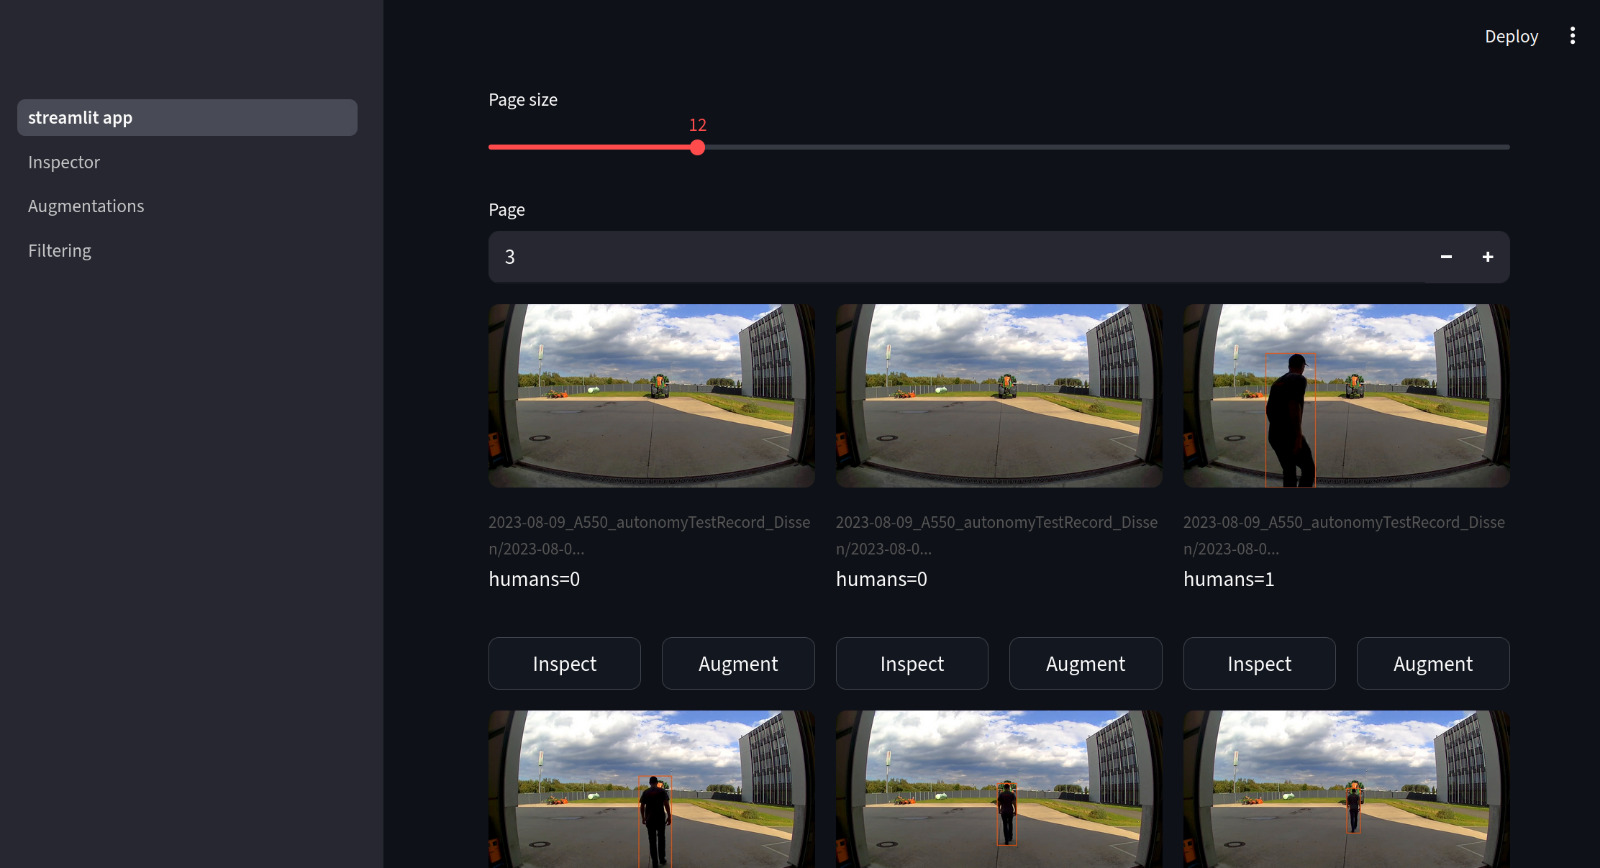
Our data analysis approach combines visual inspection with embedding-based similarity analysis to identify patterns and detect anomalies in tractor driving sequences. By performing an initial visual analysis of the dataset, we were able to identify recurring patterns in typical driving scenarios. These patterns can be used as a reference for detecting deviations from “normal” behavior, i.e., potential anomalies. This makes it possible to reduce the number of images that need manual review from several million to only a small, relevant subset. To capture semantic information from the images, we used embeddings generated by a CLIP-based model. These embeddings allow us to compare images on a higher-level, semantic basis rather than relying on raw pixel differences. We first constructed a graph-like structure by comparing each image with its immediate successor in the sequence. By measuring the similarity between consecutive frames, we were able to detect significant changes in the visual scene. Sharp drops in similarity appear as noticeable “spikes” in the graph and indicate potential anomalies. These include events such as: • person / animal entering the field of view • sudden changes in direction (e.g., the tractor turning) This approach provides a simple but effective way to highlight moments where the scene changes abruptly.
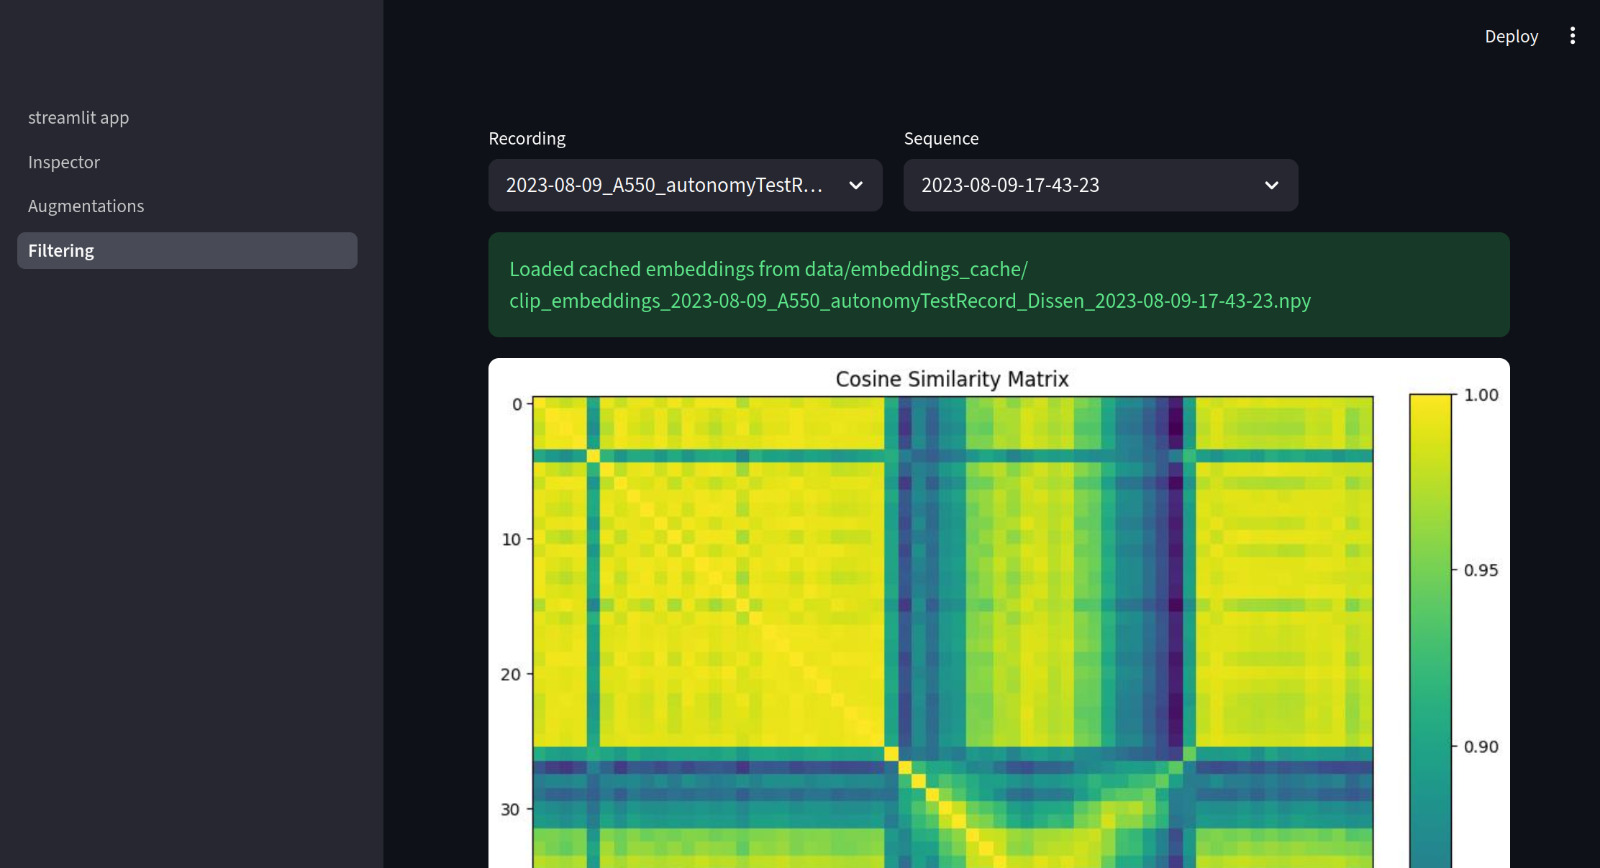
To gain a more detailed understanding of the data, we additionally computed a pairwise cosine similarity matrix across all images. In this matrix: • The diagonal represents each image compared with itself, which naturally results in maximum similarity (visible as bright yellow). • Off-diagonal values capture similarities between different images. Distinct patterns emerge from this representation: • Thick dark blue grid-like structures correspond to major scene transitions, such as the tractor turning. In these cases, the entire visual composition changes significantly, leading to strong drops in similarity. • Thinner dark blue lines indicate more subtle anomalies, where changes occur within otherwise familiar scenarios (e.g., small unexpected objects appearing in the scene).
We analyzed tractor driving data using embedding-based similarity to detect anomalies and extended the dataset with augmentation. This matrix-based analysis allows us to identify both global structural changes and localized anomalies, providing a more nuanced view of the dataset. Overall, this combination of sequential similarity and global pairwise analysis enables an efficient identification of relevant frames, significantly reducing the amount of data that needs to be manually reviewed.
EVALUATION
The embedding-based analysis was evaluated qualitatively by examining its ability to highlight meaningful changes in the image sequences. By comparing consecutive frames and analyzing the pairwise similarity matrix, the approach consistently identified both major scene transitions (e.g., tractor turns) and smaller, localized anomalies. The observed patterns in the similarity graph and matrix align well with expected changes in the data, indicating that the embeddings capture relevant semantic information. In particular, sharp drops in similarity correspond to significant visual changes, while more subtle variations are reflected in smaller deviations. Overall, the method proved to be effective in reducing the amount of data that requires manual inspection by directing attention to visually distinct or unusual frames.
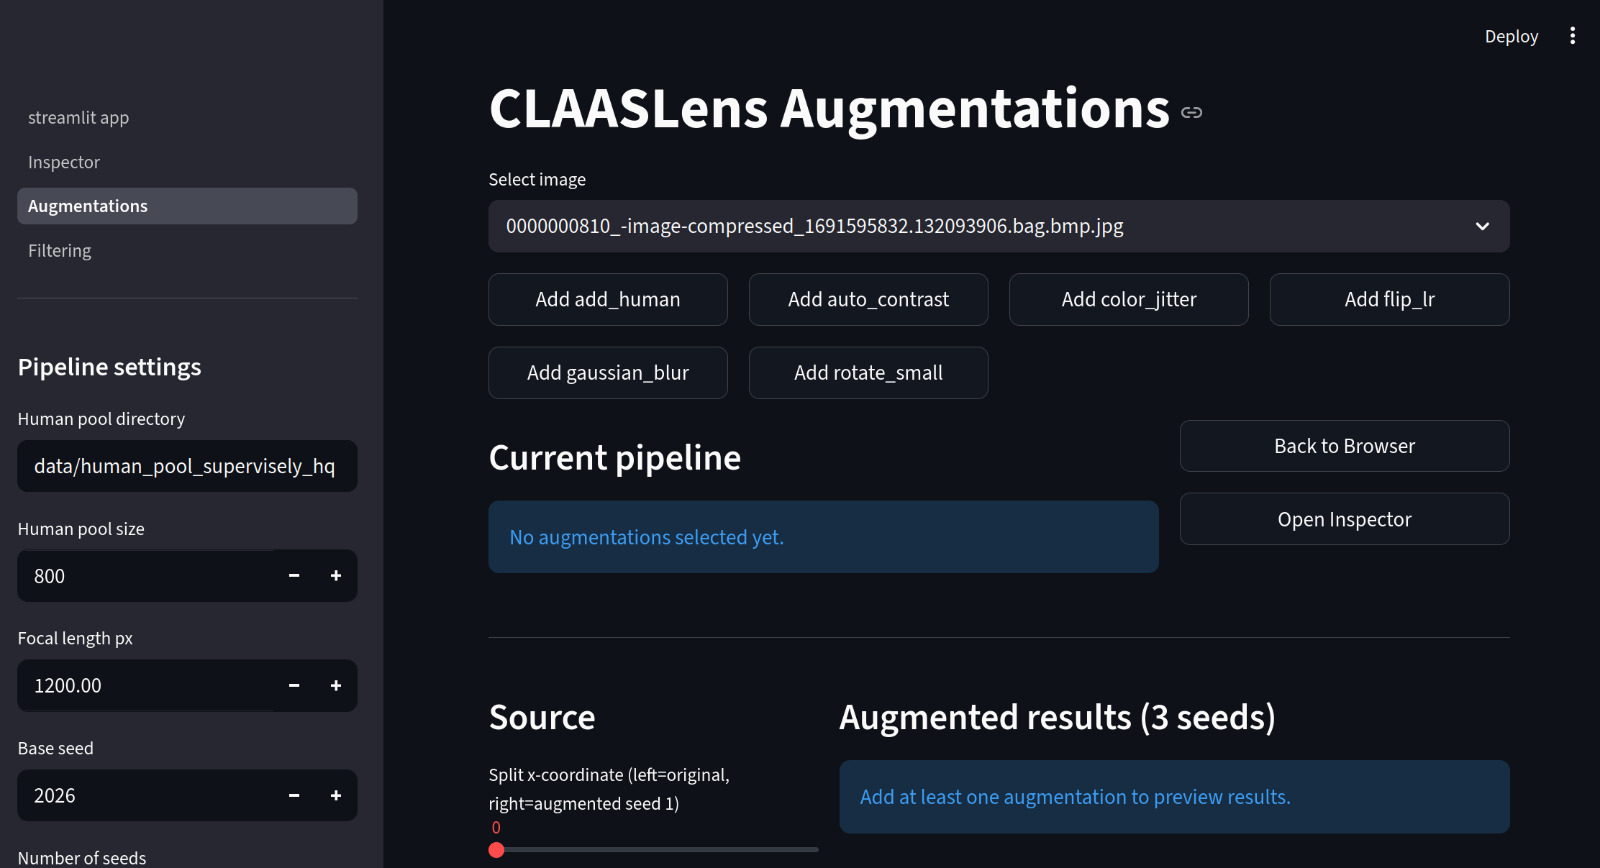
Synthetic Data Pipeline
Another important limitation is that it is nearly impossible to cover all possible real-world situations a tractor might encounter using only recorded driving data. The variability of environments, objects, and events is simply too large. On top of that, the effort required for manual data analysis makes it difficult to collect large amounts of labeled training data, which in turn limits the effectiveness of data-driven approaches. To address this, we explored the idea of extending the dataset with synthetic data. This allows us to simulate rare or hard-to-capture scenarios and provides a stronger foundation for potential future model training. It is important to note that this project does not focus on building or training a model. Instead, the goal is to analyze and prepare data in a way that could support such approaches in future work.
EVALUATION
Since no model was trained as part of this project, the evaluation focuses on qualitative aspects of the proposed approach, in particular the usefulness and consistency of the generated synthetic data. The synthetic data was first assessed in terms of visual plausibility. Generated samples were compared to real-world data to ensure that scene structure, object composition, and environmental conditions appear realistic and consistent with the original dataset. In addition, the effectiveness of the synthetic data was evaluated based on its ability to extend the dataset in a meaningful way. By generating additional samples for already observed scenarios and introducing variations in lighting and weather conditions, the dataset becomes more diverse and better represents both common and less frequently occurring situations. Furthermore, a subset of randomly generated images was included to simulate unknown or unexpected situations. These samples are not tied to specific observed patterns but aim to introduce additional variability and explore how such out-of-distribution scenarios could be represented. Overall, the evaluation indicates that the synthetic data provides a useful extension of the dataset by reinforcing known patterns, increasing variability in environmental conditions, and introducing additional diversity through randomly generated scenarios. While no quantitative performance metrics are available, the approach demonstrates clear potential to support future data-driven methods and reduce reliance on purely manually collected data.
Future Work
Building on the findings of this project, several directions for future work emerge. A natural next step would be to integrate the proposed analysis pipeline into a fully automated anomaly detection system. This would involve training a model that leverages embedding-based similarity measures to identify and classify relevant events without requiring manual inspection. Another important extension is the systematic use of synthetic data. While this project explored the concept, future work could focus on generating targeted synthetic scenarios based on identified gaps in the dataset. This would allow for a more controlled and scalable way of improving data coverage, especially for rare or safety-critical situations. Overall, this work represents an initial exploration of the problem and highlights how embedding-based analysis and synthetic data could be used to support more efficient data processing in this domain.

Log in or sign up for Devpost to join the conversation.