-
-
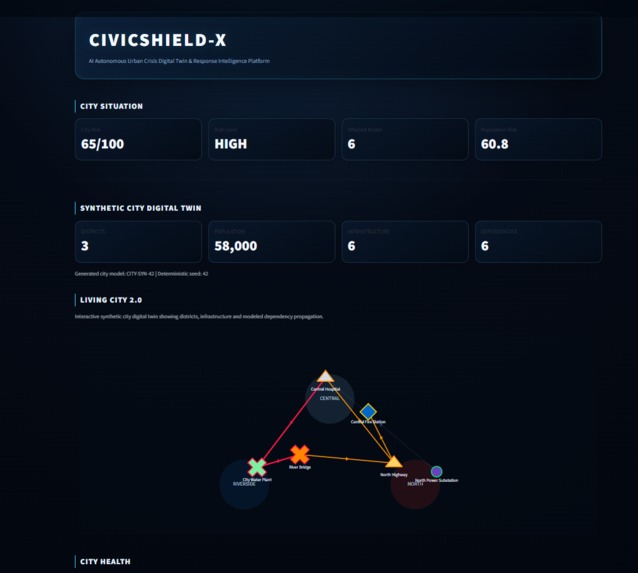
City Situation and Living Digital Twin
-
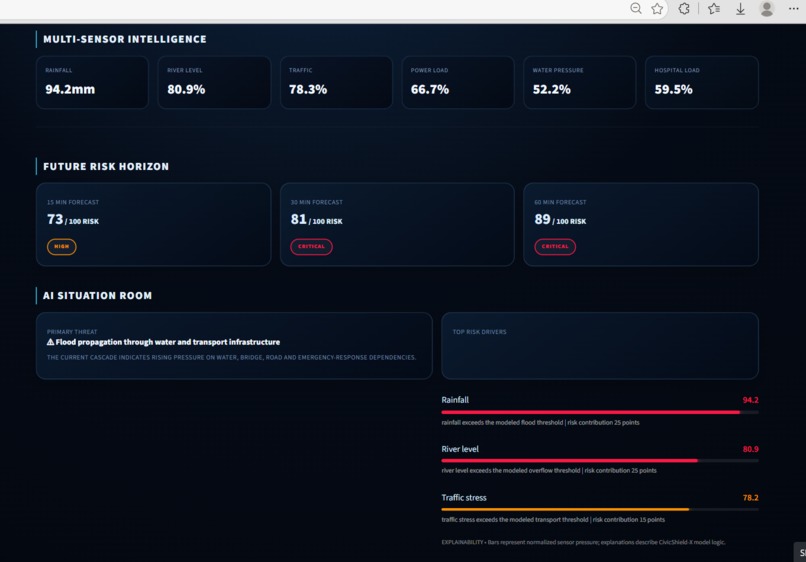
Crisis Intelligence and Propagation
-
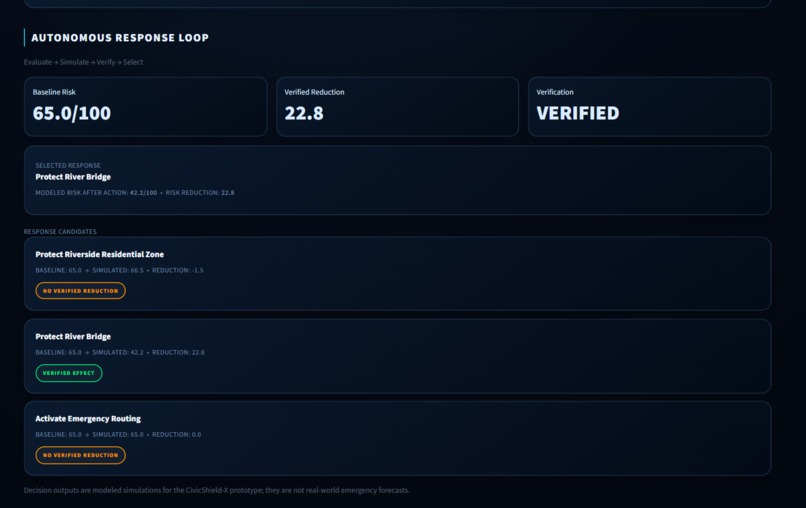
Atonomous Response and Verification
-
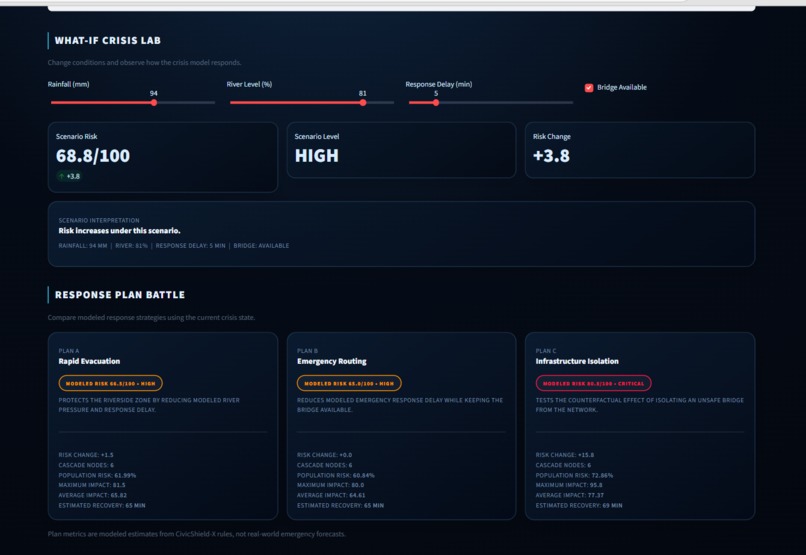
Crisis Time Machine and Experiment Lab
Inspiration
Cities are not collections of isolated systems. A disruption in one part of a city can propagate through connected infrastructure: rising water can affect bridges, bridge disruption can reduce road capacity, road disruption can delay emergency response, and growing emergency demand can put additional pressure on hospitals.
We wanted to explore a different question from a conventional monitoring dashboard:
What if a city could be represented as a living digital system where we can observe a crisis, model how it propagates, test interventions, and verify their modeled effects?
This led to CivicShield-X, an AI-driven Urban Crisis Digital Twin and Response Intelligence Platform.
Our goal was to build an interactive crisis experimentation environment rather than simply display a collection of risk metrics.
What it does
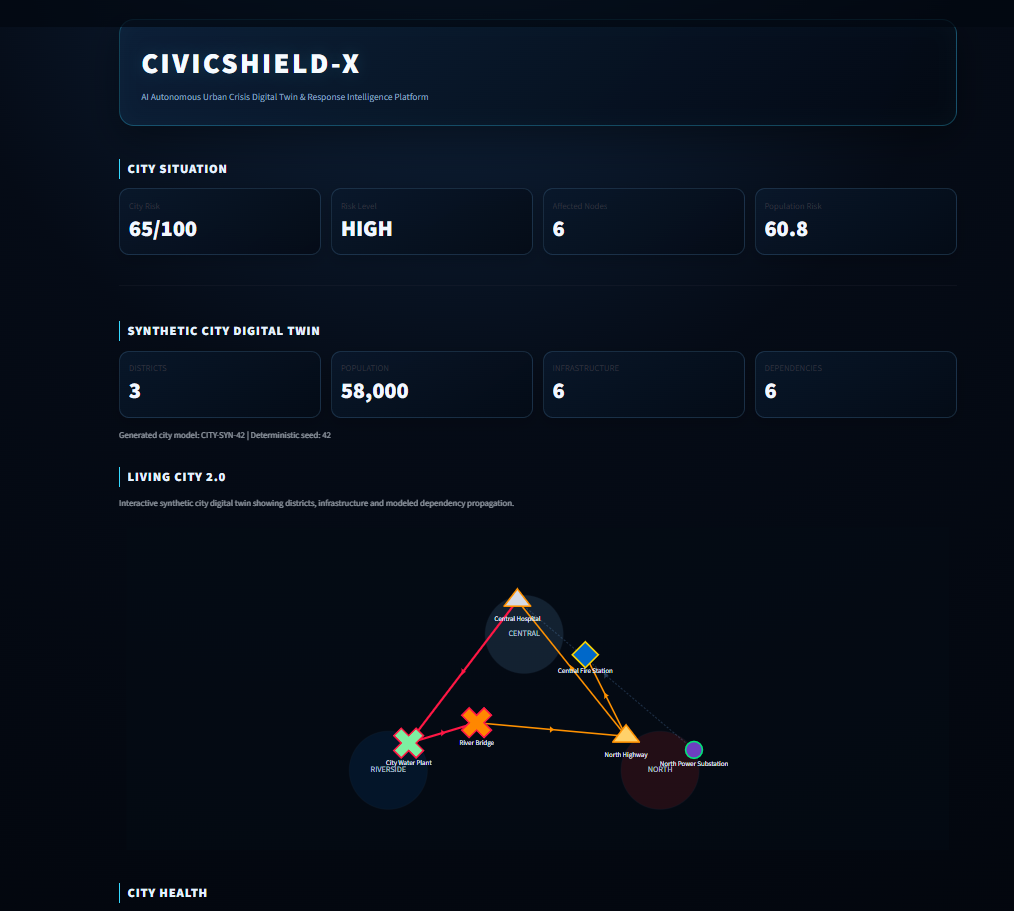
CivicShield-X models a synthetic city as an interconnected system of infrastructure, sensors, dependencies, risks, crises, and response scenarios.
Its workflow is:
Sense → Understand → Predict → Decide → Simulate → Act → Verify → Recover
The platform includes:
- 🏙️ Living City — visualizes infrastructure states across the simulated city.
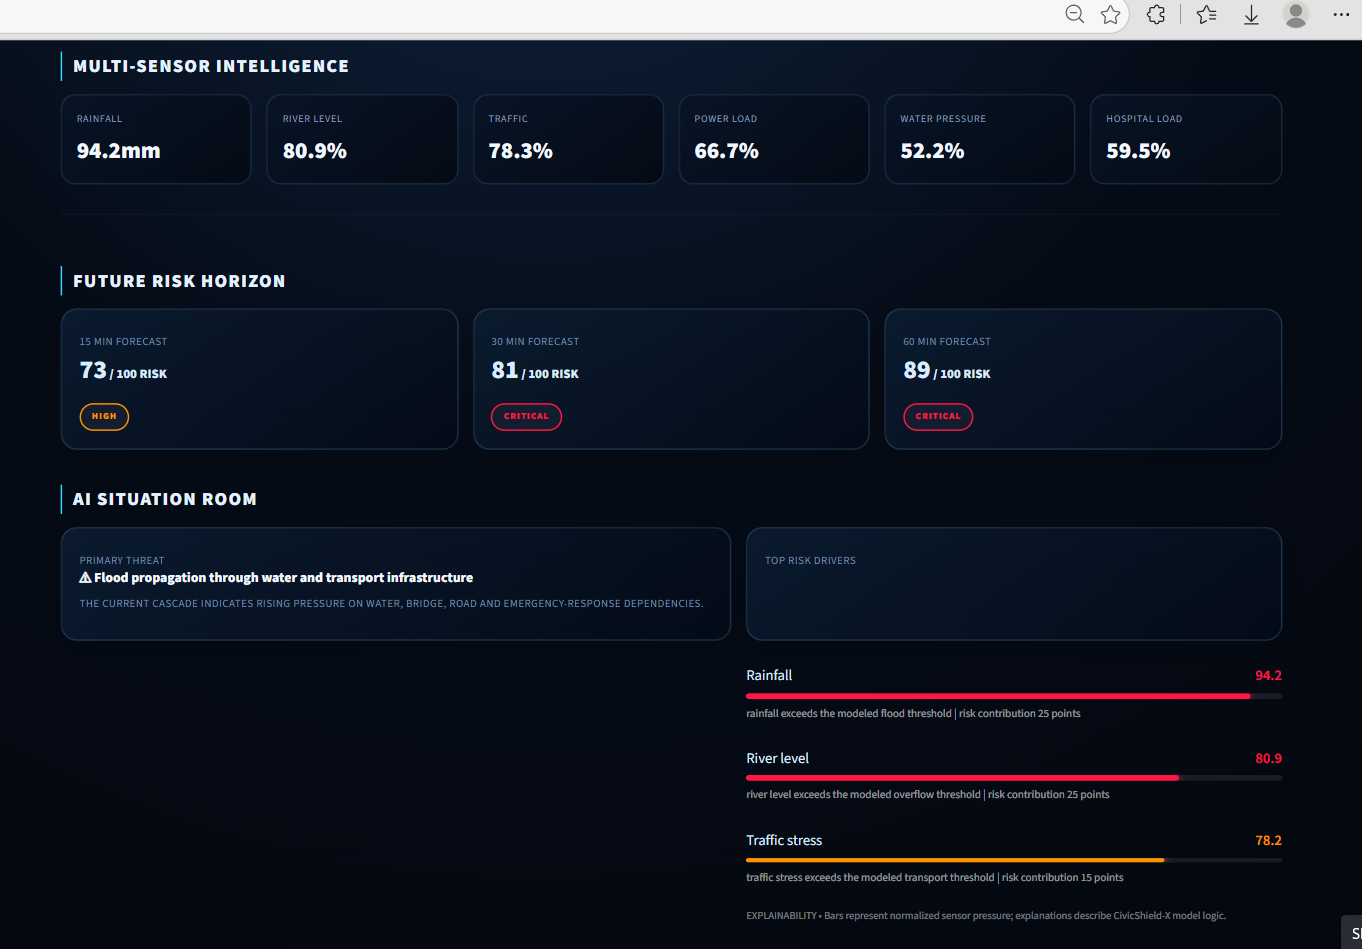
- 📡 Multi-source Sensor Simulation — rainfall, river level, traffic, power load, water pressure, and hospital load.
- ⚠️ Risk Engine — converts simulated sensor conditions into a modeled city risk state.
- 🔗 Infrastructure Dependency Graph — represents relationships between water, bridges, roads, emergency response, hospitals, power, and residential infrastructure.
- 🌊 Crisis Propagation Simulator — models how a crisis can move through connected infrastructure.
- 🔮 Future Risk Horizon — explores modeled risk at 15, 30, and 60 minutes.
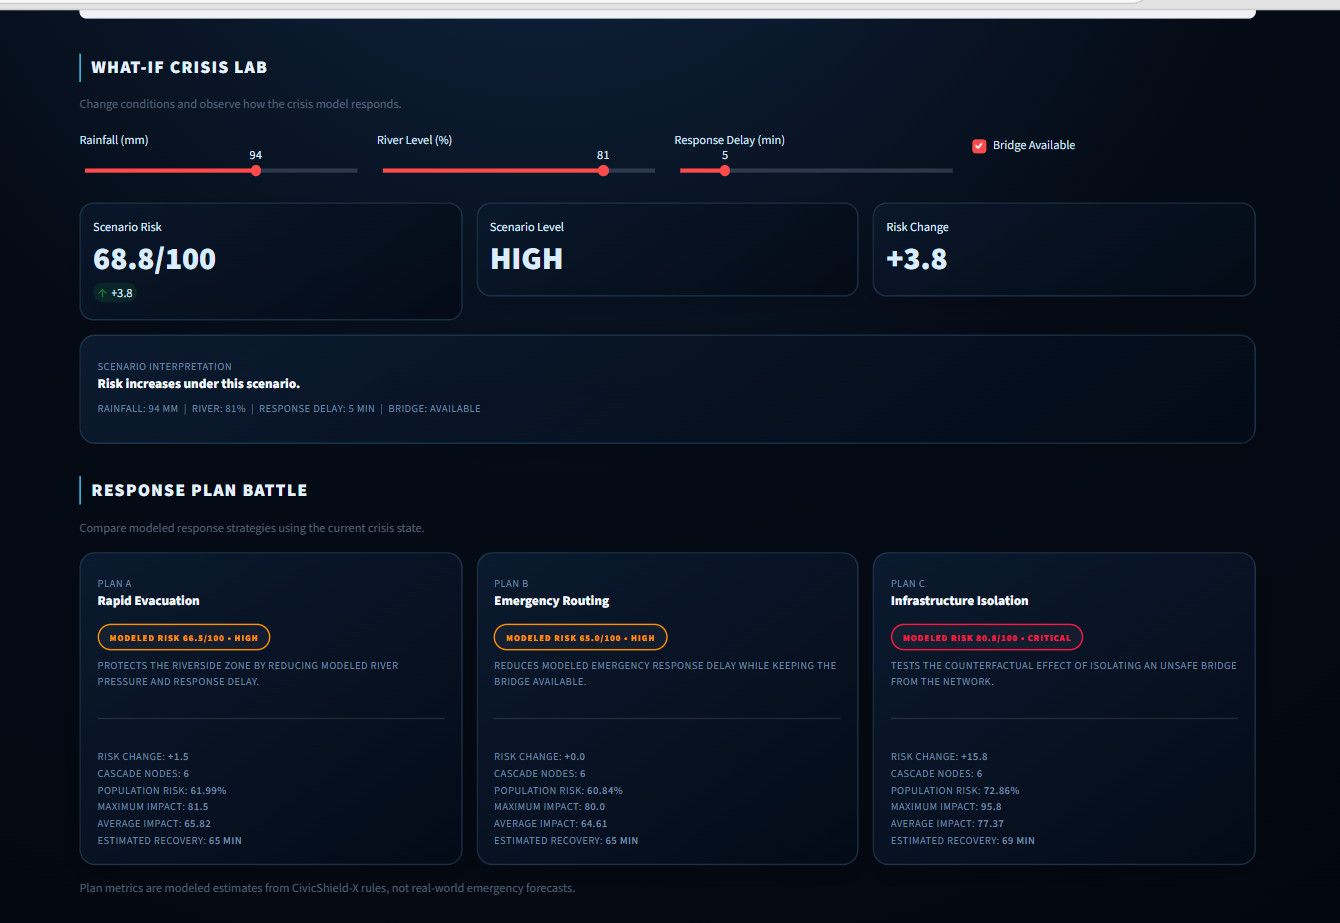
- 🧪 What-If Crisis Lab — changes rainfall, river level, response delay, and bridge availability and reruns the model.
- ⚡ Multi-Crisis Fusion — combines scenarios such as flood, power failure, and fire.
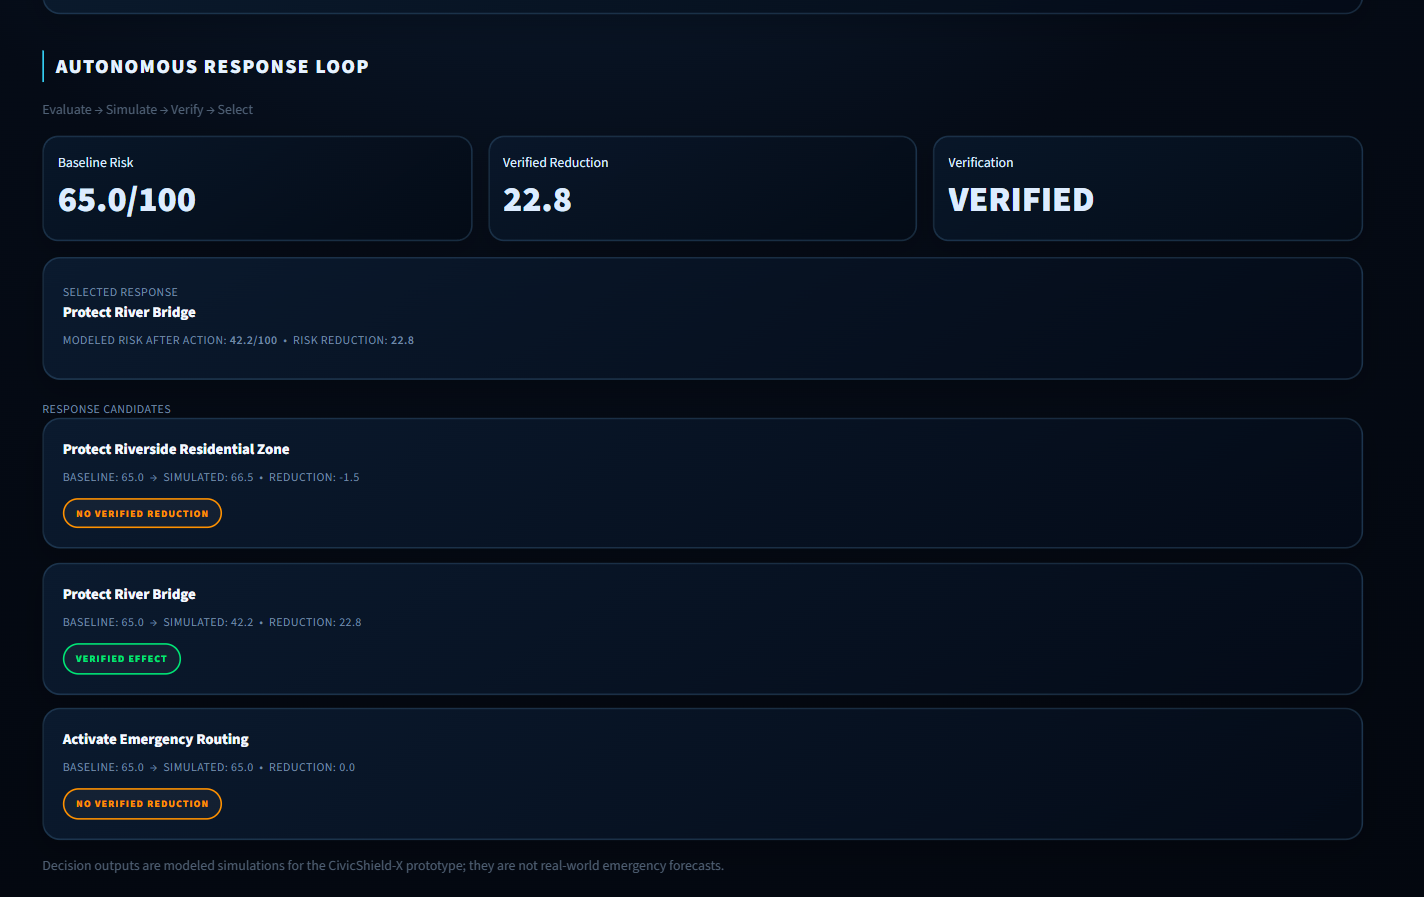
- 🤖 Autonomous Response Loop — evaluates candidate interventions through the simulation engine and verifies whether the modeled risk decreases.
- 🕐 Crisis Time Machine — compares modeled intervention timelines.
- 🔍 Infrastructure Dependency Explorer — lets users inspect individual infrastructure relationships.
- 🔁 Crisis Replay — reconstructs the modeled cascade chronologically.
- 🧠 City Memory / Experiment Lab — records modeled crisis and experiment results for comparison.
For example, an extreme-rainfall scenario can produce elevated rainfall and river levels. The system then models a possible cascade from water infrastructure to the bridge, road network, emergency response, hospital, and residential area.
The user can then change the scenario and test how the modeled outcome changes.
How we built it
CivicShield-X was built as a modular software-only prototype using Python and Streamlit.
The system is separated into simulation, cascade, scenario, memory, visualization, and interface components.
Simulation layer
The simulation engine generates a synthetic urban environment and simulated sensor conditions.
Sensor domains include:
- Rainfall
- River level
- Traffic
- Power load
- Water pressure
- Hospital load
These values feed the modeled risk engine.
Dependency and cascade layer
The city is represented as an infrastructure dependency network.
For example:
Water → Bridge → Road → Emergency Response → Hospital
The cascade engine propagates modeled impacts through these relationships and calculates affected infrastructure and population-risk indicators.
Scenario layer
The What-If engine allows the same underlying simulation to be rerun under changed conditions.
Instead of changing only a visual number, scenario controls feed back into the model.
The Autonomous Response Loop follows:
Evaluate → Simulate → Verify → Select
Candidate response actions are simulated and their modeled risk effects are compared before a response is selected.
Visualization layer
Plotly and Streamlit are used to turn the underlying system state into an interactive command-center experience containing:
- Living City infrastructure states
- Crisis propagation network
- Risk indicators
- Future-risk views
- Scenario controls
- Response analysis
- Replay timelines
- Dependency exploration
The architecture was designed so the simulation logic remains separate from the UI, allowing the core components to be tested independently.
Challenges we ran into
The biggest challenge was avoiding the common hackathon pattern of building a visually impressive dashboard where the underlying numbers are disconnected from one another.
We wanted interactions to actually affect the system.
For example, changing rainfall or bridge availability in the What-If Lab needs to flow through the scenario model and produce a new modeled risk state.
Another challenge was representing cascading infrastructure failures in a way that users could understand immediately. A simple table does not communicate system relationships well, so we introduced the dependency graph, propagation network, Living City, and crisis replay.
We also had to be careful about how we describe the intelligence of the system. Because this is a prototype using synthetic and modeled scenarios, we do not present its outputs as real-world emergency predictions. The system explicitly treats its results as simulations for experimentation and decision support.
Accomplishments that we're proud of
We are proud that CivicShield-X evolved from a basic city-risk simulation into an interconnected crisis experimentation platform.
Some of the key accomplishments are:
- Built a functional synthetic urban environment.
- Connected multiple simulated sensor domains to a risk engine.
- Implemented an infrastructure dependency network.
- Implemented tested crisis cascade propagation.
- Built an interactive Living City representation.
- Built a functional What-If scenario engine.
- Implemented Multi-Crisis Fusion for combined crisis scenarios.
- Built an Autonomous Response Loop that evaluates, simulates, and verifies candidate actions.
- Added Crisis Replay to reconstruct the modeled cascade.
- Added Infrastructure Dependency Explorer.
- Added City Memory and experiment storage.
- Built the system as modular Python components rather than one monolithic interface.
- Added tests for core simulation and cascade behavior.
Most importantly, the project connects these components into an end-to-end experimental workflow instead of presenting them as unrelated features.
What we learned
We learned that building an intelligent system is not only about adding an AI model.
The difficult part is connecting observation, reasoning, simulation, verification, and human interaction into one coherent system.
We also learned the importance of:
- Modular architecture
- Reproducible simulations
- Explainability
- Dependency modeling
- Scenario testing
- Clear visualization
- Honest communication of model limitations
- Human supervision for high-impact decisions
The project changed our perspective from thinking about a crisis as a single prediction problem to thinking about it as a dynamic systems problem.
What's next for CivicShield-X
The current prototype establishes the foundation for a much deeper urban crisis digital twin.
Future development could include:
- More advanced learned anomaly-detection models
- Probabilistic risk propagation
- Larger and more realistic synthetic cities
- More detailed infrastructure dependencies
- Advanced alternate-timeline simulation
- Richer crisis recovery modeling
- Historical scenario comparison
- More sophisticated explainable AI
- External real-time data adapters
- Multi-city digital twins
- Human-in-the-loop emergency planning workflows
- More advanced natural-language interaction with the simulation engine
The long-term vision is for CivicShield-X to become an interactive urban crisis laboratory where researchers, planners, and engineers can explore complex cascading scenarios safely before applying insights to real-world planning.
CivicShield-X is intentionally positioned as a simulation and decision-support prototype—not an autonomous authority for real-world emergency decisions.


Log in or sign up for Devpost to join the conversation.