-
-

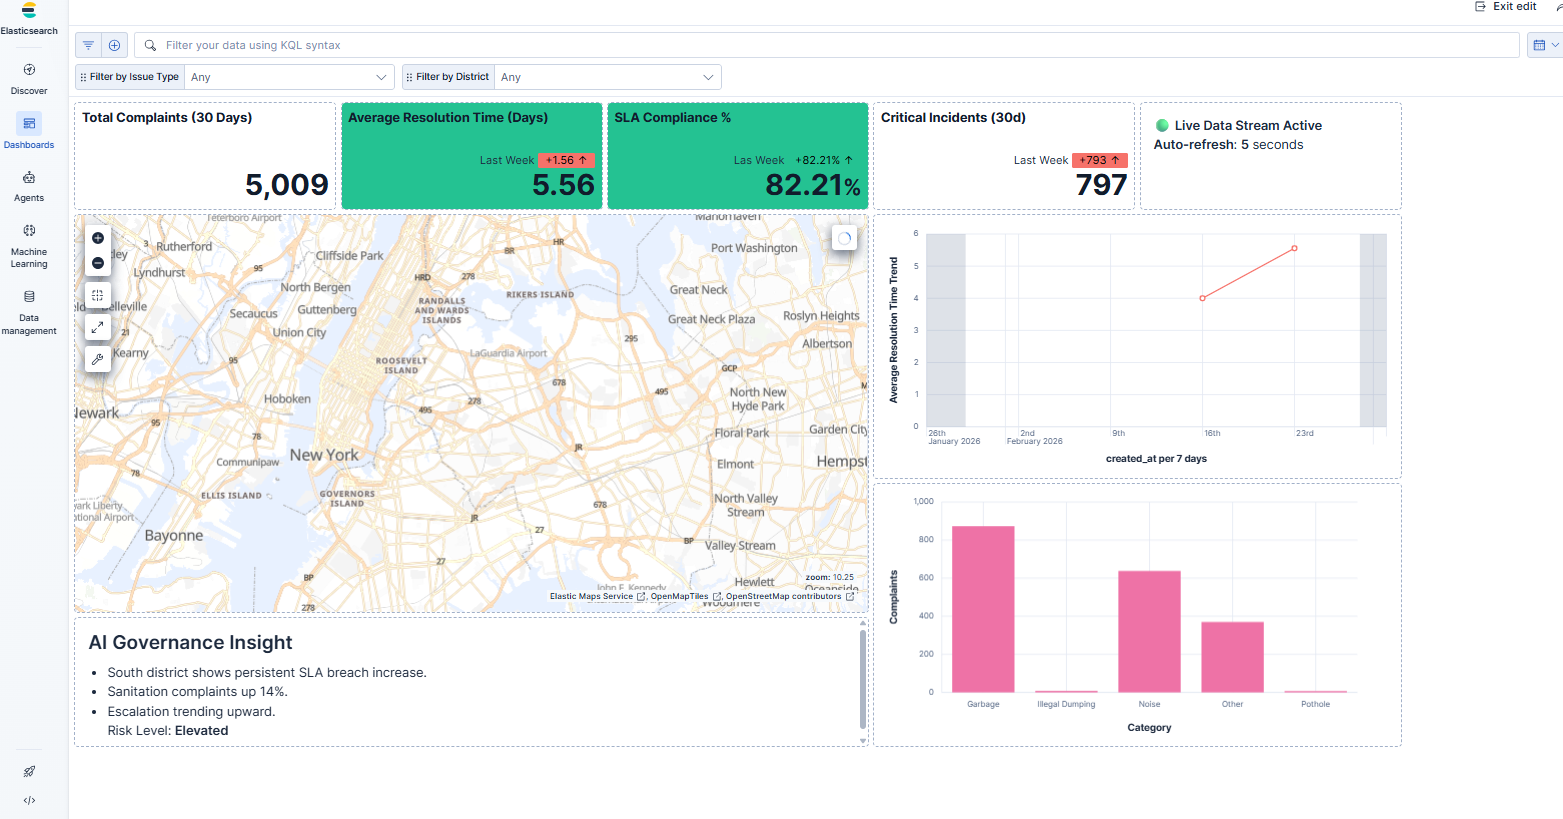
Citizen Dashbaord
-

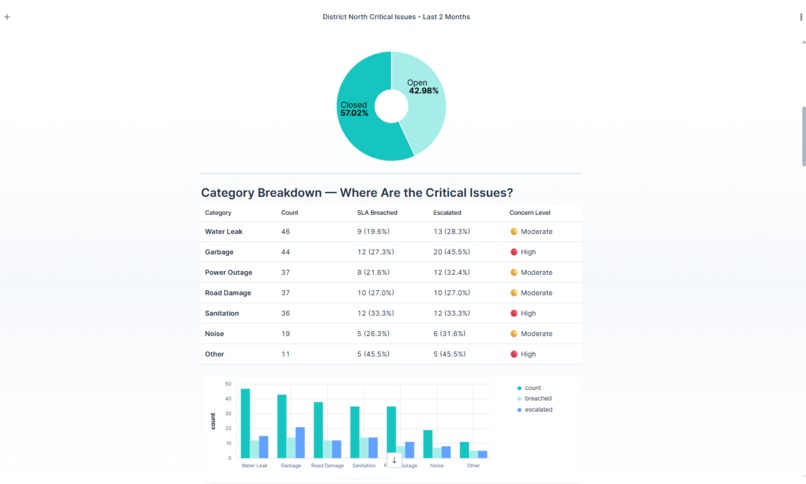
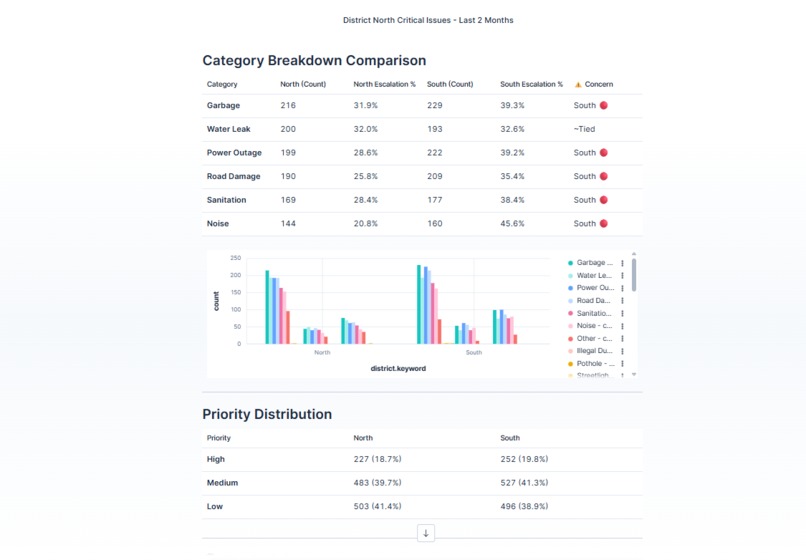
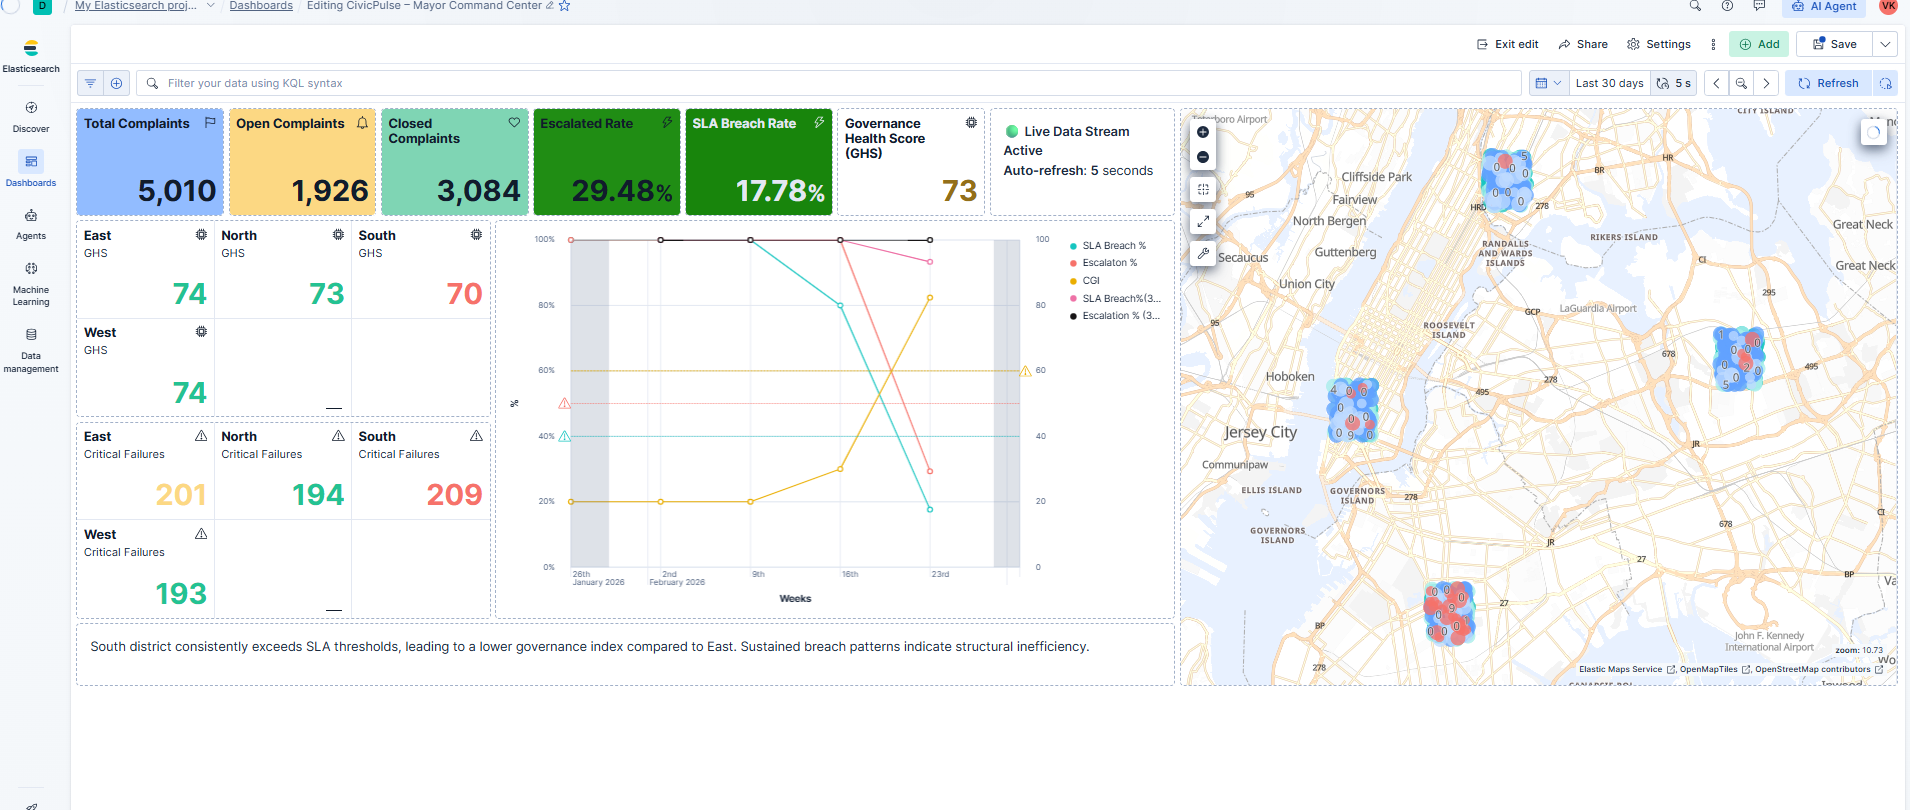
Mayor Command Center
-
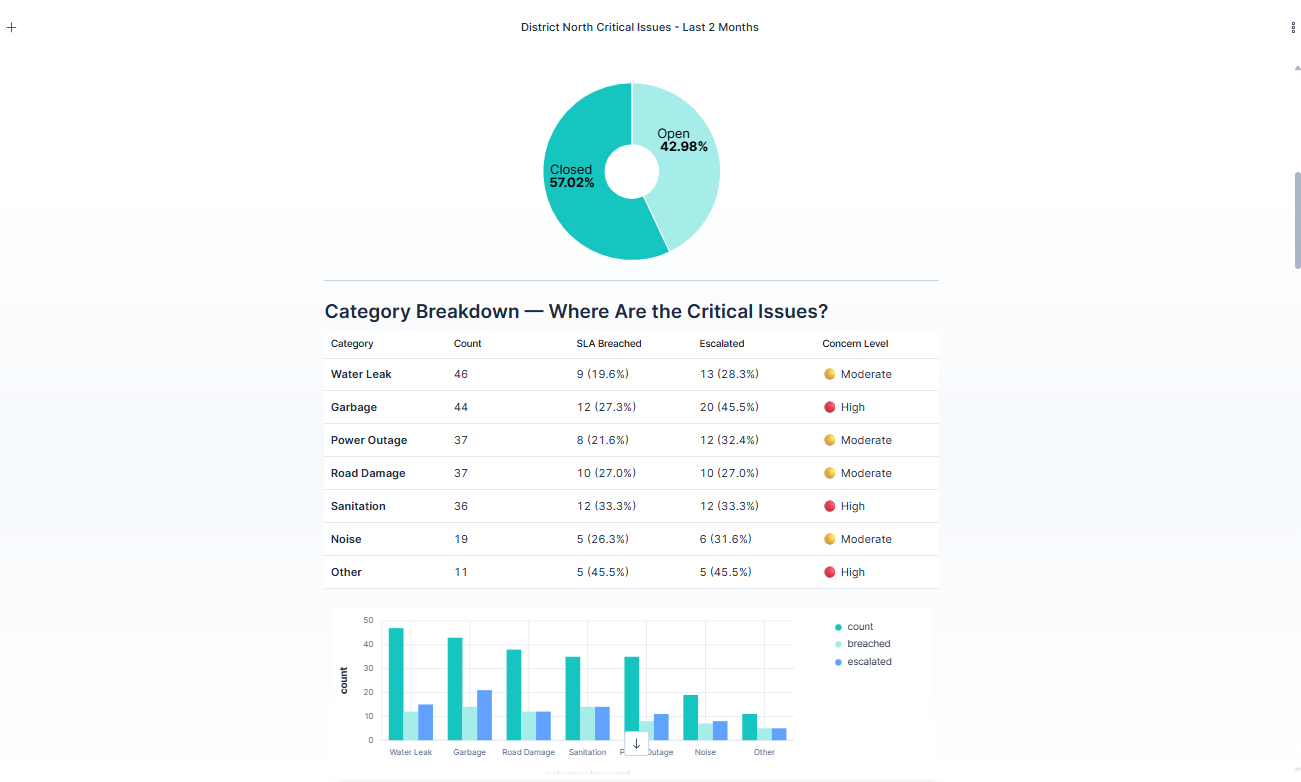
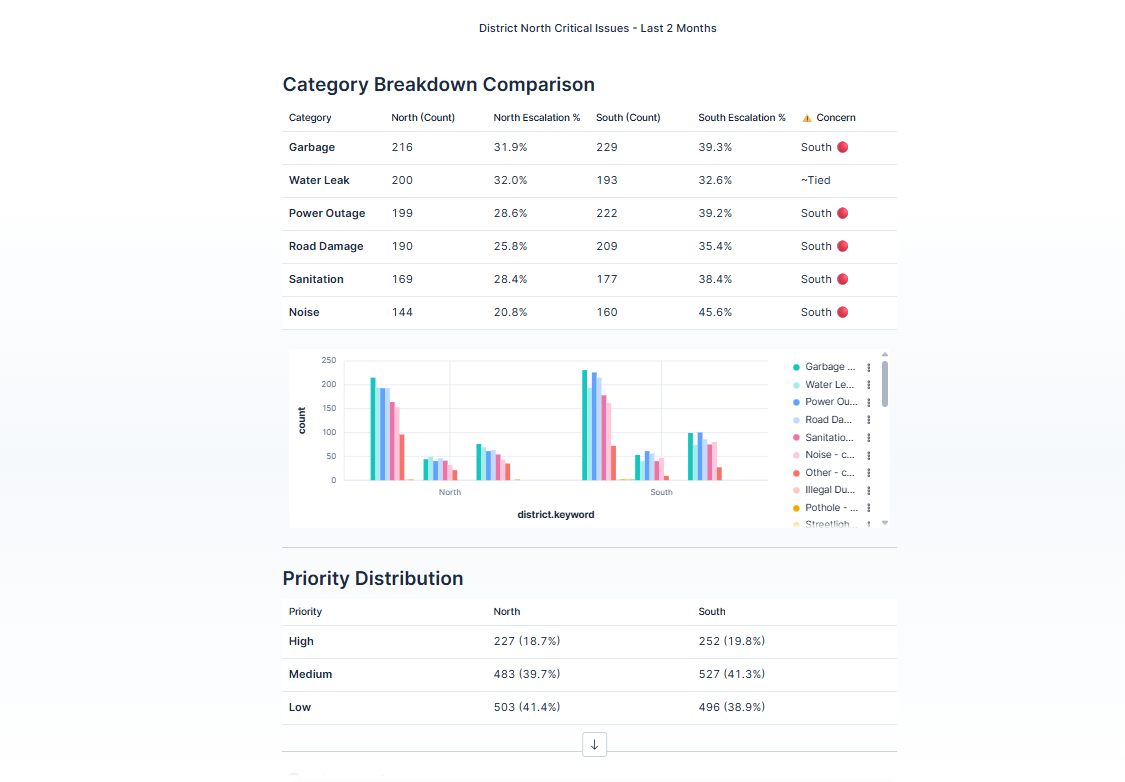
Agent response - civicpulse intelligence agent - mayor prompt
-
-
-

Inspiration
In India and across urban municipalities worldwide, civic complaint systems generate massive volumes of data — but the real challenge isn't collection, it's making sense of it at scale. Complaints pile up across districts, categories, and priority levels, leaving governance teams to rely on manual triage, static dashboards, and reactive decision-making.
Mayors lack real-time visibility into which districts are under stress, which complaint categories are driving SLA breaches, and what interventions would actually move the needle. Having seen how this leads to missed escalations, delayed responses, and resource misallocation, I wanted to explore whether an AI agent could act as a governance intelligence layer — one that reasons transparently, computes stress in real-time, and simulates the impact of resource decisions before they're made.
What it does
CivicPulse is a unified AI agent that transforms raw civic complaint data into actionable governance intelligence through natural language conversation.
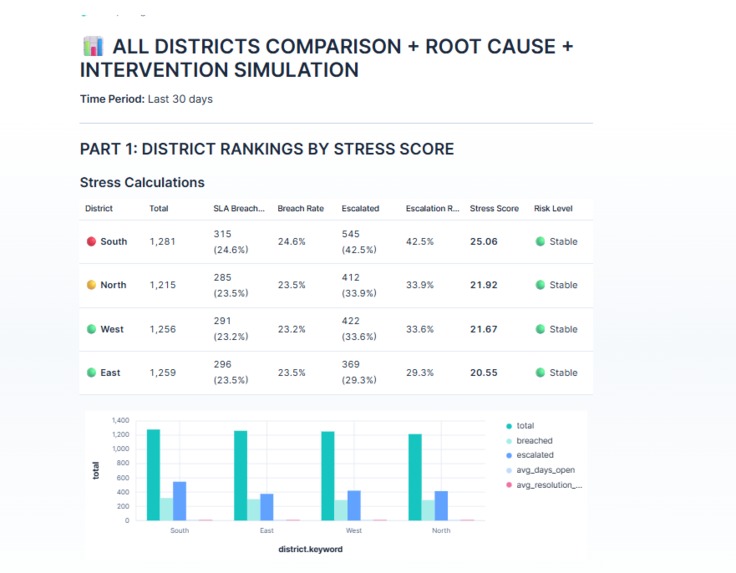
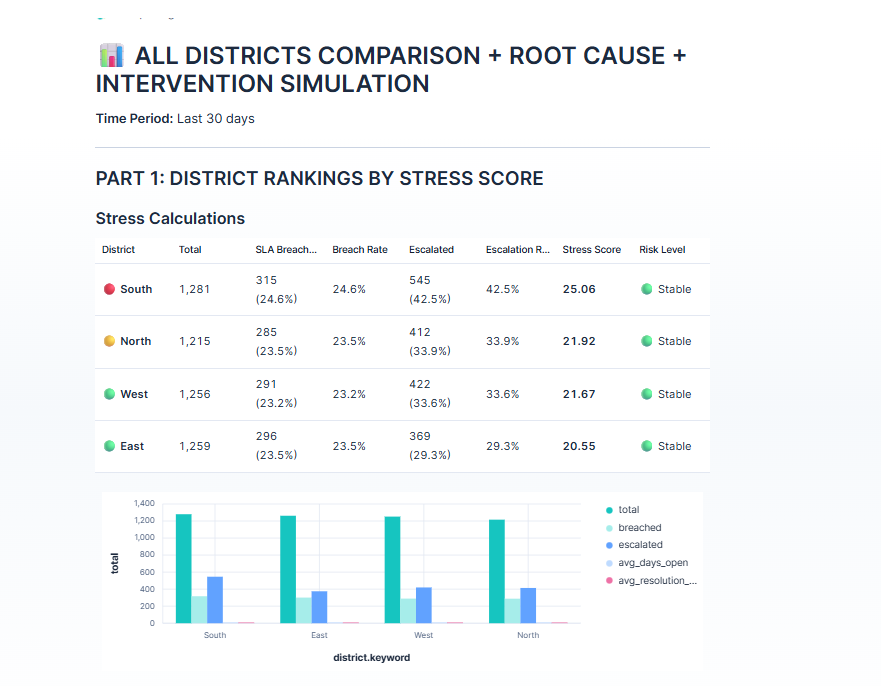
Given 5,000+ geo-tagged complaints across four districts, the agent computes a custom Stress Model:
$$\text{Stress} = (\text{SLA_breach_rate} \times 50) + (\text{Escalation_rate} \times 30)$$
Where:
$$\text{SLA_breach_rate} = \frac{\text{breached_complaints}}{\text{total_complaints}}$$
$$\text{Escalation_rate} = \frac{\text{escalated_complaints}}{\text{total_complaints}}$$
The agent classifies districts into risk bands:
| Stress Score | Classification |
|---|---|
| \( < 35 \) | ✅ Stable |
| \( 35 - 50 \) | ⚠️ Warning |
| \( \geq 50 \) | 🔴 High Risk |
It also projects 7-day trends using velocity analysis:
$$\text{Velocity} = \frac{\text{recent_7d} - \text{previous_7d}}{\text{previous_7d}}$$
$$\text{Projected_Stress} = \text{Current_Stress} + (\text{Velocity} \times 0.5)$$
Key capabilities:
- District Comparison — Ranked stress analysis across all districts
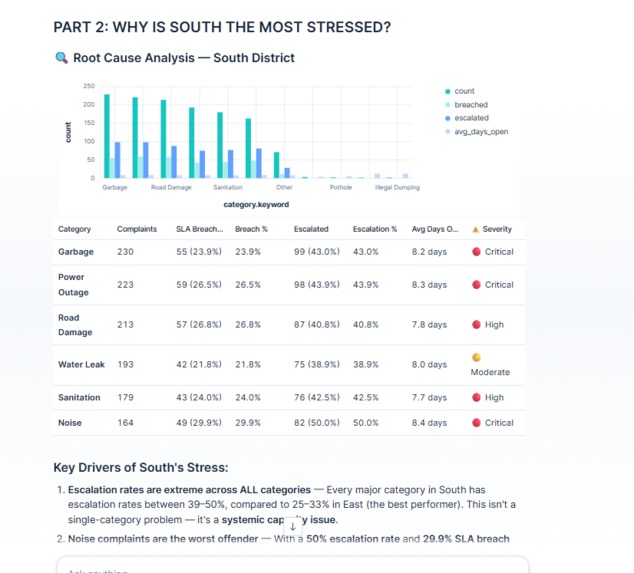
- Root Cause Analysis — Category-level SLA breach breakdown
- Intervention Simulation — What-if scenarios with before/after recalculation
- Complaint Lookup — Individual complaint retrieval by ID
- Geo Search — Find nearby complaints by coordinates
Every calculation is shown step-by-step, making the output explainable and trustworthy for non-technical decision-makers.
How I built it
Architecture
        USER (Citizen / Mayor)
                 │
                 ▼
   ┌──────────────────────────┐
   │  CivicPulse Super Agent  │
   │  - Stress Computation    │
   │  - ES|QL Execution       │
   │  - Risk Classification   │
   │  - Intervention Sim      │
   │  - 7-Day Projection      │
   └────────────┬─────────────┘
                │
    ┌───────────┴───────────┐
    ▼                       ▼
┌──────────────┐   ┌─────────────────┐
│ Citizen      │   │ Mayor Command   │
│ Dashboard    │   │ Center          │
└──────┬───────┘   └────────┬────────┘
       └────────┬───────────┘
                ▼
  ┌────────────────────────┐
  │    Elasticsearch       │
  │ civicpulse_complaints  │
  └────────────────────────┘
Core Stack
| Component | Purpose |
|---|---|
| Elastic Agent Builder | AI reasoning engine with system instructions |
| **ES\ | QL** |
| Elasticsearch | Data storage, aggregations, geo-search |
| Kibana Dashboards | Mayor Command Center + Citizen Dashboard |
| Python | Data ingestion + live streaming pipeline |
Agent Design
The agent uses strict ES|QL safety guardrails:
- Mandatory time filters:
WHERE created_at >= NOW() - 30 days .keywordsuffix enforcement for text field aggregationsCASE()wrapping for boolean-to-numeric conversions:
STATS
  total = COUNT(*),
  breached = SUM(CASE(sla_breached == true, 1, 0)),
  escalated = SUM(CASE(escalated == true, 1, 0))
Data Pipeline
I designed a Python pipeline with two modes:
- Bulk Ingestion — 5,000 records with controlled Governance Health Composite (GHC) targeting \( 65-70 \)
- Live Streaming — Real-time data with crisis mode simulation that drops GHC to \( 40-50 \)
The GHC formula used in the data pipeline:
$$\text{GHC} = (100 - \text{SLA_breach\%}) \times 0.4 + (100 - \text{Escalation\%}) \times 0.3 + \text{Closure\%} \times 0.3$$
Category distribution is controlled to keep the "Other" category at \( \approx 8\% \), ensuring realistic data representation.
Dashboard Integration
Two Kibana dashboards serve as visual layers:
- Mayor Command Center — Strategic stress metrics, trends, category breakdowns
- Citizen Dashboard — Operational map view with complaint locations and filters
The agent generates filtered dashboard URLs dynamically based on conversation context, linking users directly to relevant visualizations.
Challenges I ran into
1. Dashboard-Agent Integration
The biggest challenge was bridging the gap between conversational AI and visual analytics. Elastic Agent Builder's chat interface supports text and markdown only — it cannot render interactive charts or embed dashboard panels. This required creative workarounds: the agent generates pre-filtered dashboard URLs that open Kibana views filtered to the exact district, category, or status being discussed.
2. ES|QL Syntax Nuances
Discovering that boolean fields require CASE() wrapping for SUM() aggregations took significant debugging:
-- ❌ WRONG: SUM(sla_breached == true)
-- ✅ CORRECT: SUM(CASE(sla_breached == true, 1, 0))
Similarly, text fields need .keyword suffixes for filtering and grouping — using district instead of district.keyword in aggregations causes silent failures.
3. Geo-Point Mapping
Getting the geo_location field to work correctly with Kibana Maps required ensuring the index mapping used geo_point type rather than a nested object with separate lat/lon float fields. This required reindexing the entire dataset.
4. Controlled Data Distribution
Maintaining a realistic GHC score of \( 65-70 \) during normal operations while allowing crisis simulation to drop it to \( 40-50 \) required careful tuning of SLA breach rates, escalation probabilities, and closure rates in the data generator.
Accomplishments that I'm proud of
I'm proud of building a system where the AI agent doesn't just report numbers — it reasons through them transparently. Every stress calculation shows:
- The raw data retrieved via ES|QL
- The rate calculations: \( \text{breach_rate} = \frac{breached}{total} \)
- The formula application: \( \text{Stress} = (rate_1 \times 50) + (rate_2 \times 30) \)
- The risk classification with clear thresholds
The intervention simulator doesn't guess — it recalculates stress with adjusted rates and presents a clear before/after comparison:
$$\text{New_Stress} = (\text{breach_rate} - \Delta_{breach}) \times 50 + (\text{escalation_rate} - \Delta_{escalation}) \times 30$$
I'm also proud of the streaming engine with crisis mode — pressing c triggers a realistic governance crisis that the agent can detect and analyze in real-time.
What I learned
Building CivicPulse reinforced that the most powerful AI agents aren't the ones that make autonomous decisions — they're the ones that help humans reason better.
Key takeaways:
Explainability is the core feature, not an add-on. Transparent step-by-step calculations build trust far more effectively than black-box predictions.
ES|QL is remarkably powerful for real-time governance analytics when combined with proper safety guardrails. The ability to compute aggregations, velocity calculations, and multi-district comparisons through natural language felt like a breakthrough.
System instructions are the secret weapon. Elastic Agent Builder's approach of encoding complex domain logic — stress formulas, risk bands, intervention models — directly into the agent's reasoning makes it truly domain-aware without custom code.
Data quality drives agent quality. The controlled data pipeline with realistic distributions was essential for meaningful agent responses.
What's next for CivicPulse
Future versions could:
- Connect to live municipal complaint portals for real-time governance monitoring
- Support configurable stress formulas per city or department
- Integrate proactive alert systems that notify administrators when districts cross risk thresholds
- Add multi-language support for accessibility across India's diverse linguistic landscape
- Extend to other domains — healthcare queue management, infrastructure maintenance, or education resource allocation
The guiding principle remains: building AI agents that are transparent, explainable, and designed to support real-world decision-making — not replace it.
Built With
- elasticagentbuilder
- elasticcloud(gcp)
- elasticsearch
- es|ql
- github
- kibana
- kibanadashbaords
- python

Log in or sign up for Devpost to join the conversation.