Inspiration
Have you ever walked past a damaged sidewalk, a pothole, or a pest infestation in Boston and wondered why it still hasn't been fixed? Boston's 311 service allows residents to report these issues, but submitting a complaint doesn't necessarily tell you how long it will take to resolve. Even when a request has a target completion date, residents may not know whether that timeline reflects how similar complaints have actually been handled. We wanted to answer a simple question: "If I report an issue today, how long should I realistically expect to wait?" and that's how Civic Pulse started. As students living in Boston, we wanted to use publicly available data to make local government services more transparent and understandable. Rather than replacing Boston 311, we envisioned an independent tool that could help residents understand historical service timelines and identify differences across neighborhoods. Our goal was to turn years of public records into information that residents could actually use.
What it does
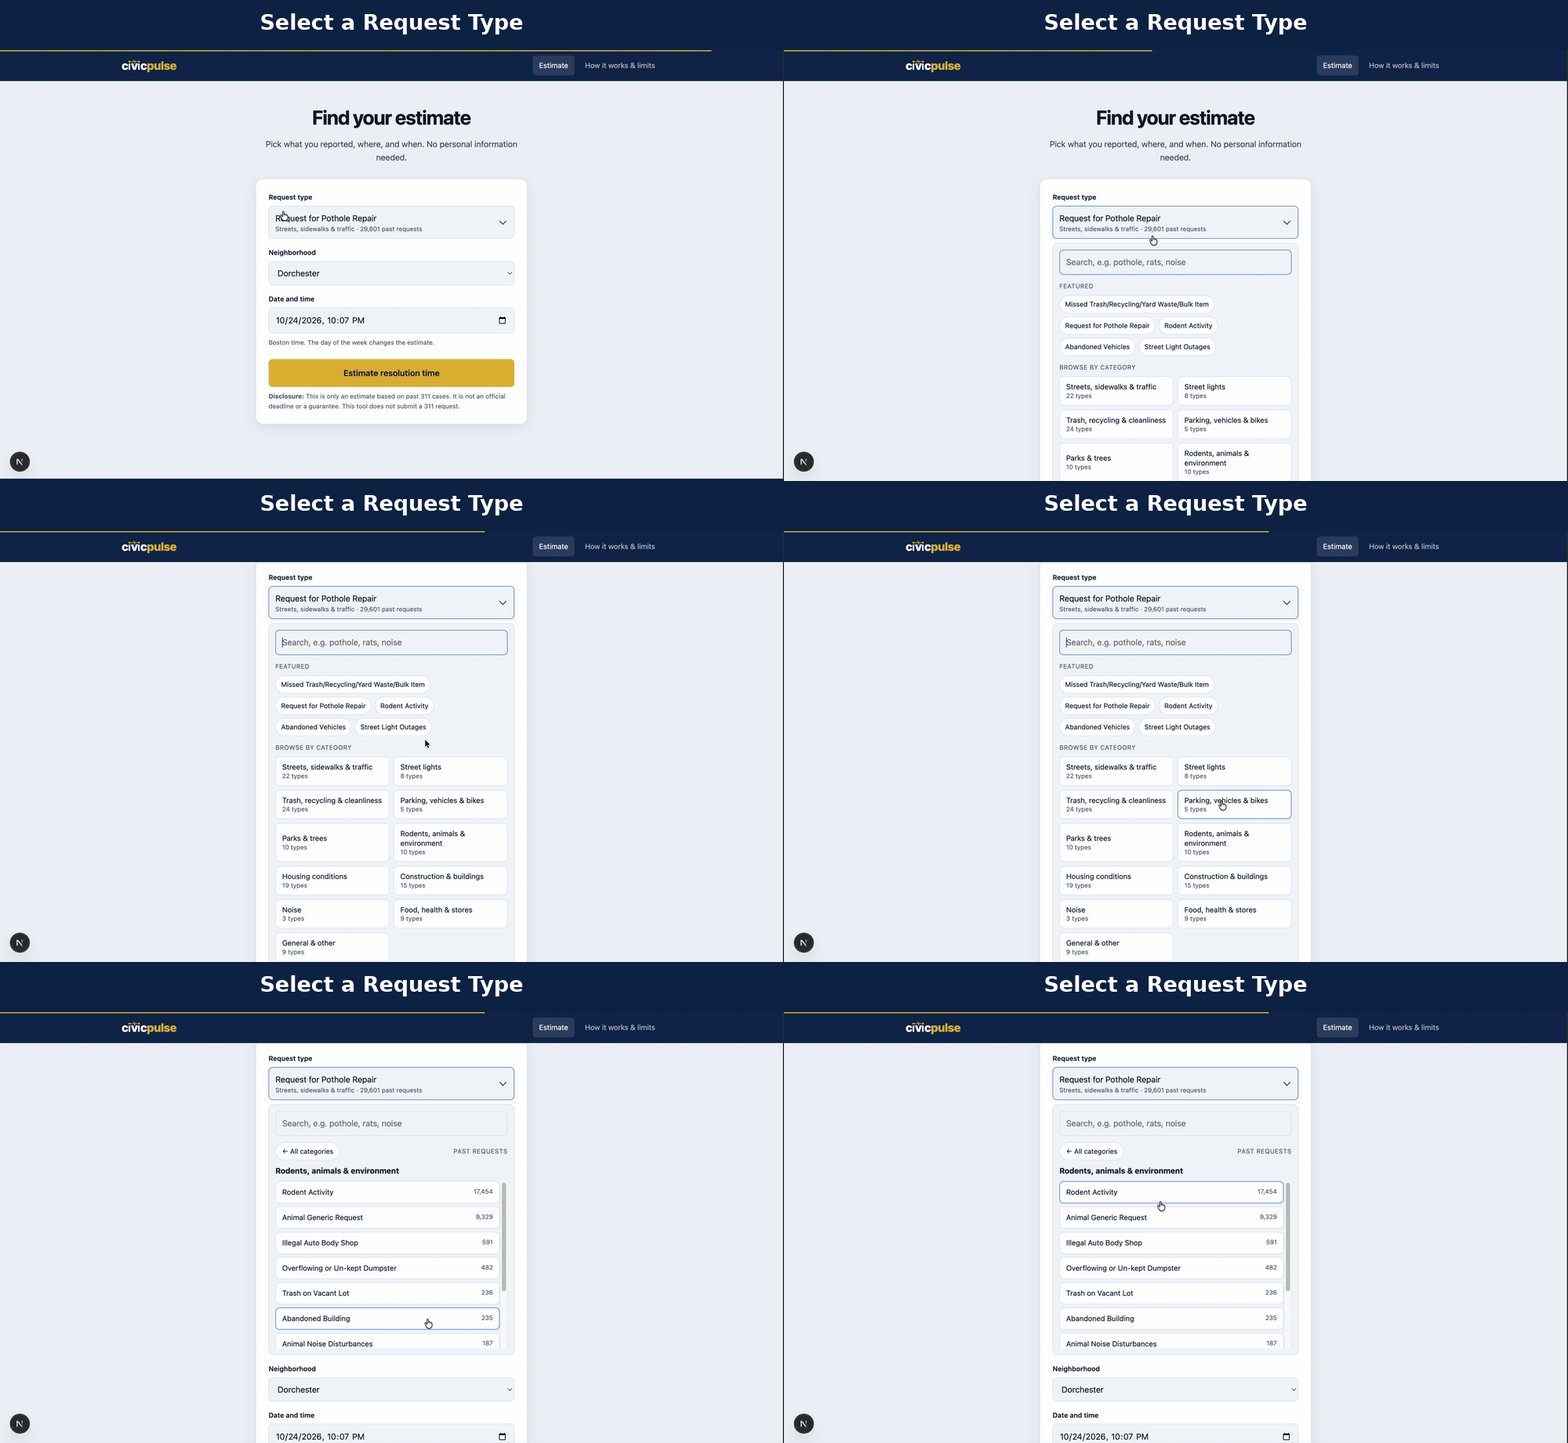
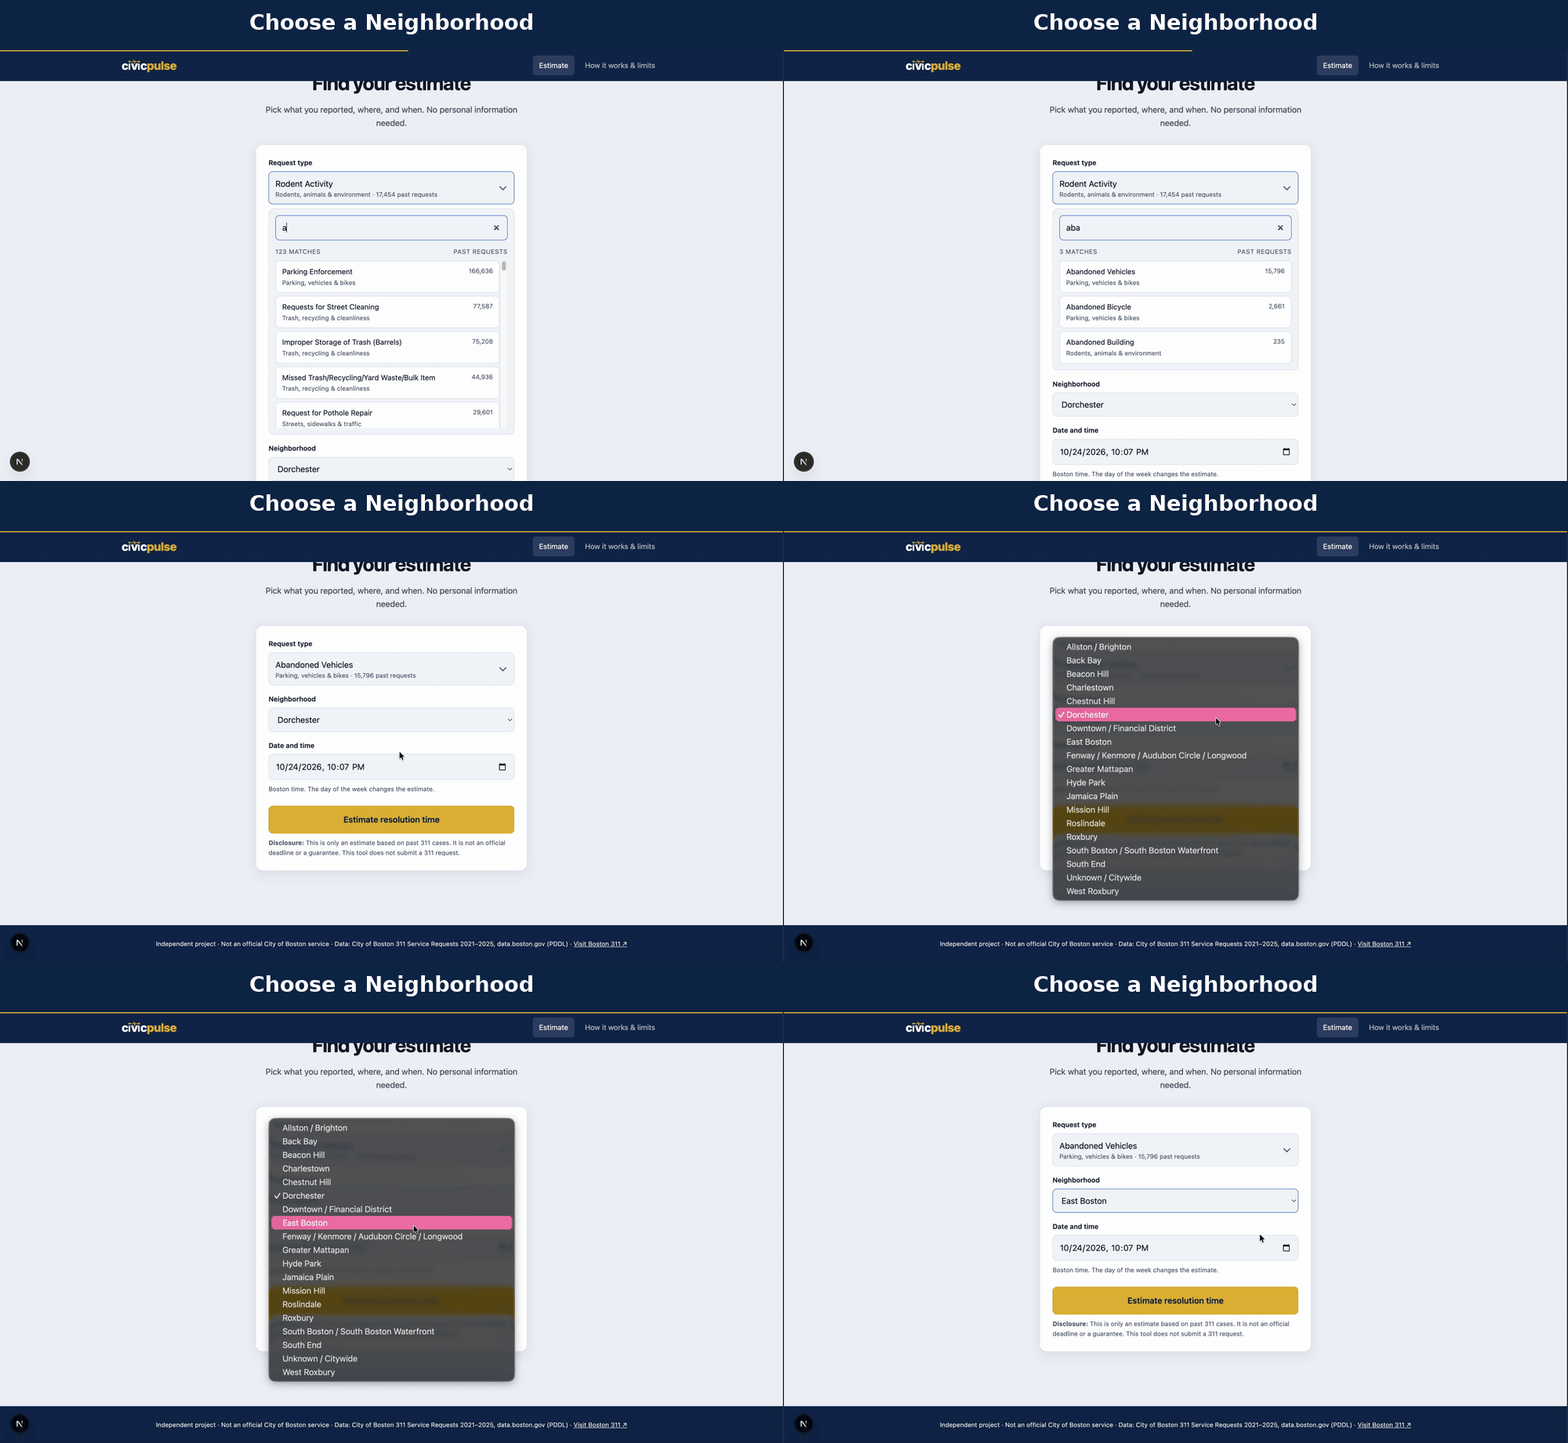
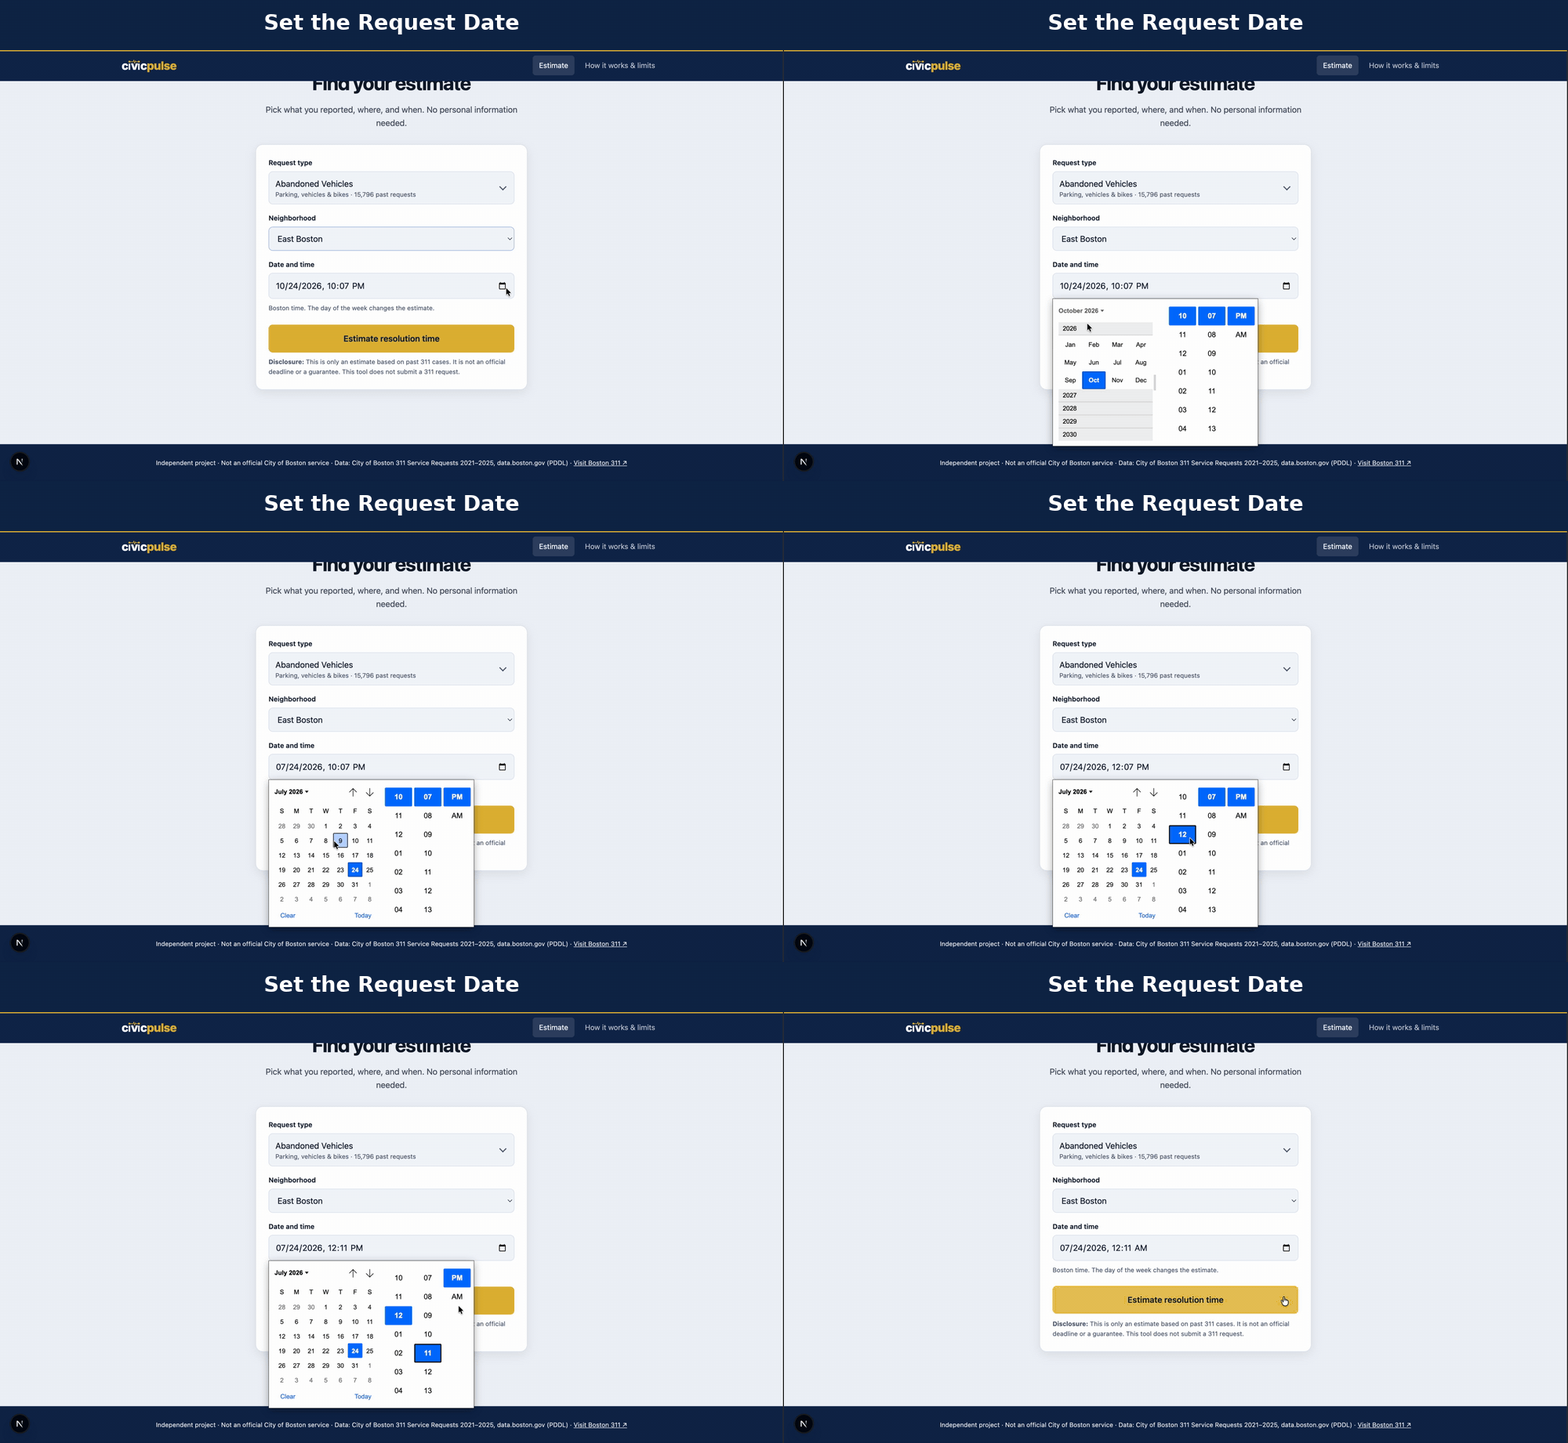
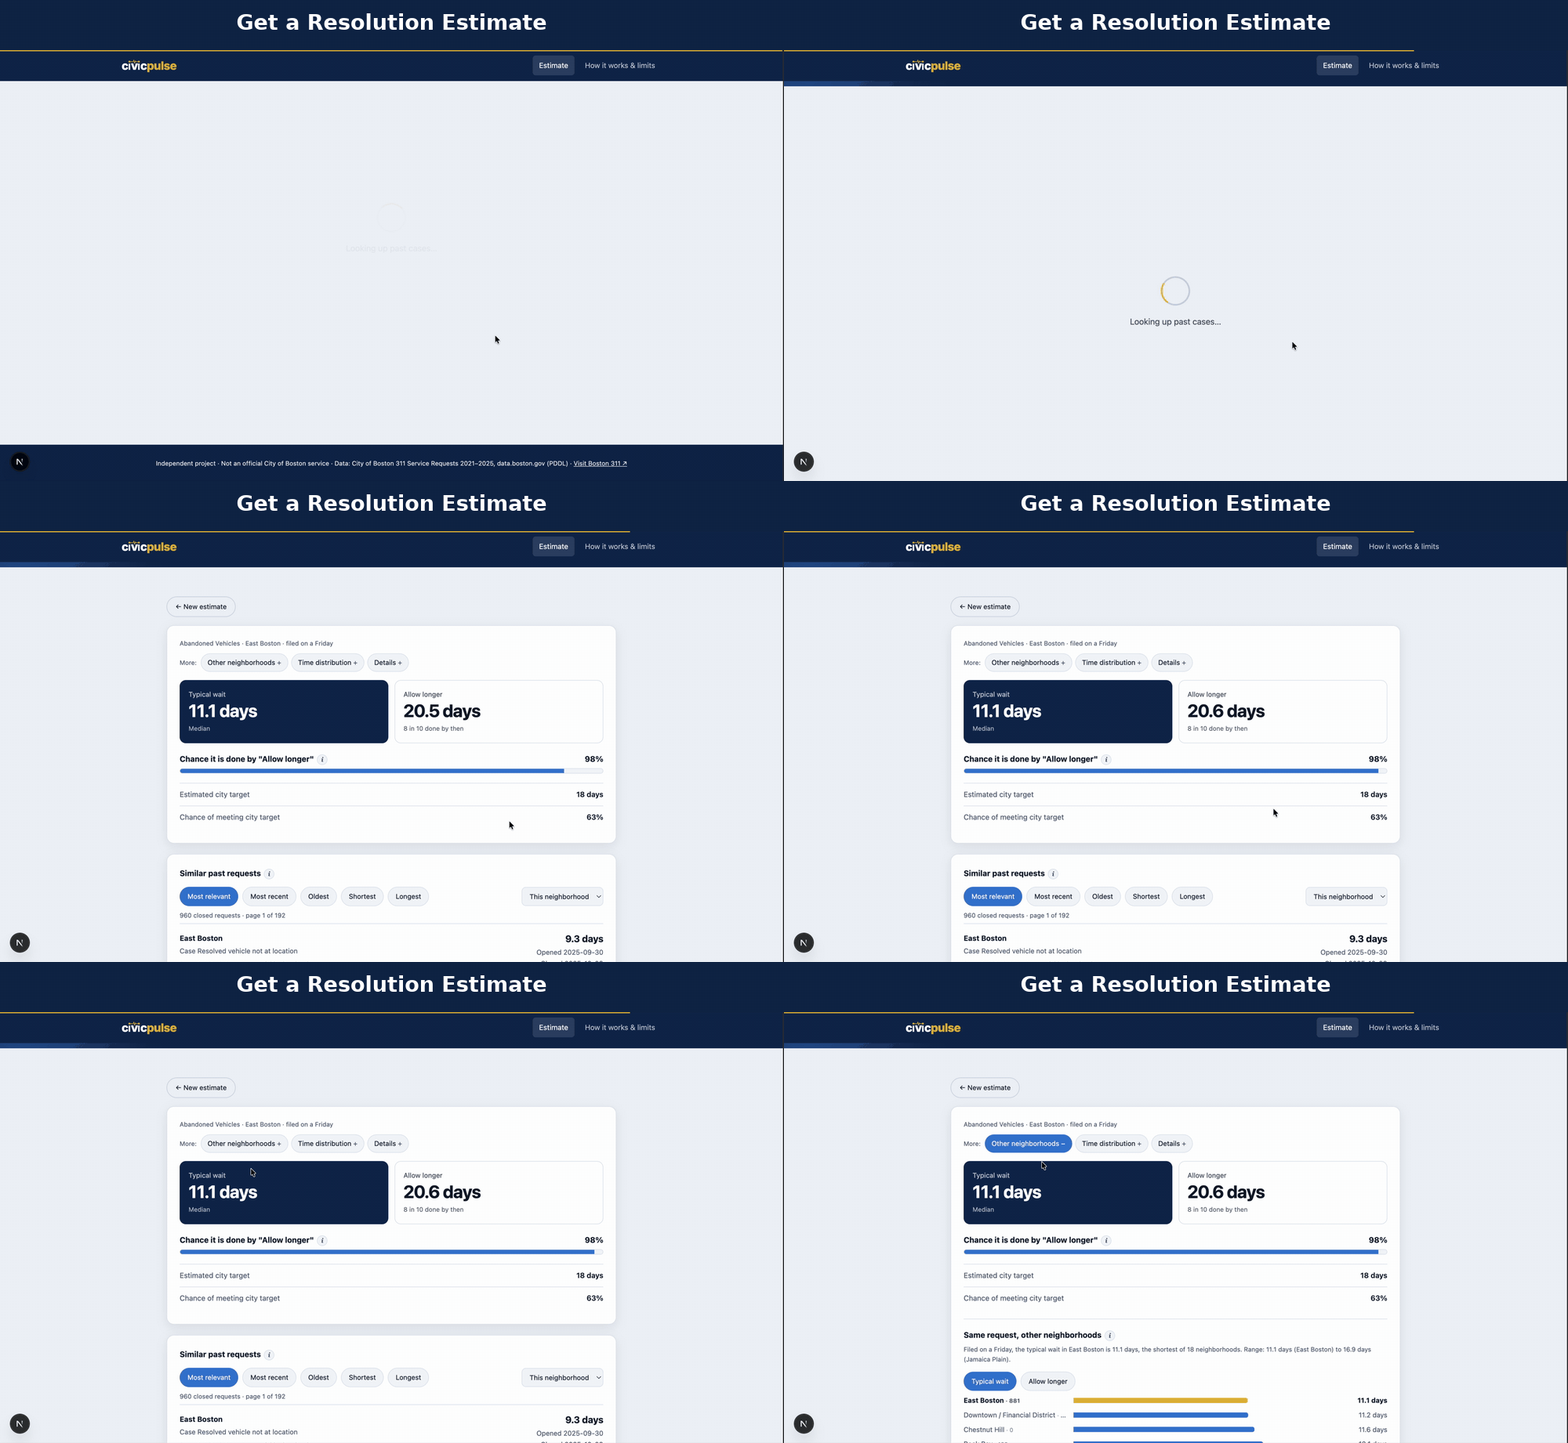
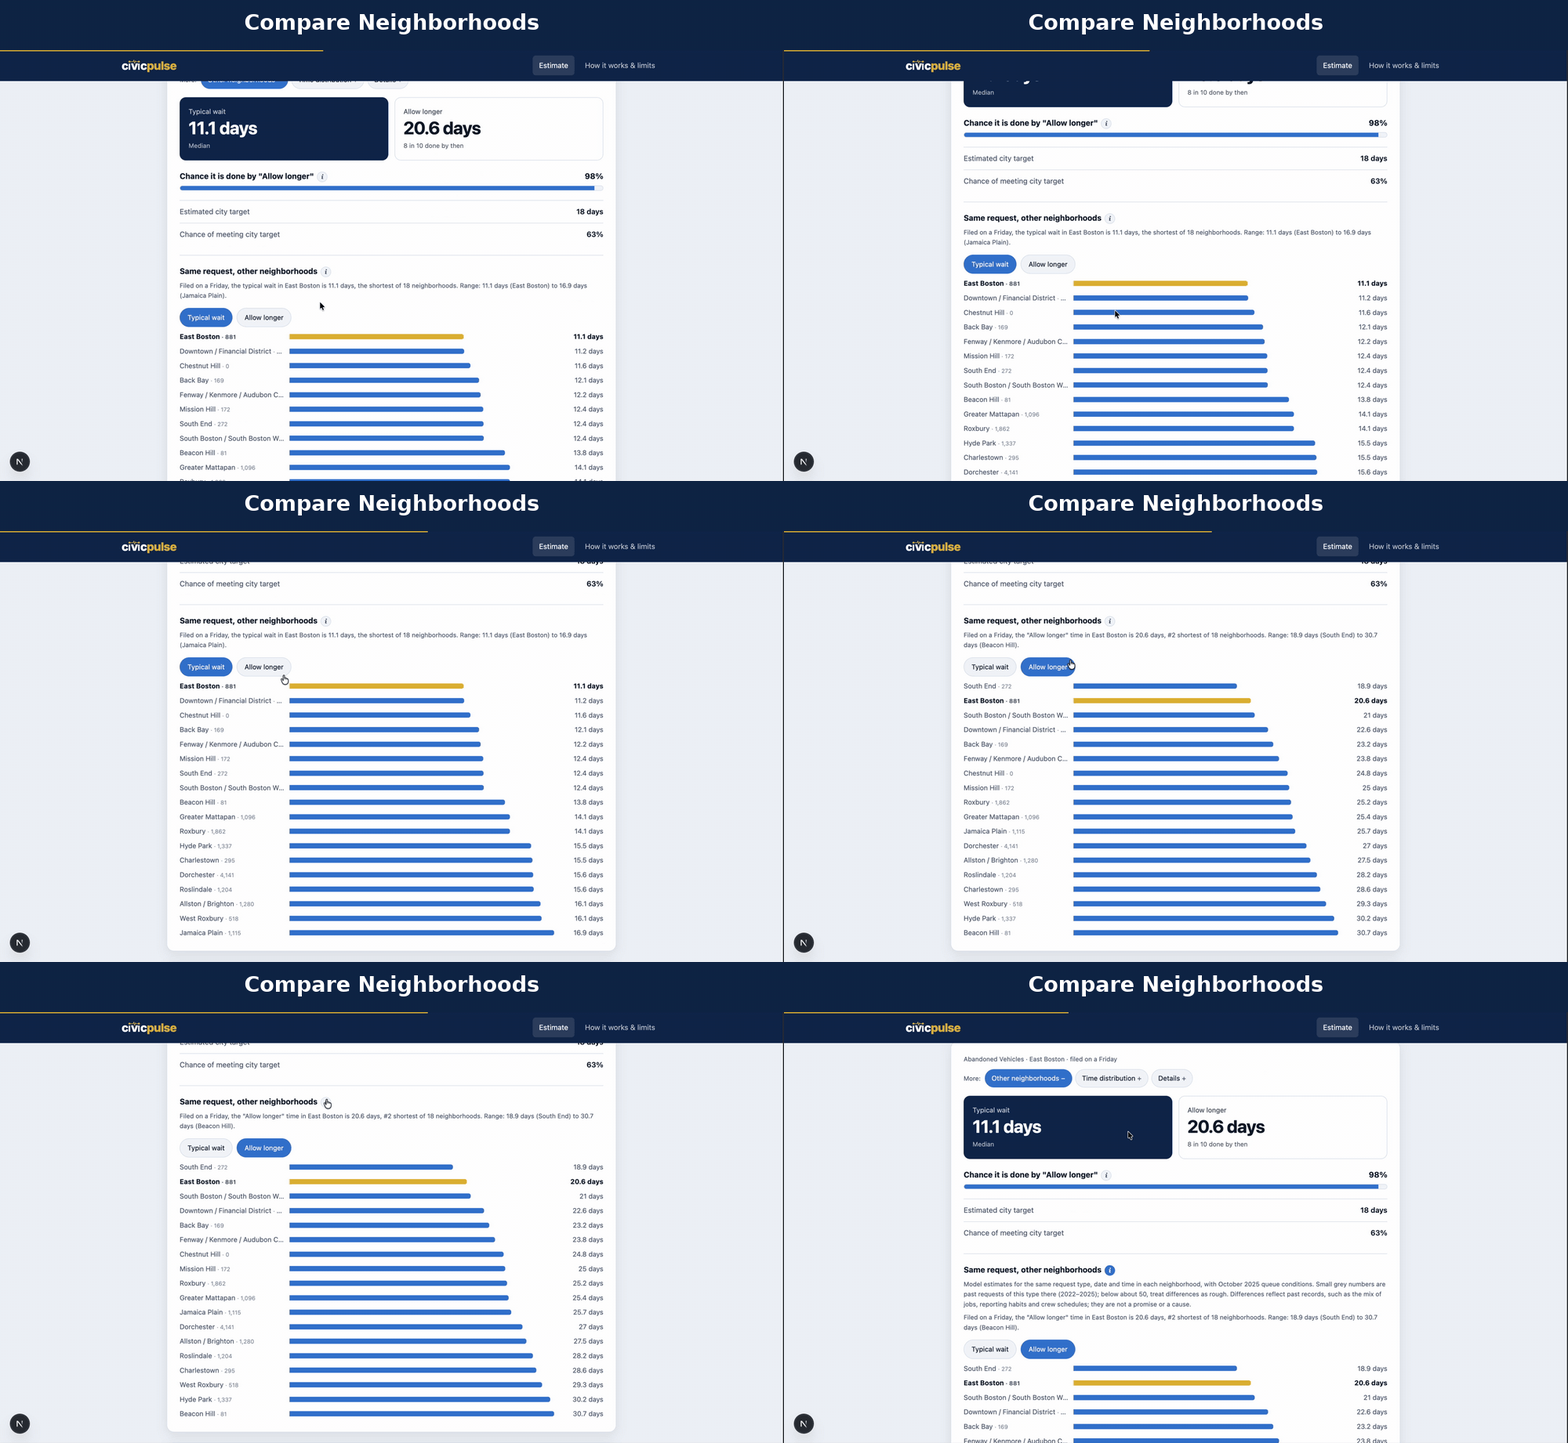
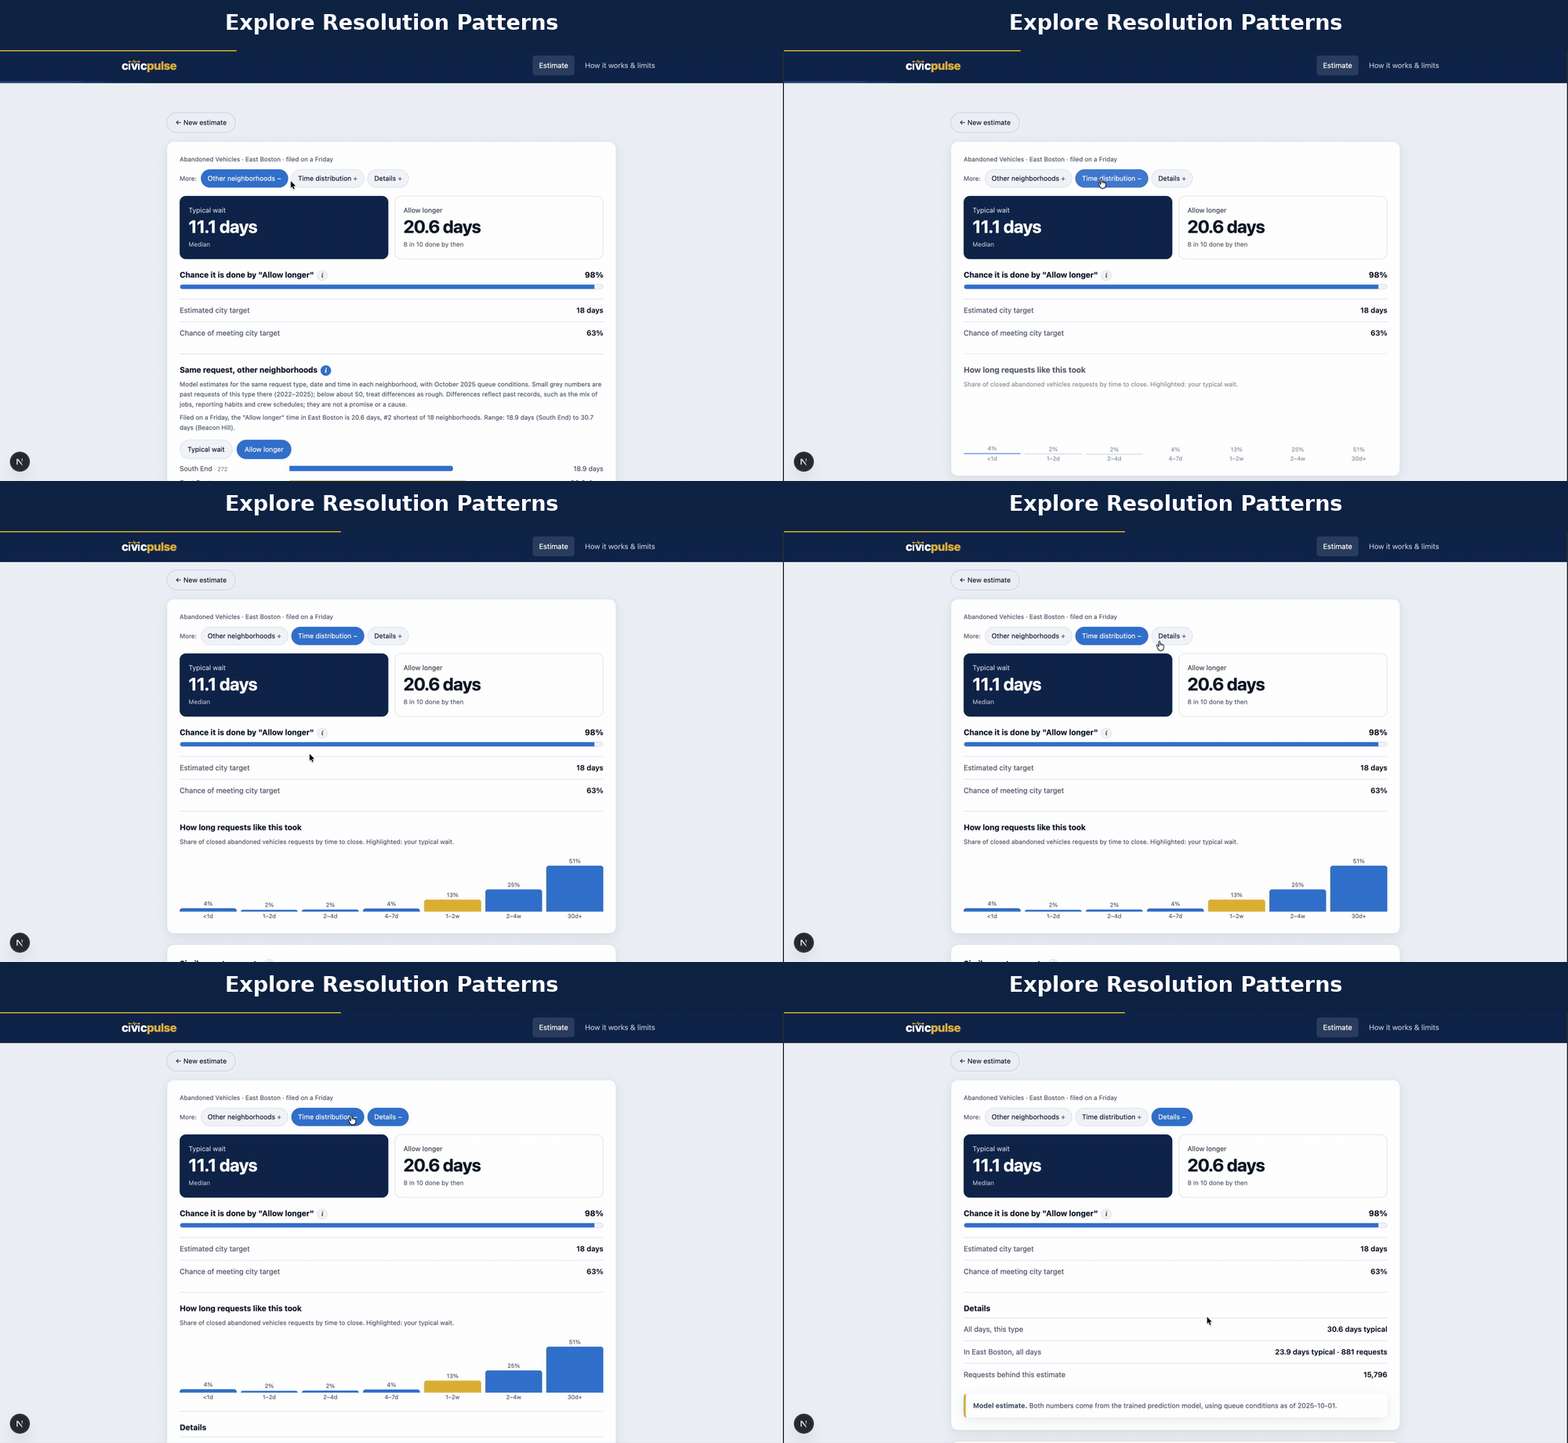
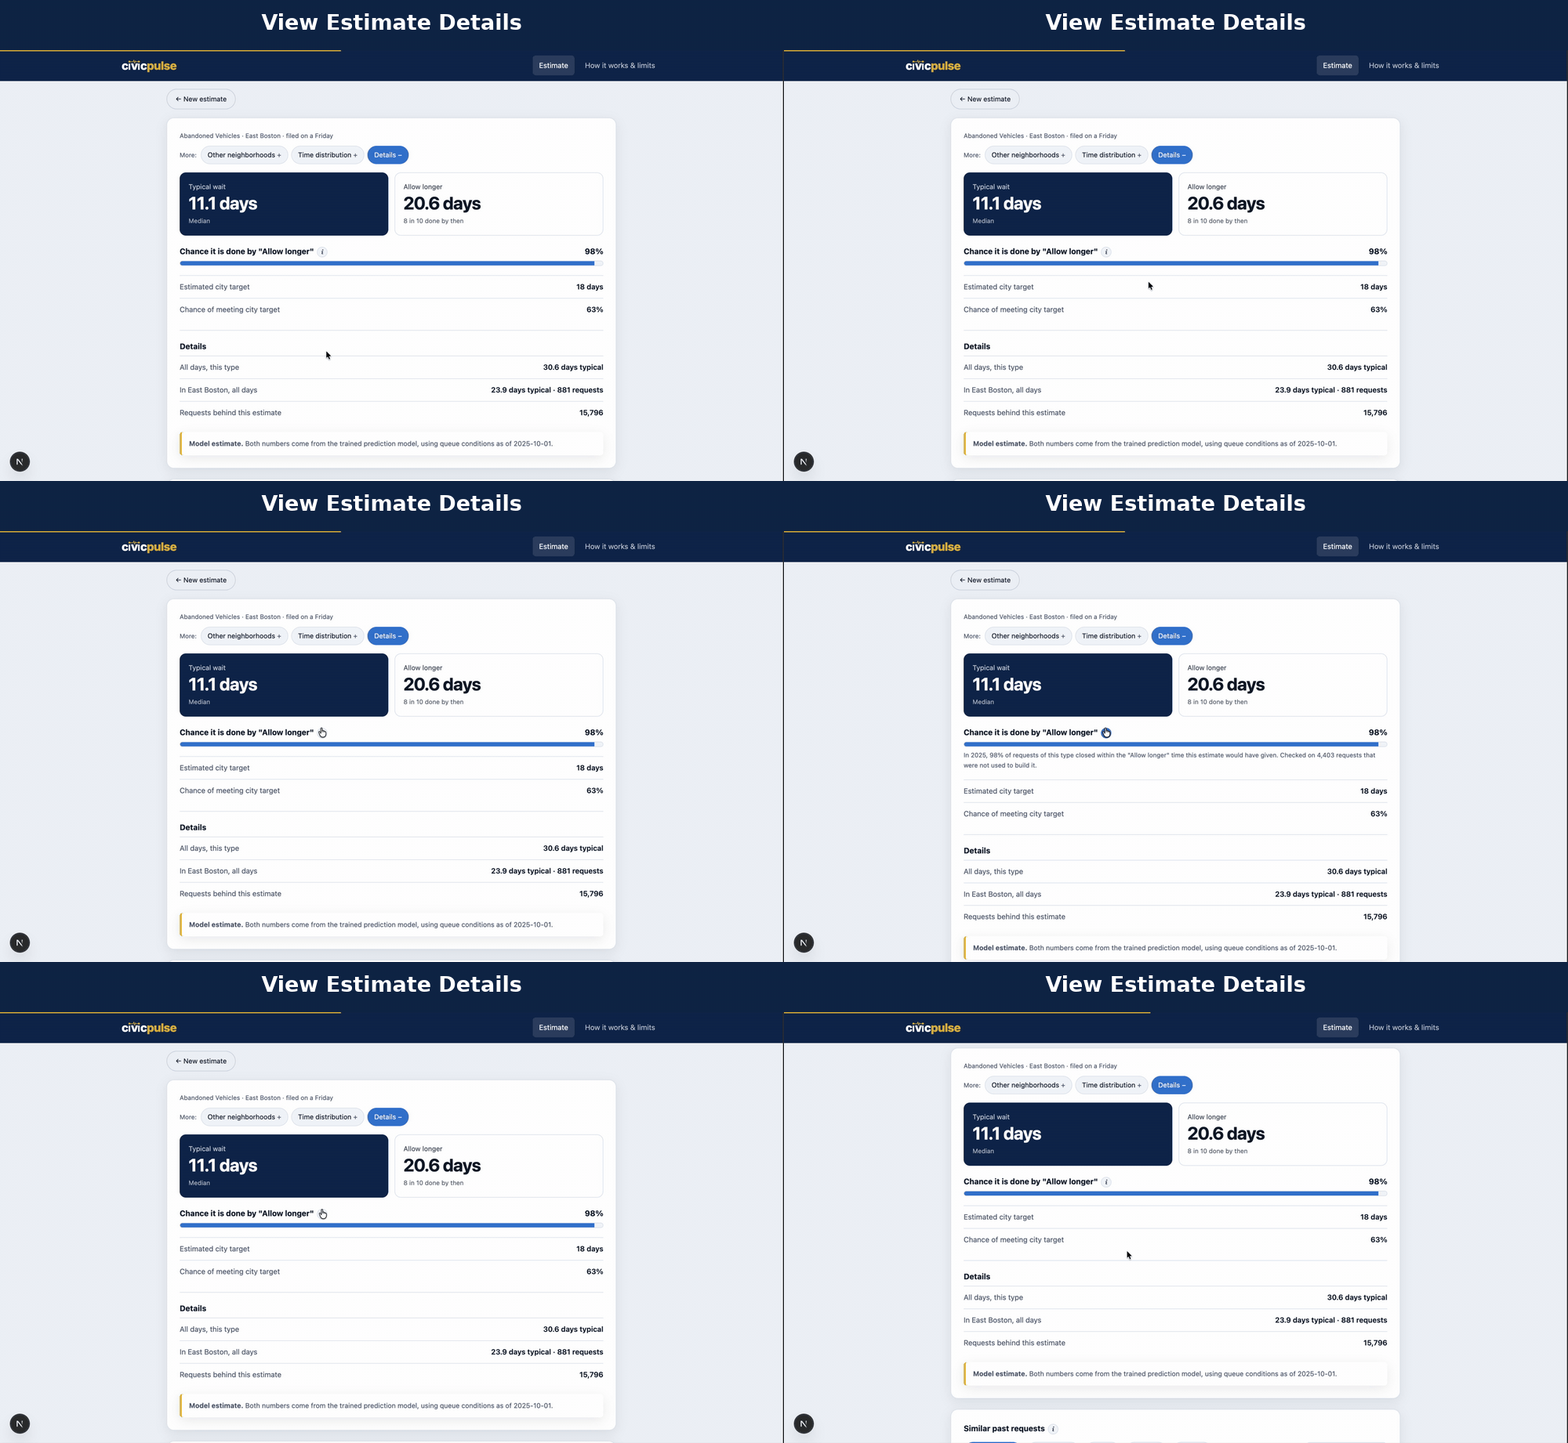
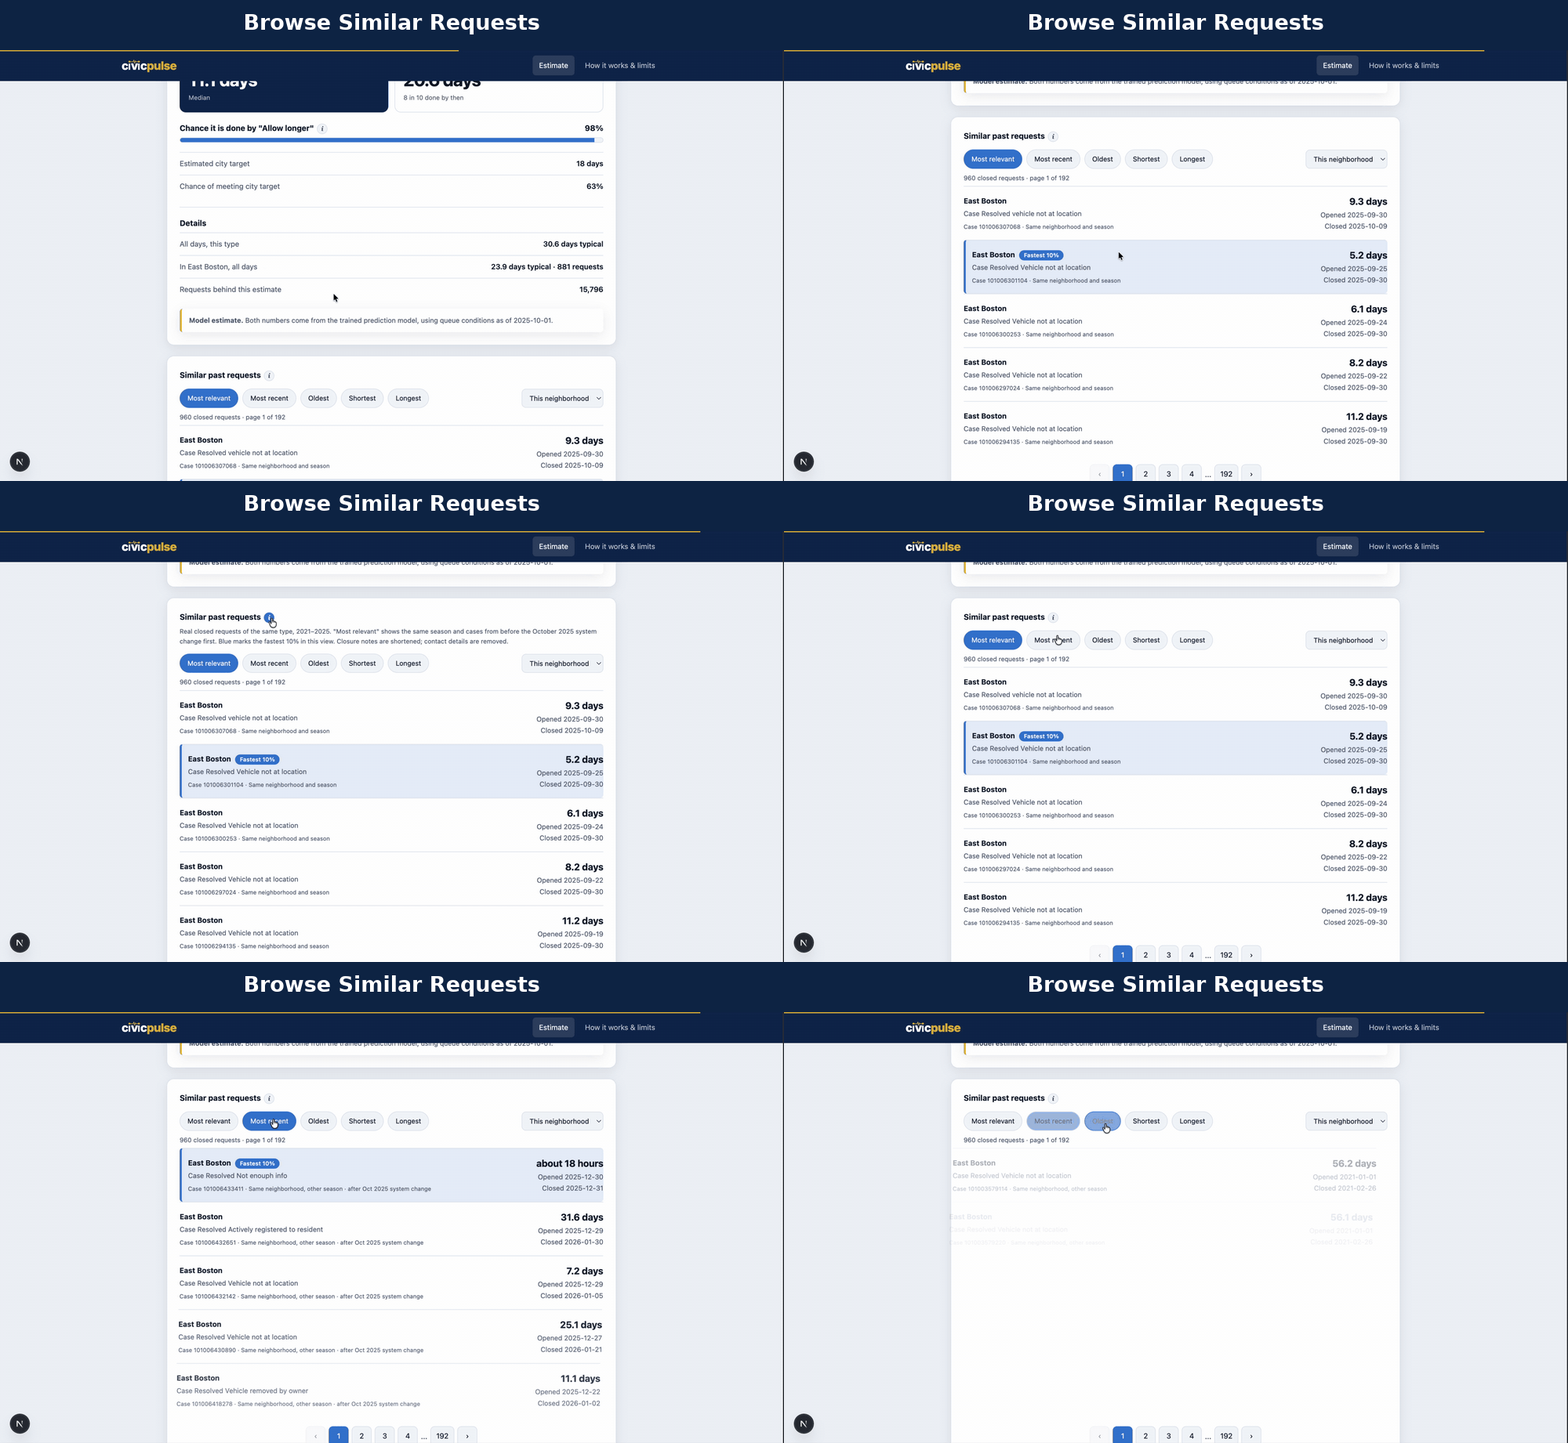
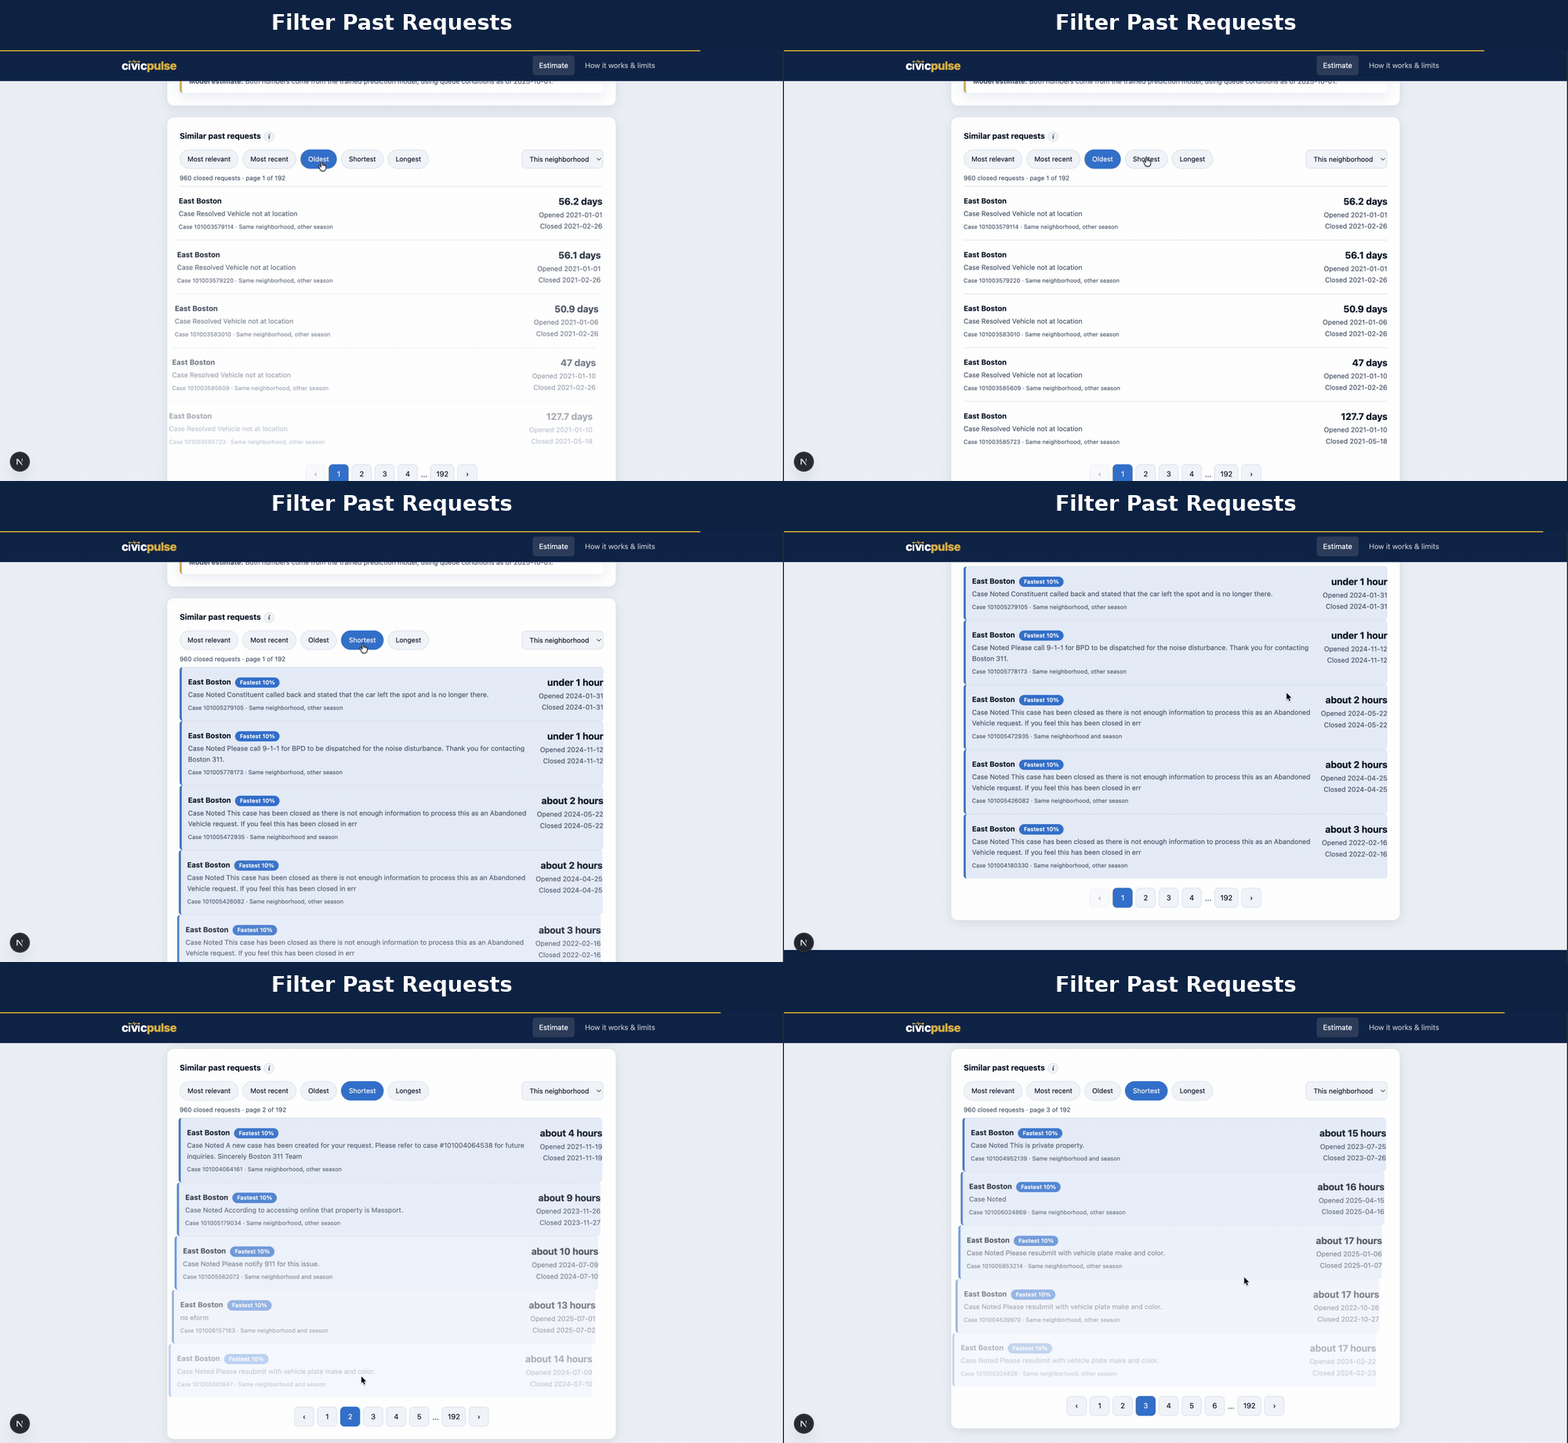
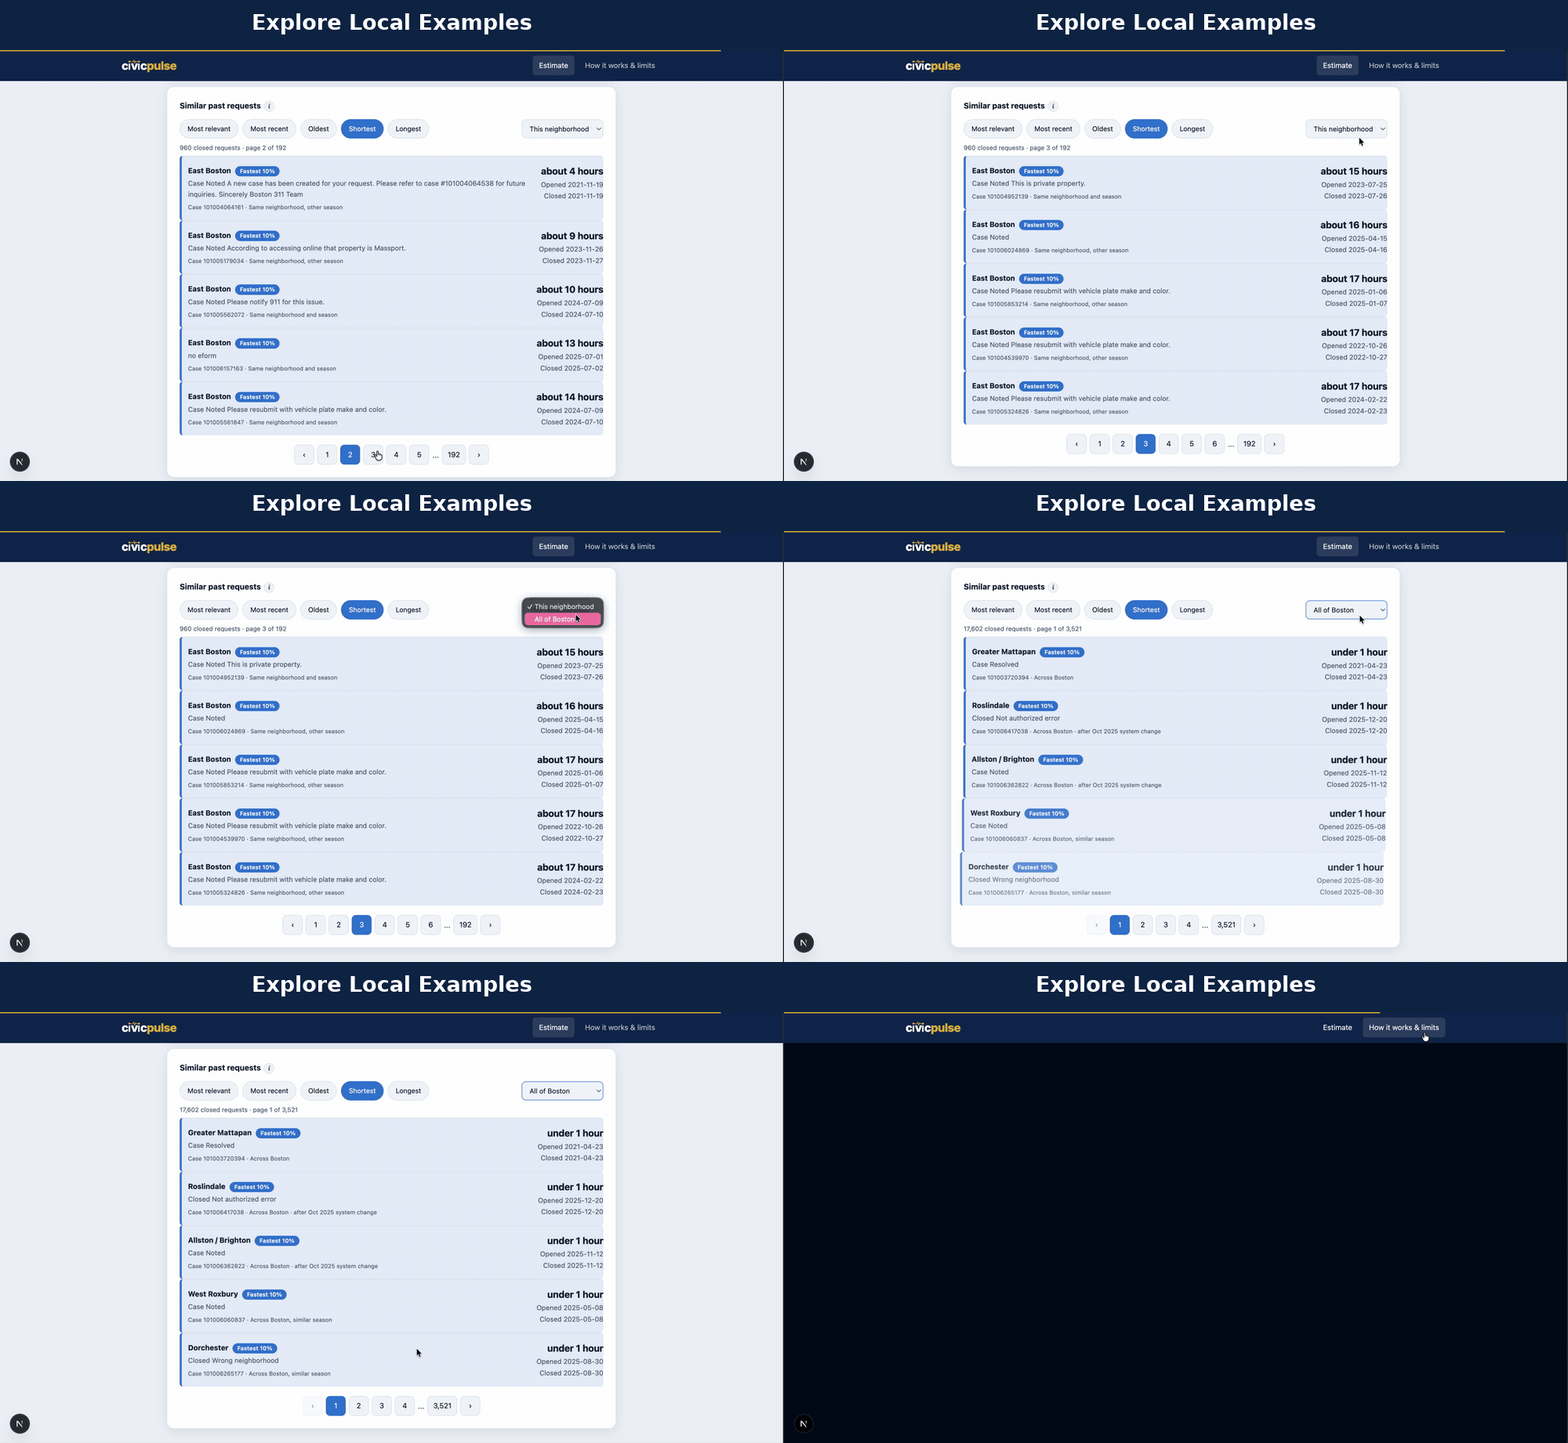
Civic Pulse is a data-driven web application that estimates how long Boston 311 service requests may take to resolve based on historical complaint records. We analyzed 1,433,236 Boston 311 requests from 2021 to 2025, ultimately using 1,099,534 valid closed requests after data cleaning. Our application allows users to: Predict resolution times: Select a complaint type, neighborhood, and submission date to receive a typical wait-time estimate (50th percentile) and a longer-wait estimate (80th percentile). Compare historical cases: Explore actual previously resolved Boston 311 complaints, including their processing times, locations, and recorded closure information. Explore neighborhood differences: Compare how long similar complaints have historically taken across Boston neighborhoods. Understand uncertainty: View the distribution of historical resolution times, supporting request counts, and warnings about factors that could affect estimates. Compare service targets: See estimated city target timelines and the probability of completion within those targets when supported by the model. We also created an information page explaining our methodology, data sources, and limitations. Instead of presenting a single number without context, we wanted users to understand both the prediction and the historical evidence behind it.
How we built it
We started with the City of Boston's publicly available 311 Service Requests dataset through Analyze Boston.
Data Collection and Processing Our first challenge was transforming a large government dataset into something useful for prediction. We processed over 1.4 million service requests, removed invalid records and outliers, and calculated resolution times using the difference between each request's opening and closing timestamps. We also organized complaint types, neighborhoods, and submission dates so the model could identify patterns across different types of municipal services. One important decision was to treat unresolved requests separately rather than assigning them a resolution time of zero. This helped prevent misleading results.
Machine Learning and Prediction We developed a machine learning pipeline using Python, pandas, and scikit-learn. We first established a baseline using historical resolution times by complaint type. We then trained gradient-boosted quantile regression models to estimate both typical and longer resolution times. The models incorporate information available when a complaint is submitted, including request characteristics, timing, and historical workload patterns. We trained on data from 2022–2023, tuned using 2024 data, and evaluated performance on a separate 2025 test set. Our median prediction model achieved a Mean Absolute Error (MAE) of 7.84 days, compared with 8.69 days for our baseline, representing approximately a 9.8% improvement. We also implemented a classifier to estimate whether a request would meet its service target when sufficient information was available.
Full-Stack Web Application To make our analysis accessible beyond notebooks and spreadsheets, we built a web application with Next.js for the interactive frontend. FastAPI to connect the interface with our Python prediction pipeline. Python and scikit-learn for data processing and machine learning. GitHub for version control and team collaboration. Users can search and select among numerous complaint categories, enter their neighborhood and submission date, and receive estimates generated by our trained models. We connected the prediction results with actual historical case records, allowing users to explore similar previously resolved complaints rather than relying on the model alone. We also designed visualizations that explain wait-time distributions and differences across neighborhoods.
Challenges we ran into
Working with Real-World Government Data Government datasets are rarely perfectly clean. We encountered missing values, unusual resolution times, inconsistent complaint categories, and requests that had never been officially closed. One particularly important limitation was that approximately 25% of 2025 requests remained unclosed in the dataset. Ignoring these records could make average waiting times appear shorter than what some residents actually experience. Boston also transitioned to a new 311 system in October 2025, creating additional limitations in the historical closure data. We addressed these issues through careful filtering, documented assumptions, and transparent explanations in the application.
Balancing Accuracy and Explainability Predicting government response times is difficult because two complaints in the same category may require very different amounts of work. A simple pothole repair and a complicated infrastructure issue might have significantly different timelines, even if their records appear similar. Rather than promising an exact completion date, we decided to show both a typical estimate and a longer-wait estimate. We also added historical comparisons and data limitations so users could interpret the results instead of blindly trusting a prediction.
Addressing Fairness and Neighborhood Differences Another major challenge was understanding the ethical implications of neighborhood-based predictions. We observed that historical processing times can differ across Boston neighborhoods. However, those differences do not automatically establish unequal treatment. Complaint frequency, population density, reporting behavior, request categories, and municipal workload can all affect the data. We therefore approached neighborhood comparisons as an opportunity to identify patterns worth investigating, not as proof of discrimination or unequal funding. We also limited location information to the neighborhood level and made clear that Civic Pulse is not an official City of Boston service.
Integrating Data Science with a User-Friendly Product Building a predictive model was only part of the challenge. We also needed to make the results understandable to people without a data science background. Connecting our Python models to a Next.js frontend through FastAPI required coordination between data processing, model outputs, backend endpoints, and interface design. We had to translate statistical concepts such as percentiles, uncertainty, and model predictions into intuitive visuals and explanations. This pushed us to think about Civic Pulse not just as a machine learning project, but as a product designed around real users.
Accomplishments that we're proud of
Our biggest accomplishment was transforming a large public dataset into a working, interactive civic technology application within a limited timeframe. Some milestones we're particularly proud of include:
- Processing 1.43 million public service requests and preparing approximately 1.10 million valid closed records for analysis.
- Improving predictive performance by approximately 9.8% compared with our baseline model, reducing MAE from 8.69 to 7.84 days.
- Building an end-to-end application that connects a machine learning model to a user-friendly website.
- Making predictions explainable through historical cases, neighborhood comparisons, and wait-time distributions.
- Addressing responsible AI considerations by explicitly communicating uncertainty, limitations, privacy considerations, and potential biases. Beyond the technical accomplishments, we're proud that we built something focused on a real problem affecting people in our own community. We didn't want to create a machine learning demonstration that simply generates numbers. We wanted to build a product that makes public information more accessible and useful.
What we learned
Throughout this hackathon, we learned that building a useful data science product involves much more than training a model. Working with a large, imperfect public dataset taught us the importance of data cleaning, feature engineering, validation, and understanding how missing information can influence results. We also gained practical experience connecting machine learning models to a full-stack web application and translating technical outputs into a format understandable to everyday users. One of our most important lessons was the difference between prediction and explanation. Our model can identify patterns in historical resolution times, but those patterns do not necessarily explain why a complaint was resolved faster or slower. We learned to be cautious about drawing conclusions from neighborhood differences and to communicate uncertainty rather than presenting our model as an unquestionable source of truth. Finally, working collaboratively under hackathon time constraints reinforced the importance of prioritization, communication, and integrating different parts of a project into one cohesive product.
What's next for CivicPulse
We see CivicPulse as a starting point for making civic data more accessible, understandable, and actionable. Moving forward, we hope to:
- Incorporate more recent and regularly updated Boston 311 data so predictions can reflect changing municipal service patterns.
- Integrate external factors such as weather conditions, which may influence repair schedules and service delays.
- Improve prediction accuracy by experimenting with additional features, model architectures, and methods for accounting for unresolved complaints.
- Expand neighborhood analysis by incorporating population density and other contextual information to better understand regional differences.
- Improve transparency and usability through additional visualizations, clearer explanations, and feedback from Boston residents
- Explore tools for city administrators that could help identify potential service bottlenecks and inform resource allocation.
Ultimately, we want CivicPulse to help bridge the gap between the public data cities collect and the information residents actually need. Public data shouldn't just tell us what happened. It should help us understand what might happen next.
Built With
- data-science
- data-visualization
- fastapi
- gradient-boosting
- machine-learning
- next.js
- numpy
- open-data
- pandas
- python
- quantile-regression
- react
- scikit-learn
- typescript
- vscode

Log in or sign up for Devpost to join the conversation.