🌧️ Inspiration
Rainfall data is collected continuously by government monitoring stations, but raw environmental data can be difficult for citizens and developers to understand.
We wanted to answer a simple question:
Can real government rainfall data be transformed into something people can actually explore and understand?
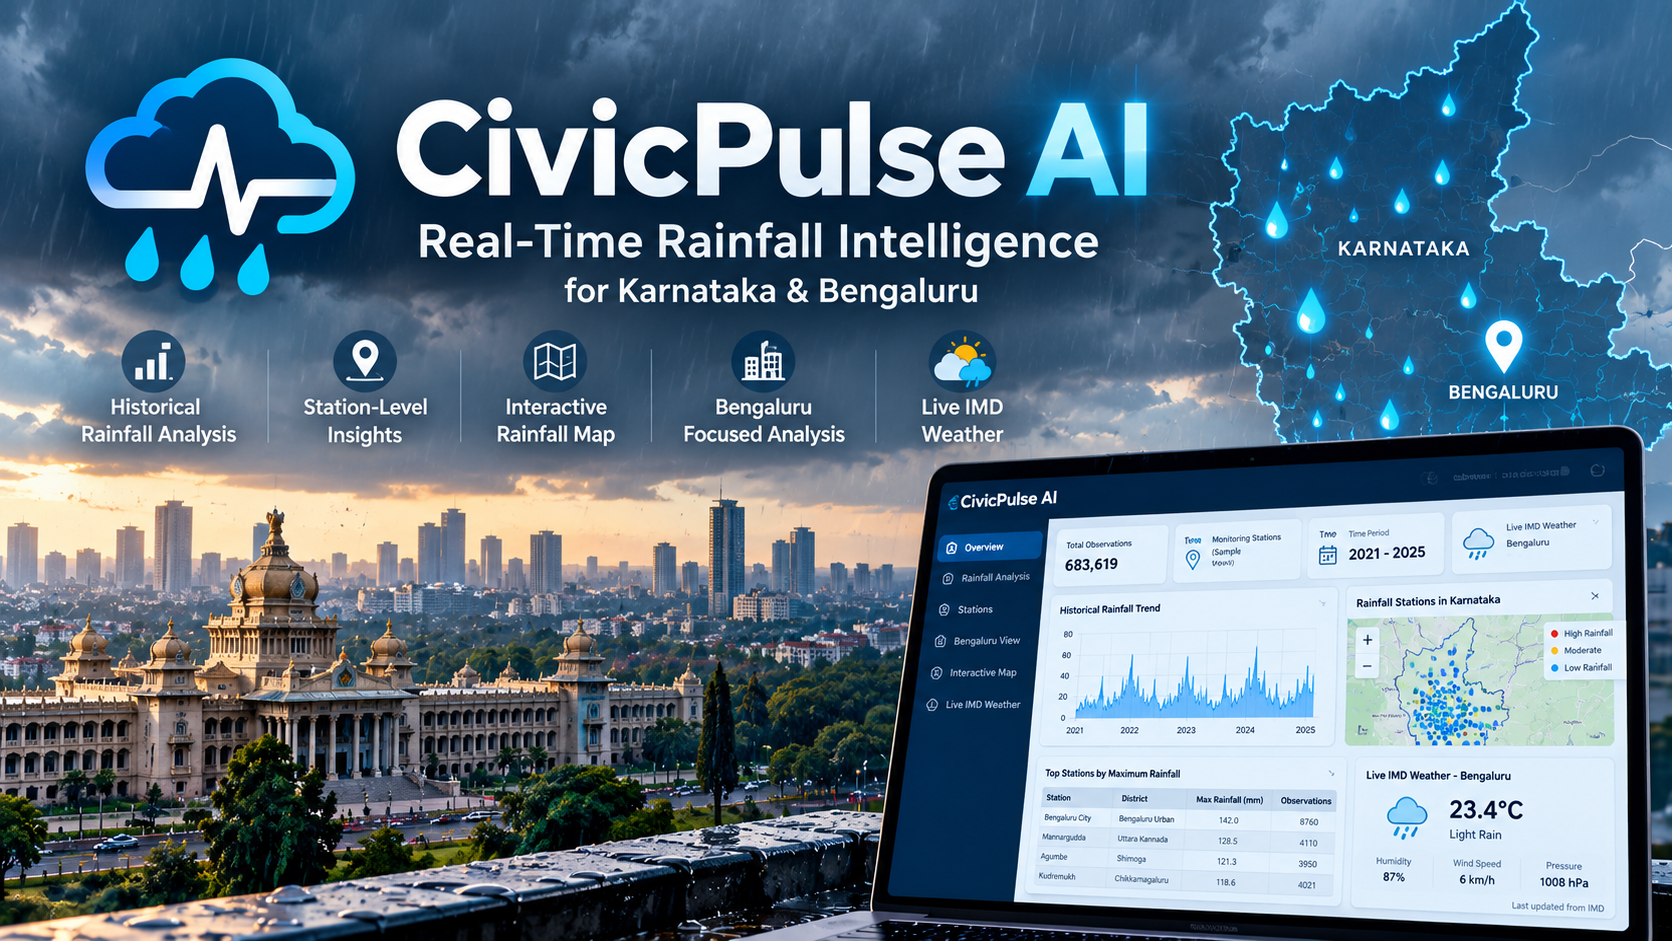
That idea led us to build CivicPulse AI, a civic intelligence platform focused on rainfall across Karnataka, with a specific focus on Bengaluru.
Instead of using synthetic or sample data, we chose to work with real Karnataka Government rainfall telemetry from 2021–2025, containing 683,619 observations. We also integrated current weather information from the India Meteorological Department (IMD) to connect historical rainfall analysis with current weather conditions.
💡 What We Built
CivicPulse AI turns raw rainfall telemetry into an interactive dashboard containing:
📊 Historical rainfall analysis 📍 Station-level rainfall statistics 🗺️ Interactive rainfall-station maps 🏙️ Bengaluru-focused analysis 🌐 Live IMD weather information 📈 Interactive charts and tables
The goal is to make large-scale environmental data easier to explore without requiring users to manually download and process hundreds of thousands of records.
🛠️ How We Built It
The project was built using Python, Pandas, NumPy, Plotly, and Streamlit.
Our workflow was:
Government Rainfall Data ↓ Data Loading ↓ Data Cleaning & Processing ↓ Timestamp Conversion ↓ Rainfall Analysis ↓ Station-Level Aggregation ↓ Geographic Visualization ↓ Streamlit Dashboard ↑ │ Live IMD API
We processed the Data Acquisition Time field for historical analysis and used Telemetry Hourly Rainfall (mm) to calculate rainfall statistics such as mean rainfall, maximum rainfall, and observation counts.
Latitude and longitude information from the dataset was used to create an interactive map of rainfall monitoring stations.
For current weather conditions, the dashboard connects to the official IMD API and retrieves live information for Bengaluru.
📚 What We Learned
Building CivicPulse AI taught us that creating a useful data-science application involves much more than training a machine-learning model.
We learned how to:
Work with a large real-world government dataset Process hundreds of thousands of rainfall observations Handle timestamp-based environmental data Perform station-level aggregation Combine statistical analysis with geographic visualization Build interactive dashboards using Streamlit Integrate a live government API Design a project around real-world civic use cases Make large datasets practical for GitHub distribution
Most importantly, we learned the importance of data authenticity and responsible interpretation. Rather than making unsupported flood-prediction claims, we focused the current version on rainfall intelligence and decision-support visualization.
🚧 Challenges We Faced
One of our biggest challenges was the size of the original rainfall dataset. The CSV was approximately 79.6 MB, which created problems when trying to upload it directly to GitHub.
We solved this by compressing the dataset into a .csv.gz file while preserving the complete dataset. The compressed version is approximately 4.3 MB and can be read directly by Pandas.
Another challenge was working with a large number of historical observations while keeping the dashboard responsive. We therefore focused on efficient filtering, aggregation, and visualization rather than trying to display every raw observation individually.
We also wanted to integrate flood prediction into the project. However, the rainfall dataset itself does not provide verified historical flood-event labels. Instead of creating synthetic labels or presenting an unsupported prediction model, we decided to build a strong rainfall-intelligence foundation that can later incorporate verified flood-event data.
Integrating live weather information was another important part of the project. We separated the historical government rainfall layer from the live IMD layer so that users can clearly understand which information represents historical telemetry and which represents current weather.
🌍 Why It Matters
CivicPulse AI demonstrates how publicly available government data can be transformed into an accessible civic technology application.
The project takes:
683,619 real rainfall observations
and turns them into:
Analysis → Visualization → Geographic Insights → Live Weather Context
Our vision is to continue developing CivicPulse AI into a broader environmental intelligence platform that can eventually incorporate additional verified datasets, advanced analytics, forecasting, and machine-learning capabilities.
CivicPulse AI turns complex government rainfall data into understandable, accessible, and useful civic intelligence.
Built With
- data-analysis
- data-science
- data-visualization
- geospatial-data
- government-data
- interactive-dashboard
- machine-learning
- numpy
- open-data
- pandas
- plotly
- predictive-modeling
- python
- rainfall-data
- rest-api
- streamlit
- weather-data

Log in or sign up for Devpost to join the conversation.