-
-
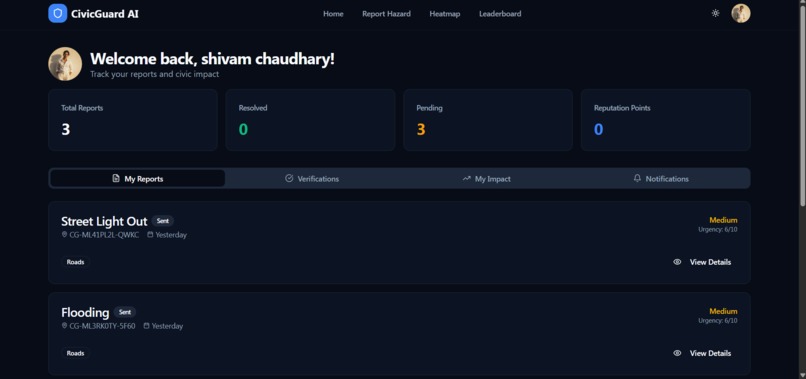
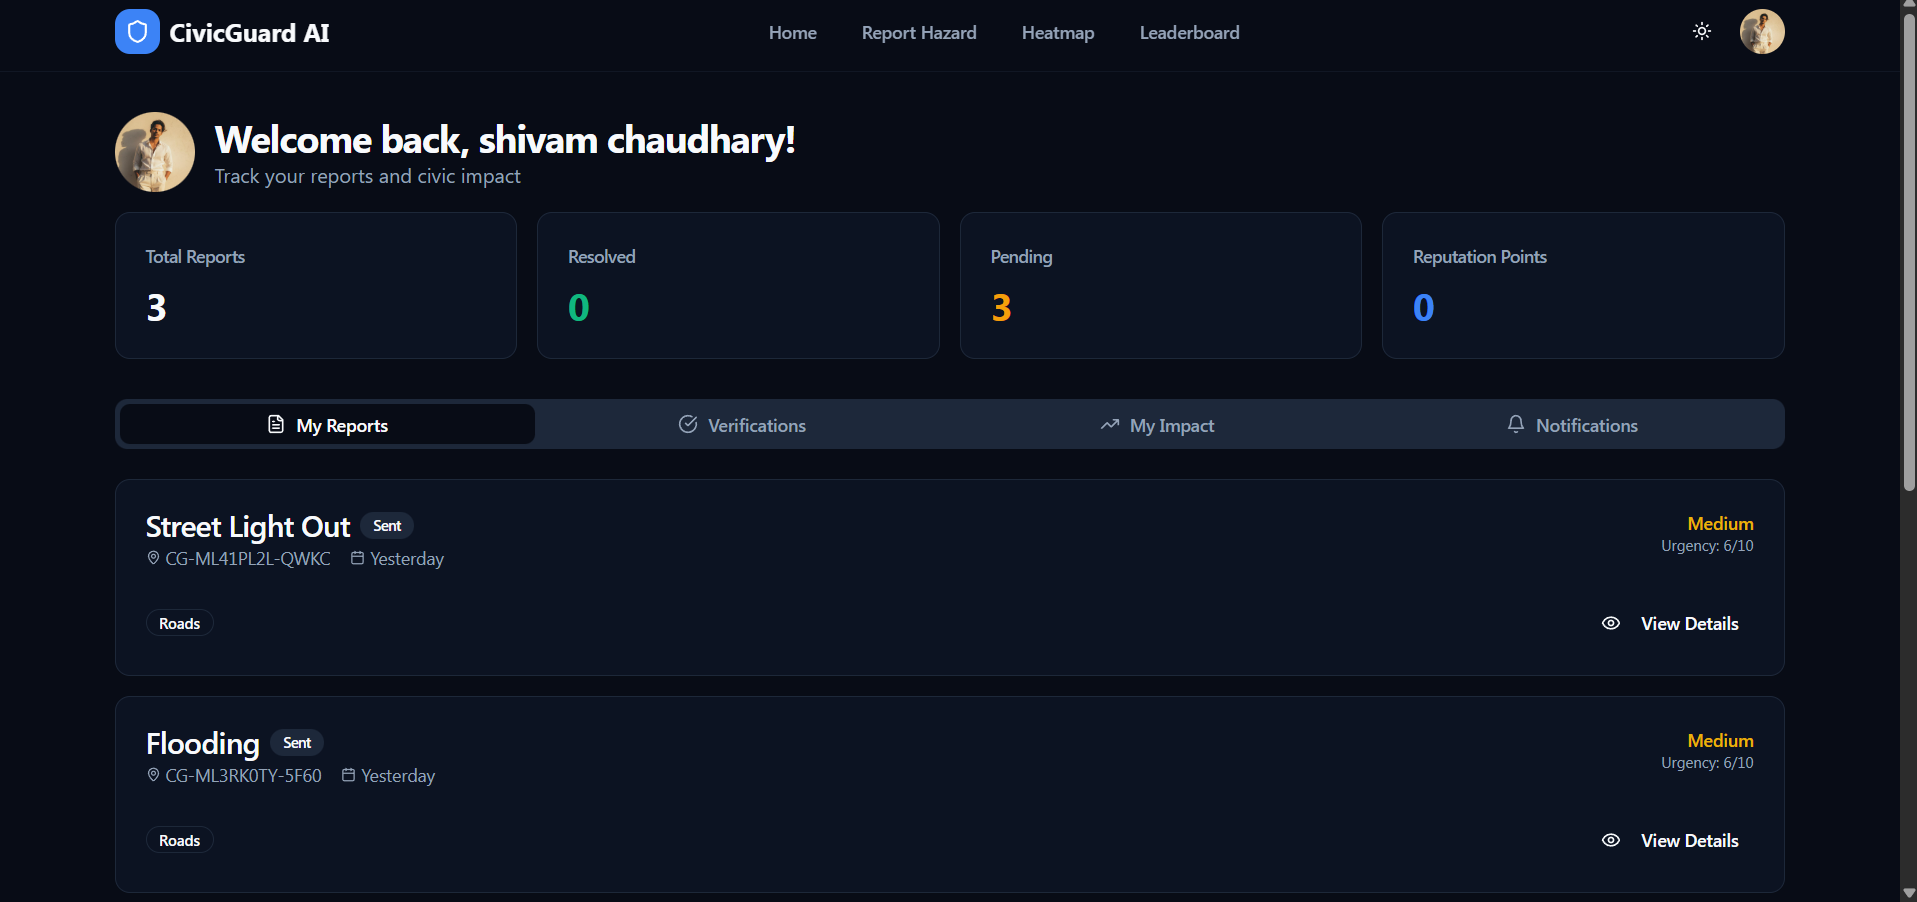
CivicGuard AI Personal Dashboard is designed to give you a high-level view of your impact on the community.
-
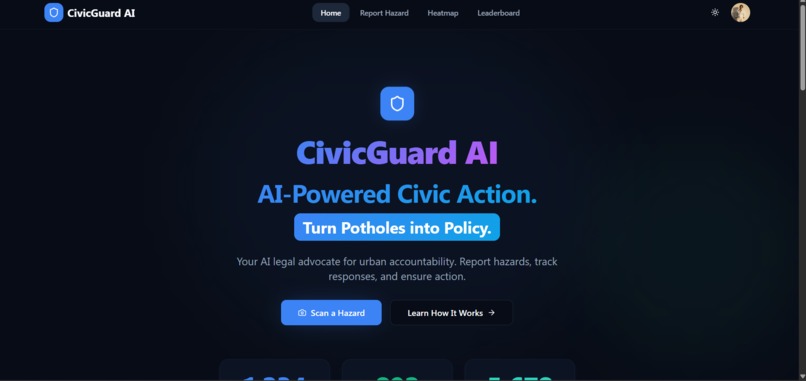
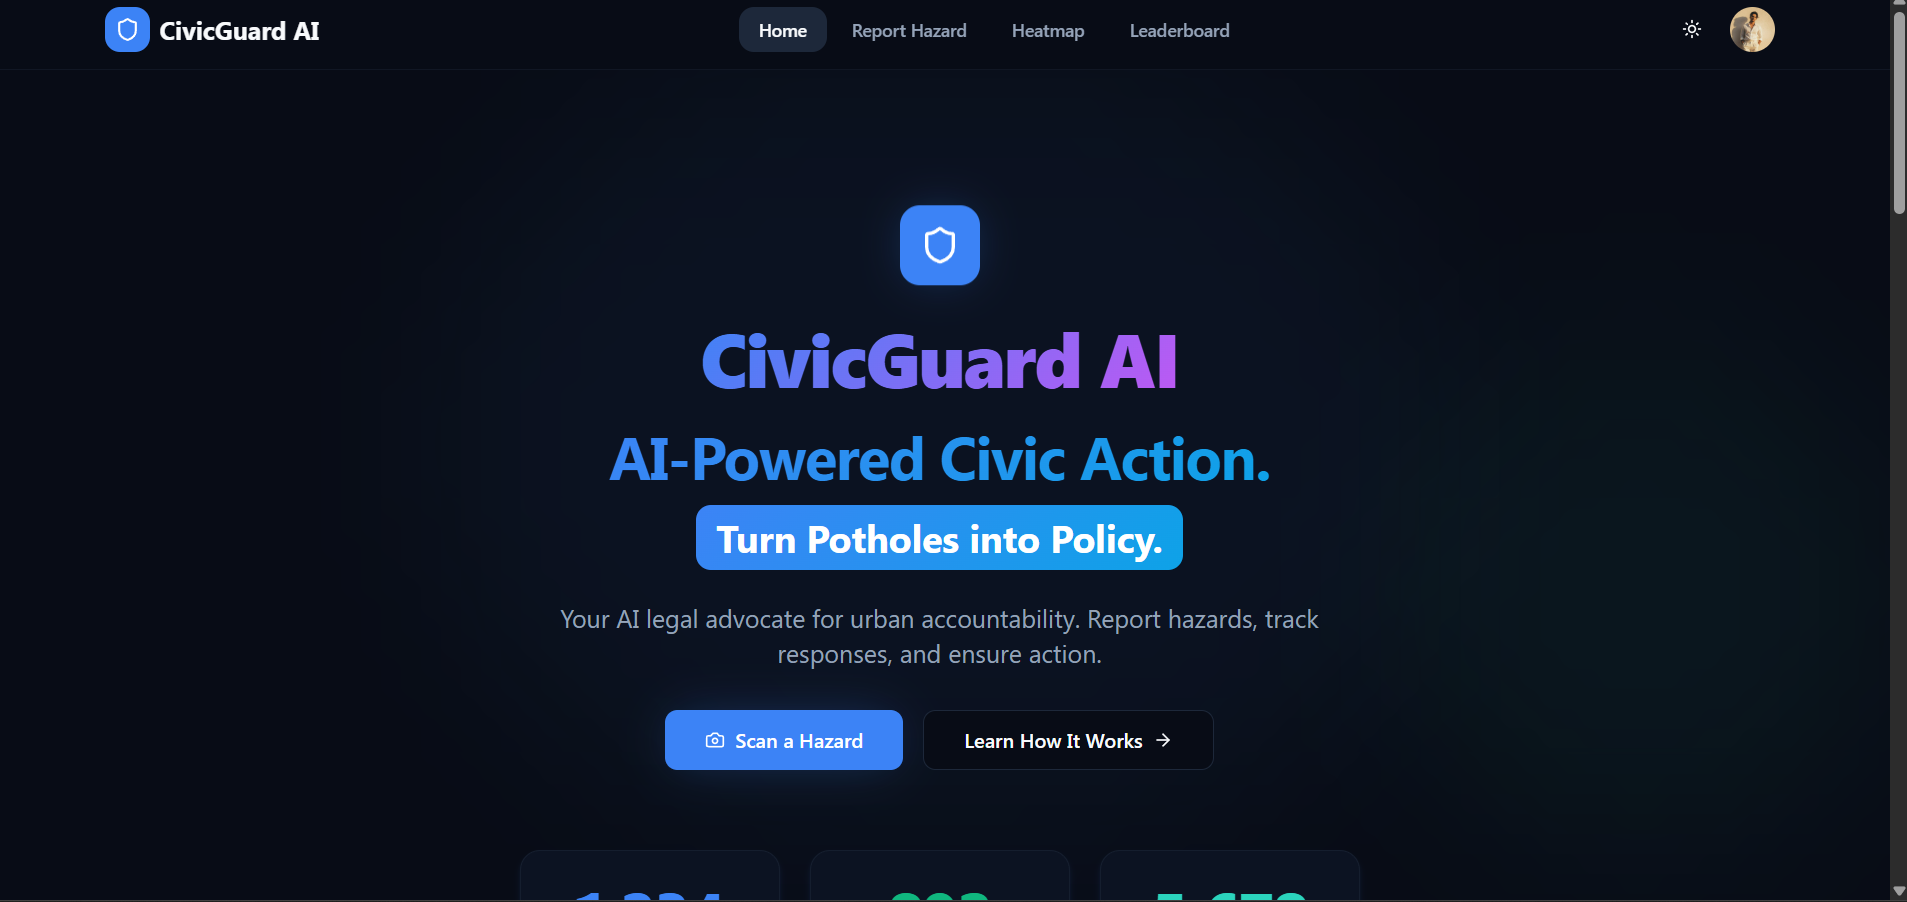
it’s designed to transition a casual visitor into an active reporter by making the mission clear and the entry point friction-free.
-
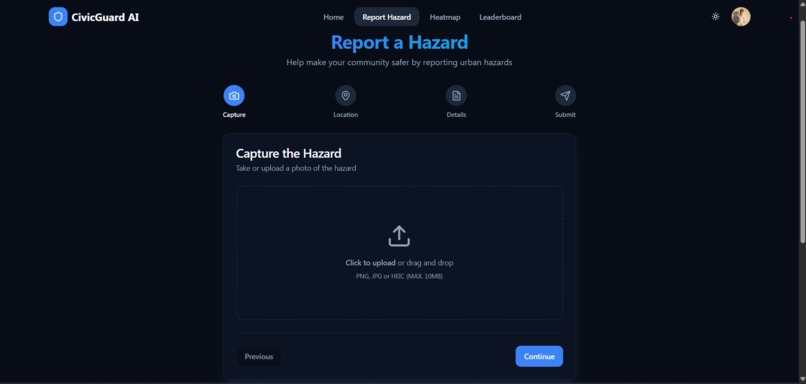
here one can report the hazard that he/she wanna post
-
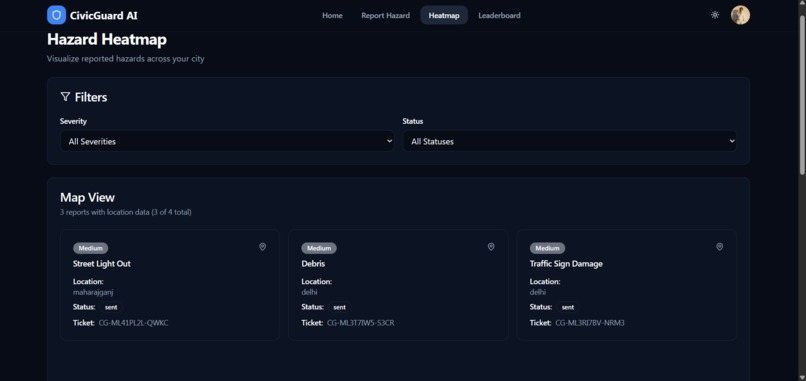
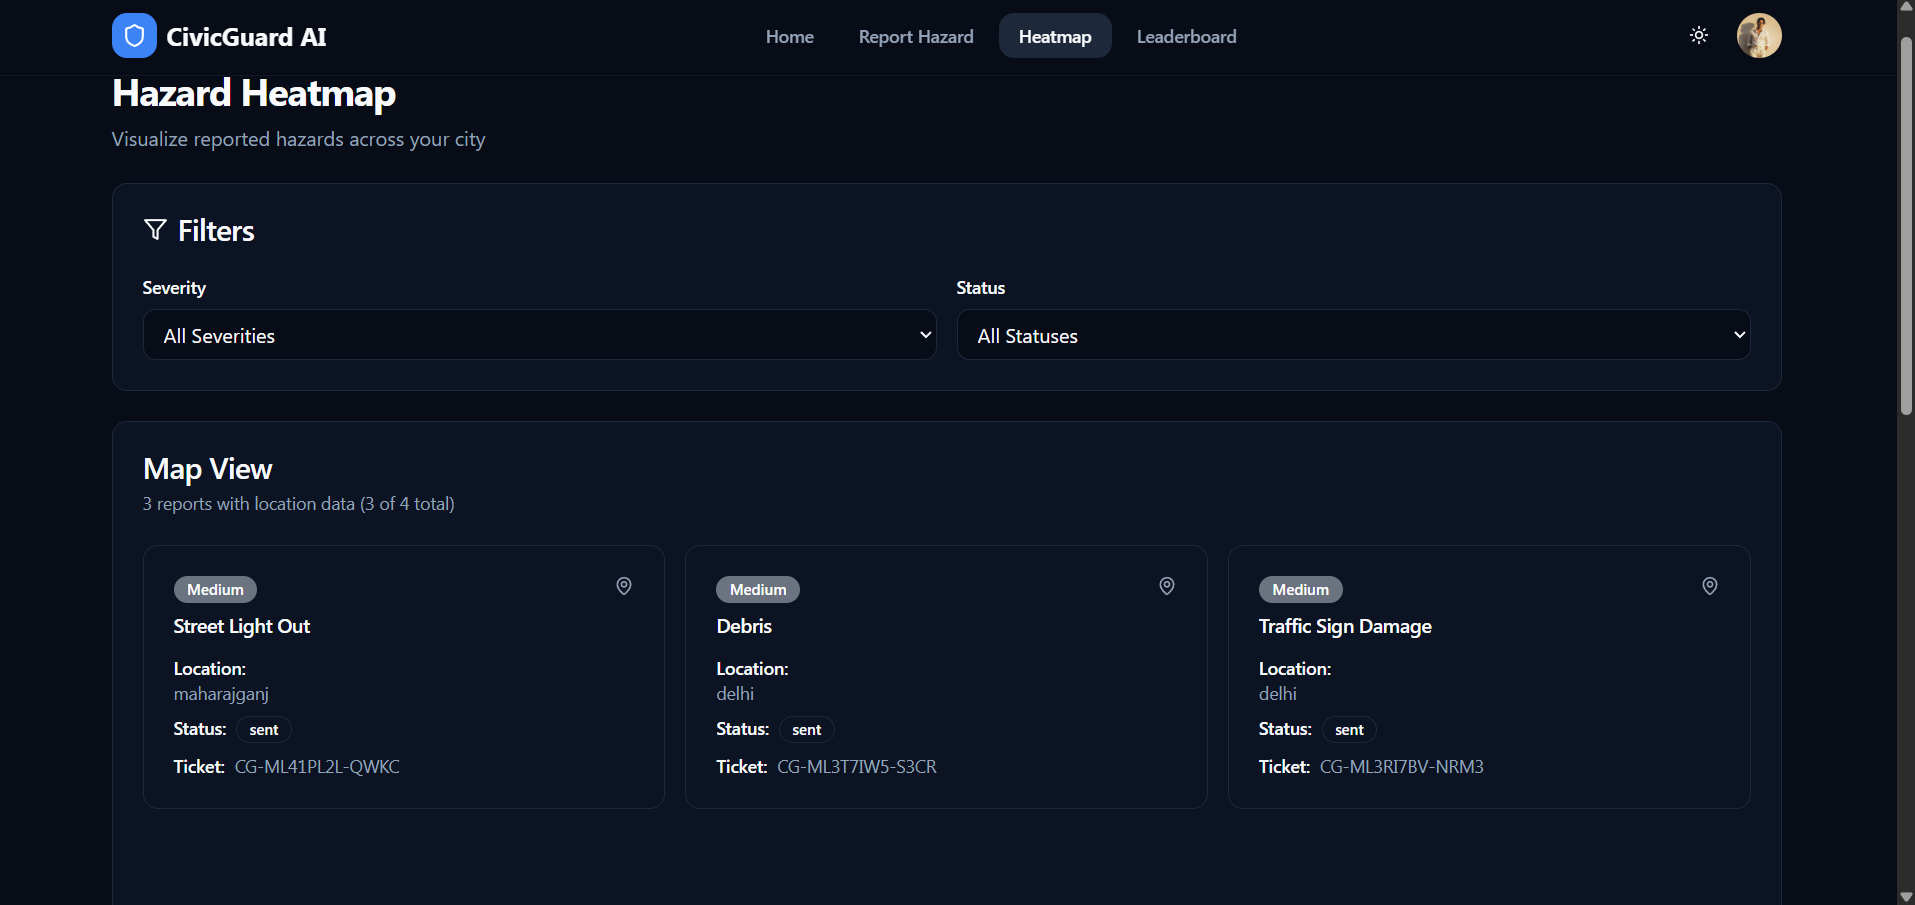
heatmap to address the submitted reports ,maps ,dark mode and so on
-
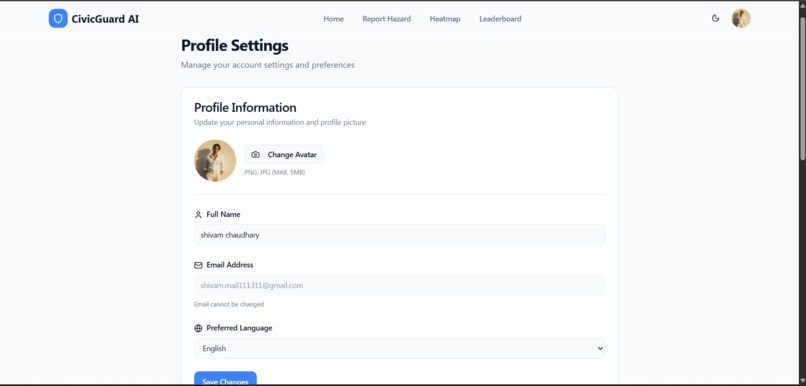
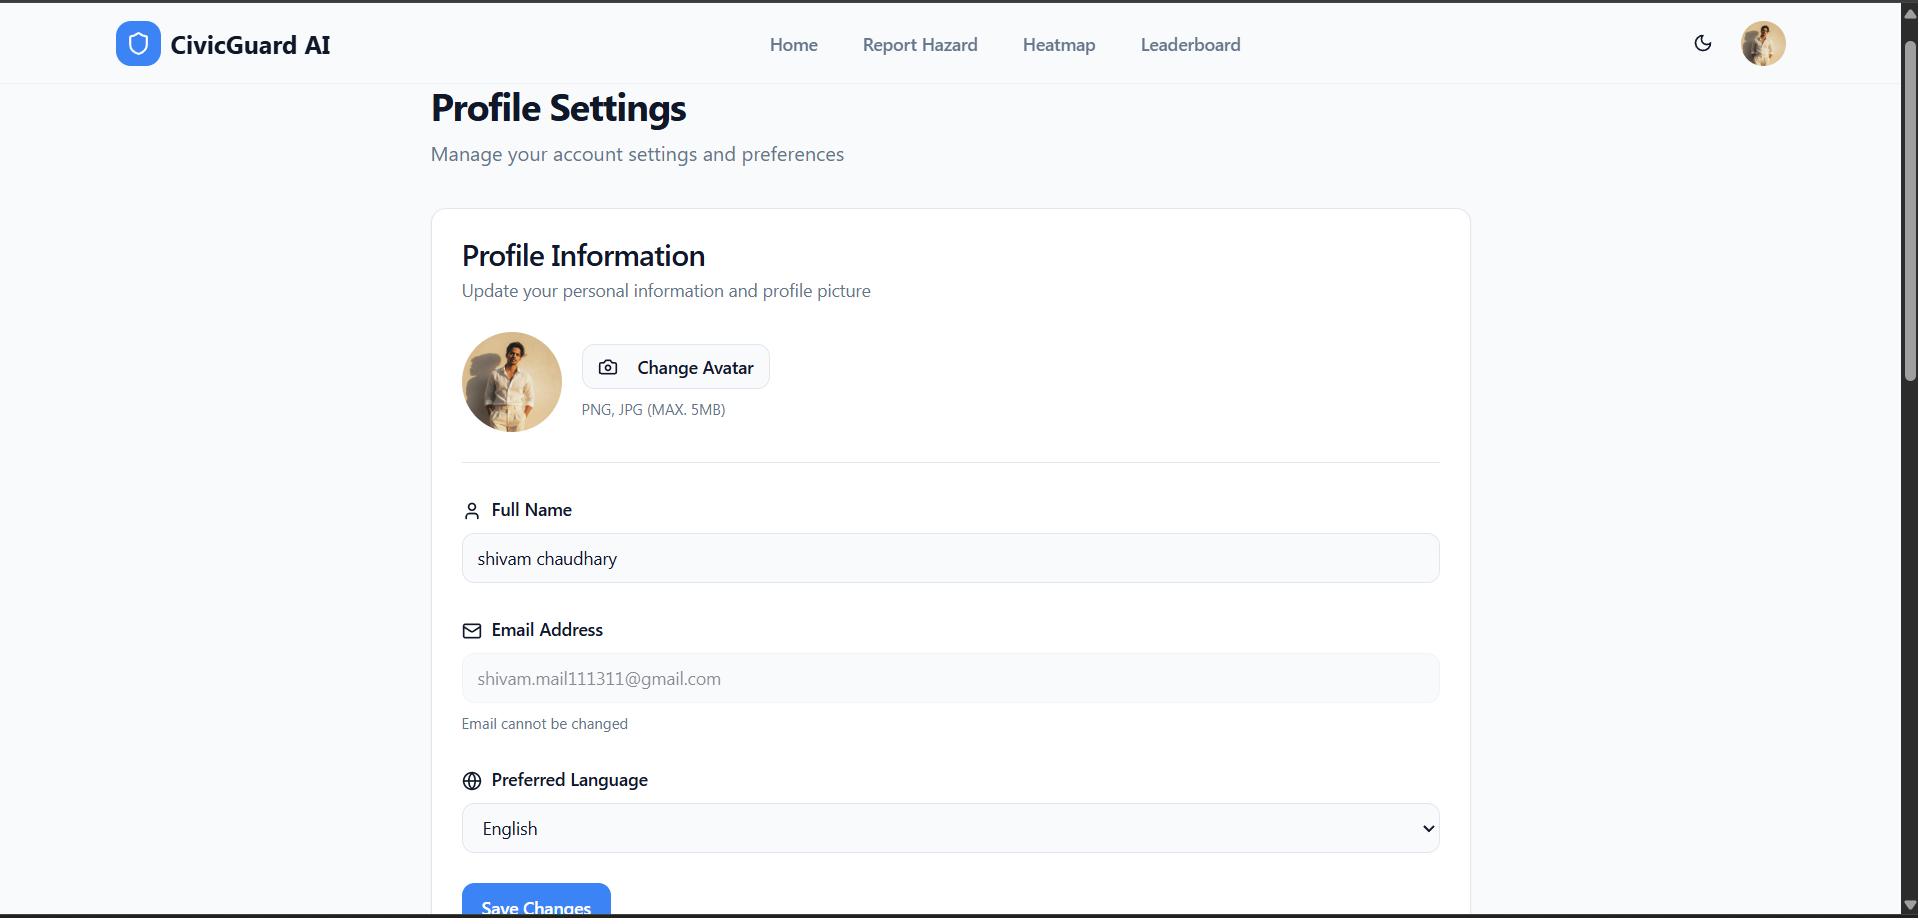
Profile Settings page in CivicGuard AI isn’t just a static "About Me" screen—it’s the hub for a user's civic identity
-
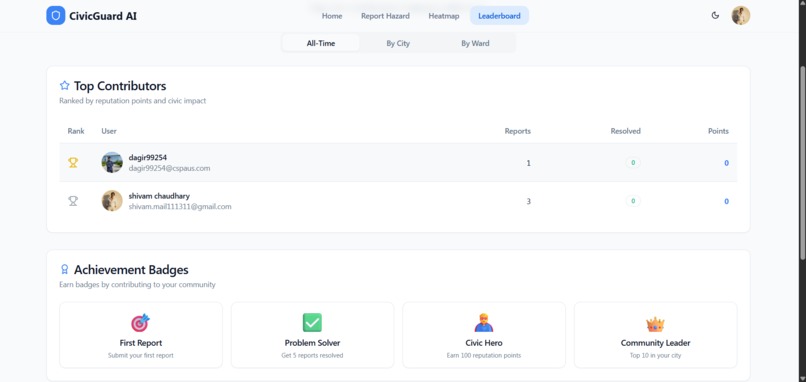
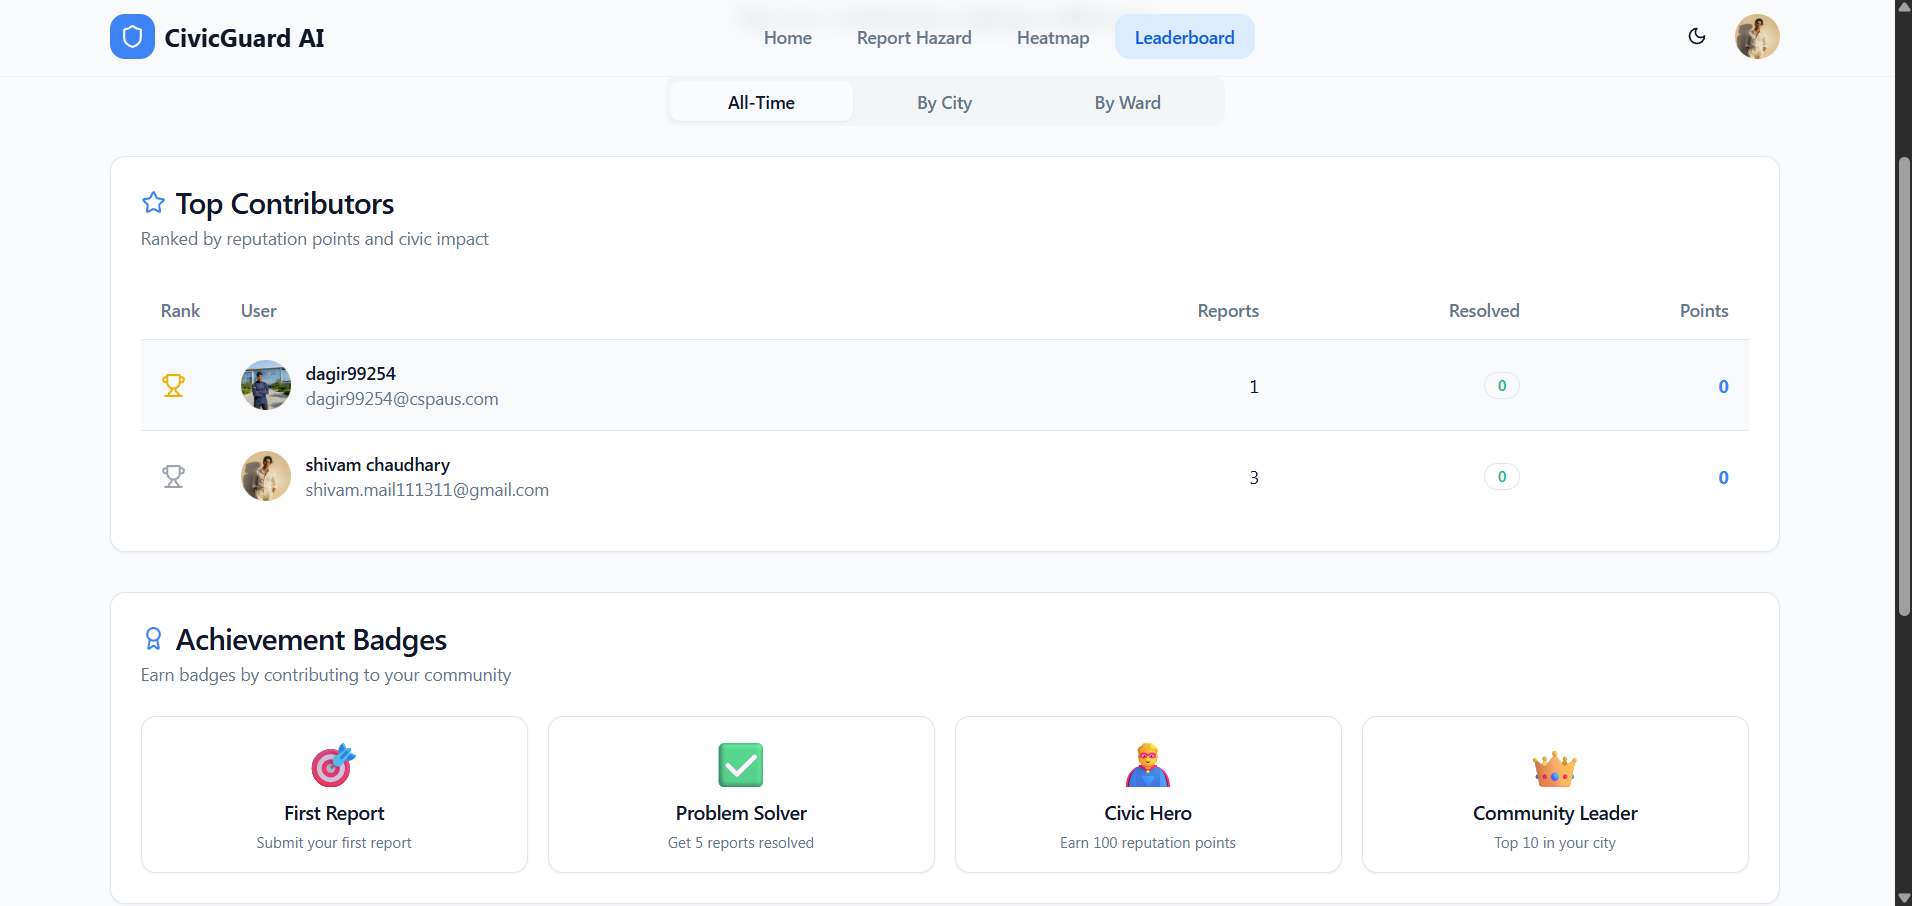
contribution list to compete at the zonal regions ,cities level or district
-
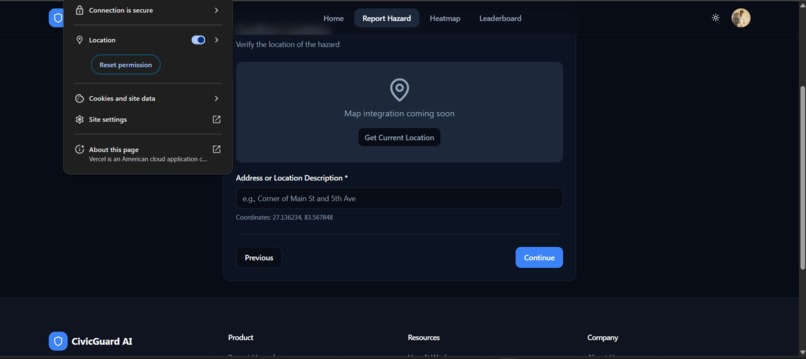
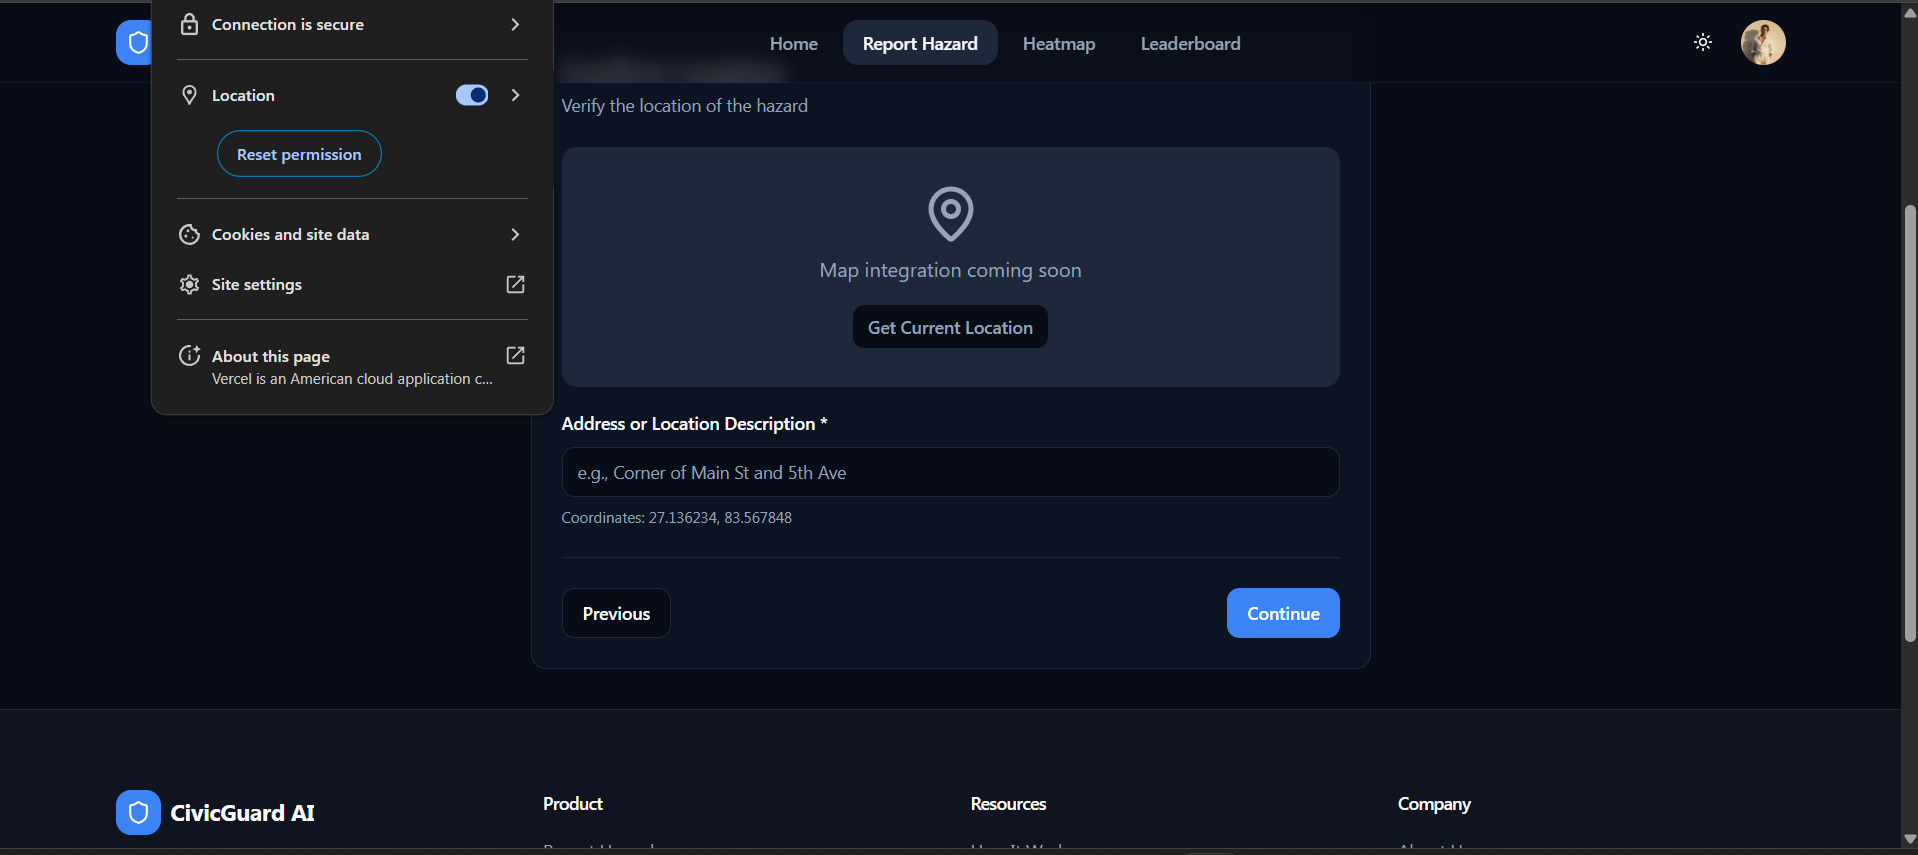
giving the access to location and giving the real time coordinated of the hazard location
-

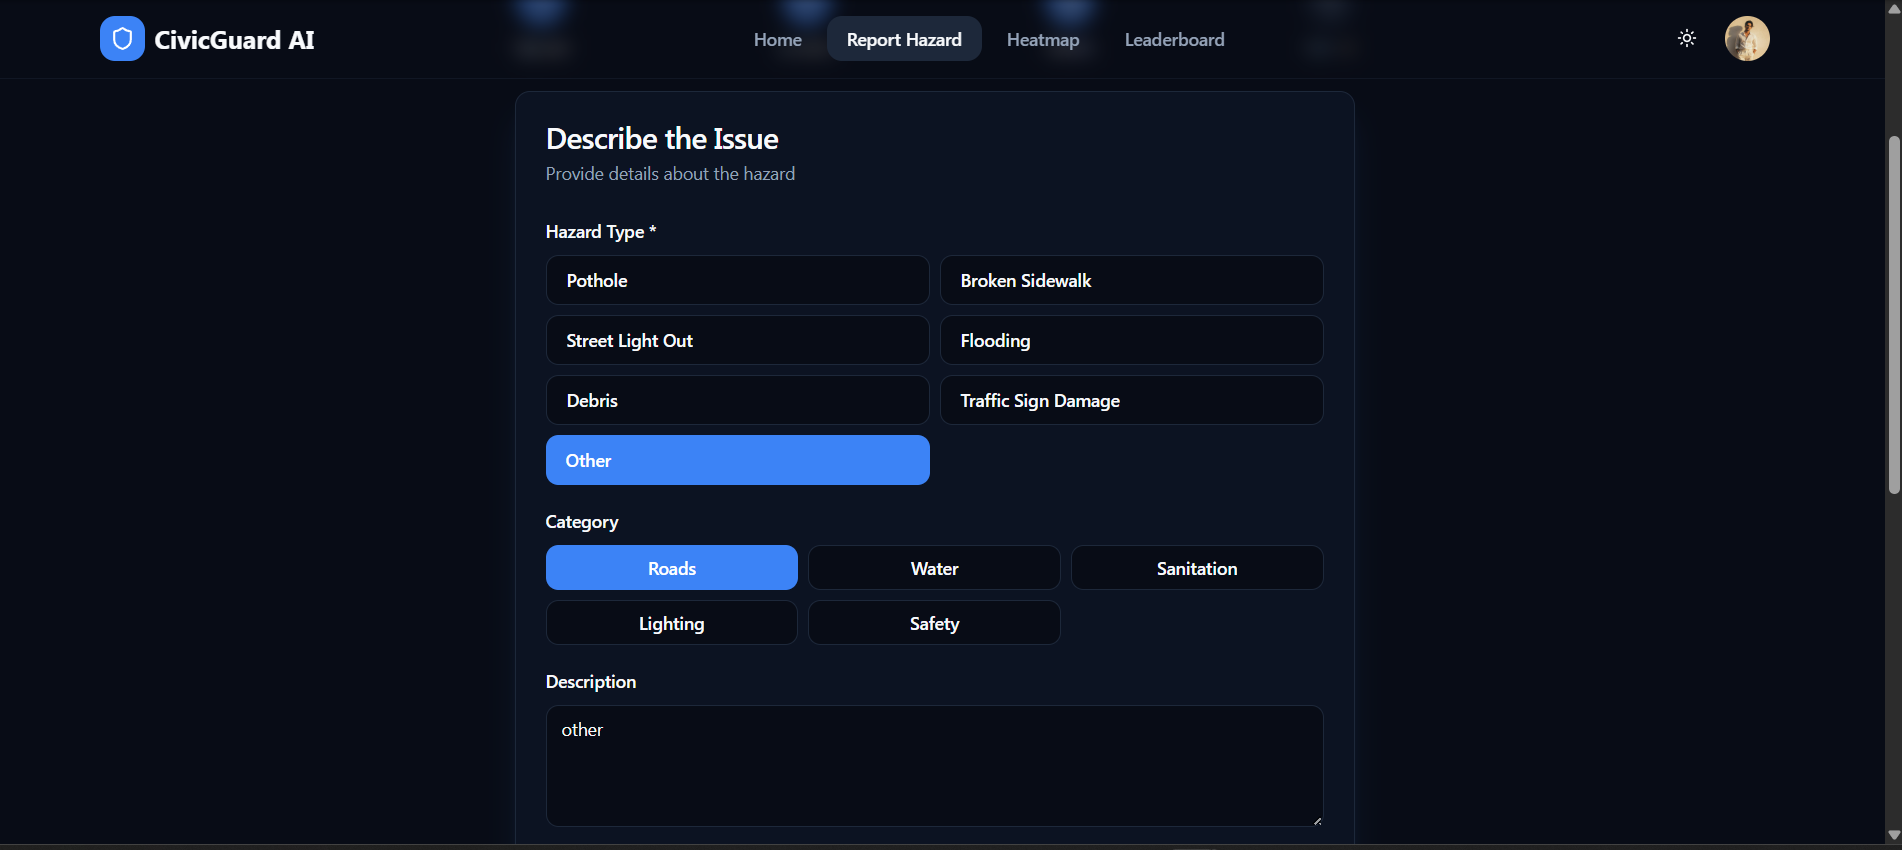
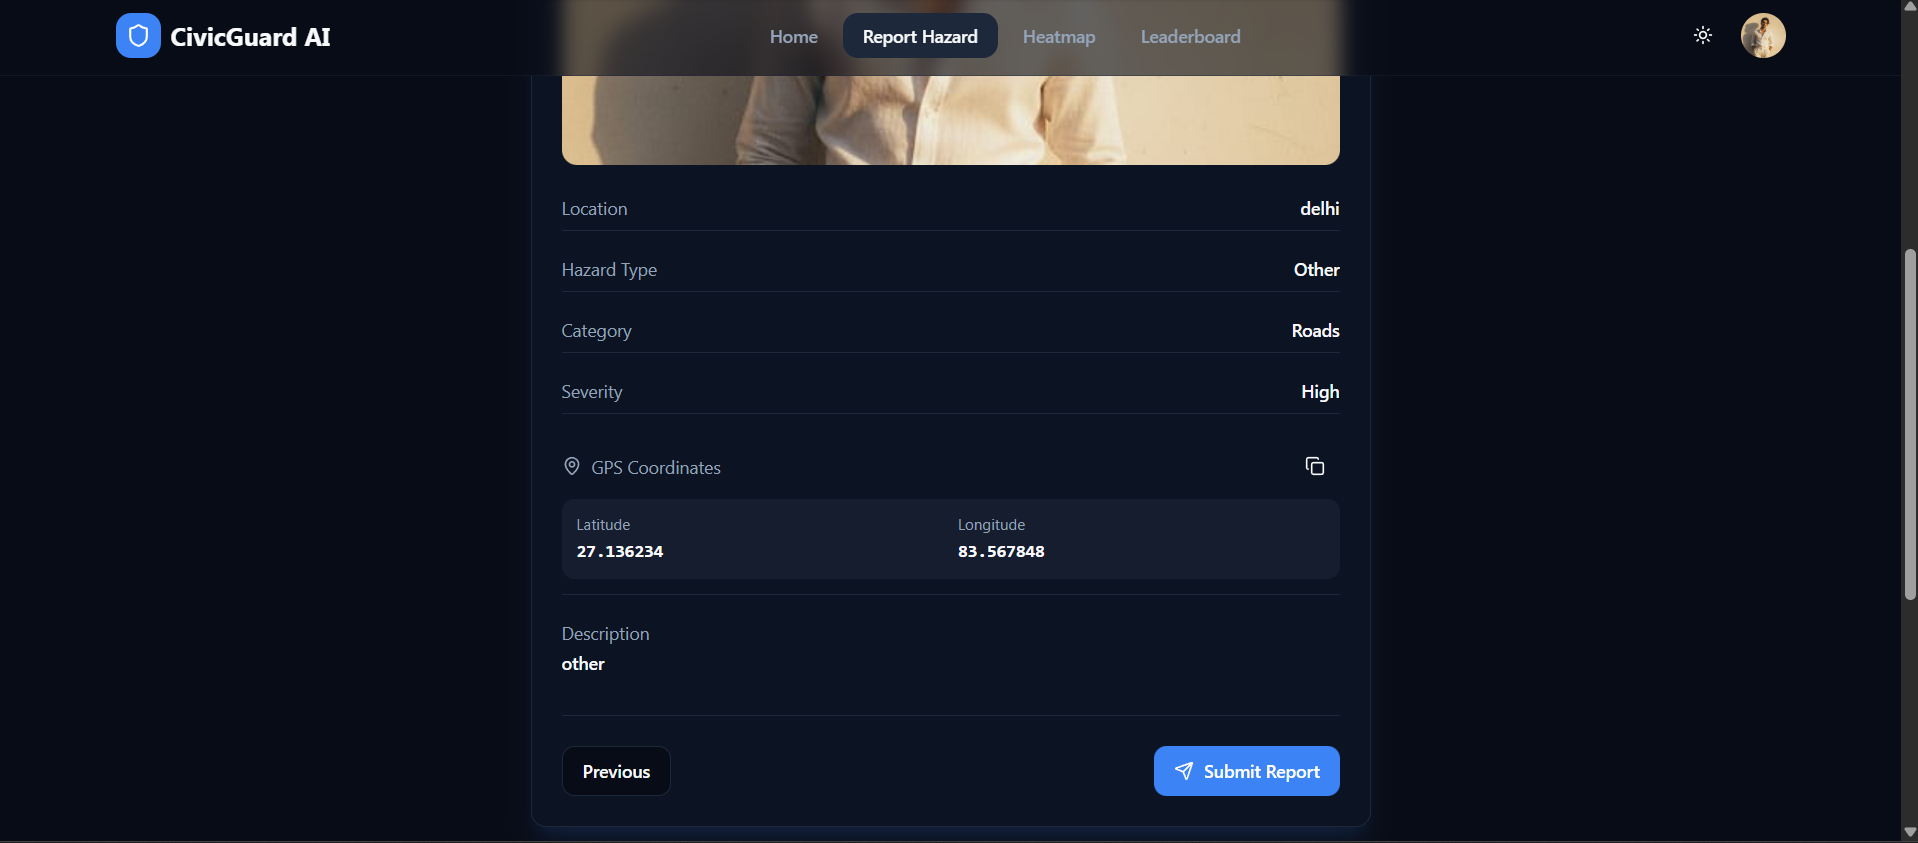
giving the details of the report to be generated
-

reviewing the automatically generated report that will be submitted
-
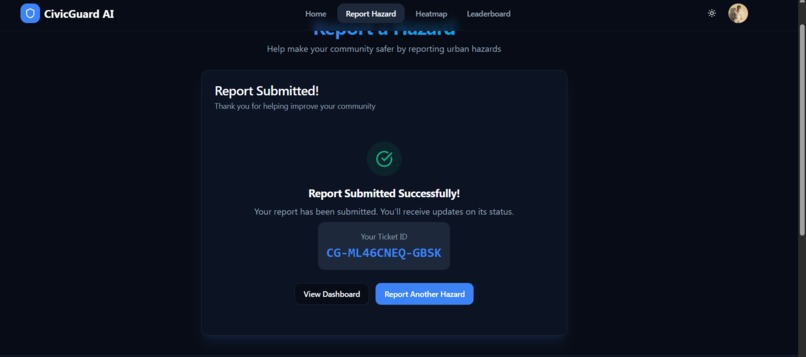
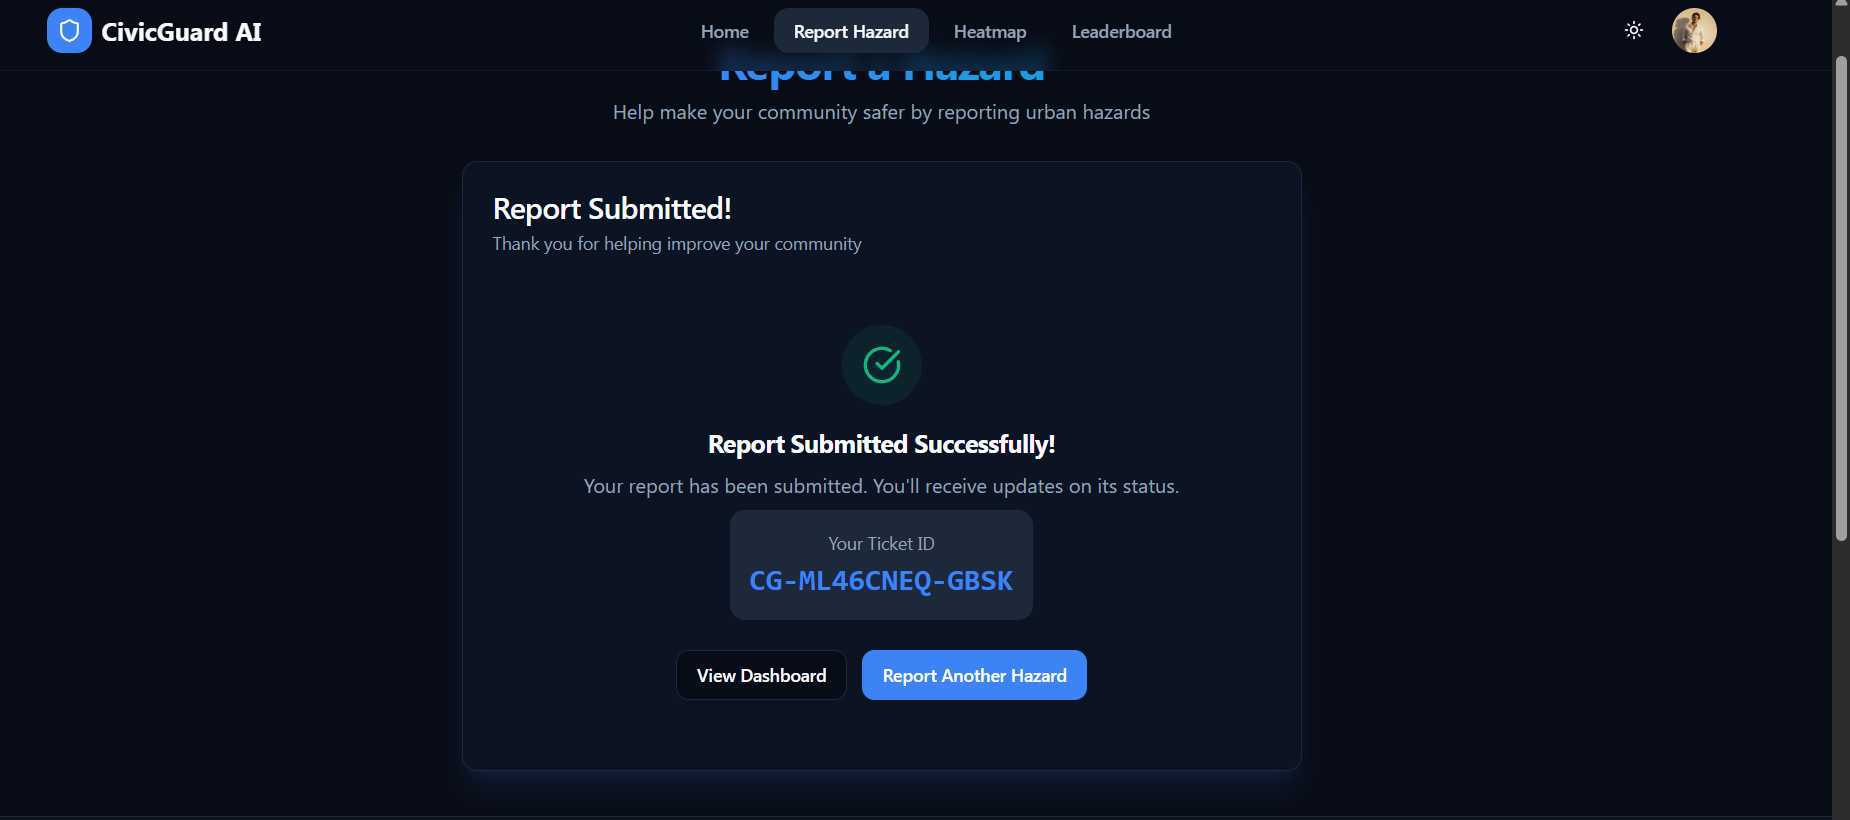
report submitted and unique token generated that can be accessed later for the user
-
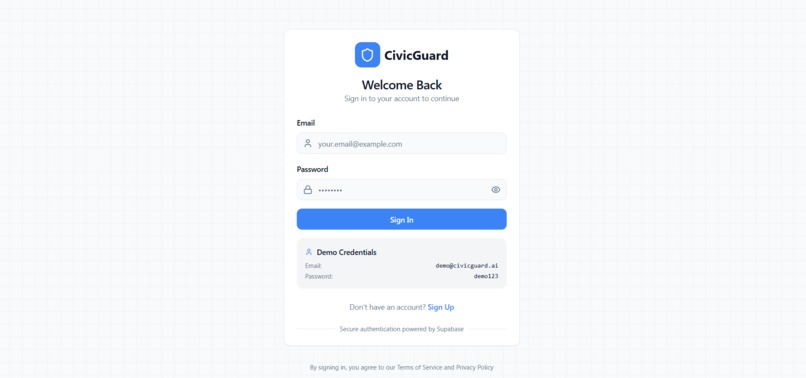
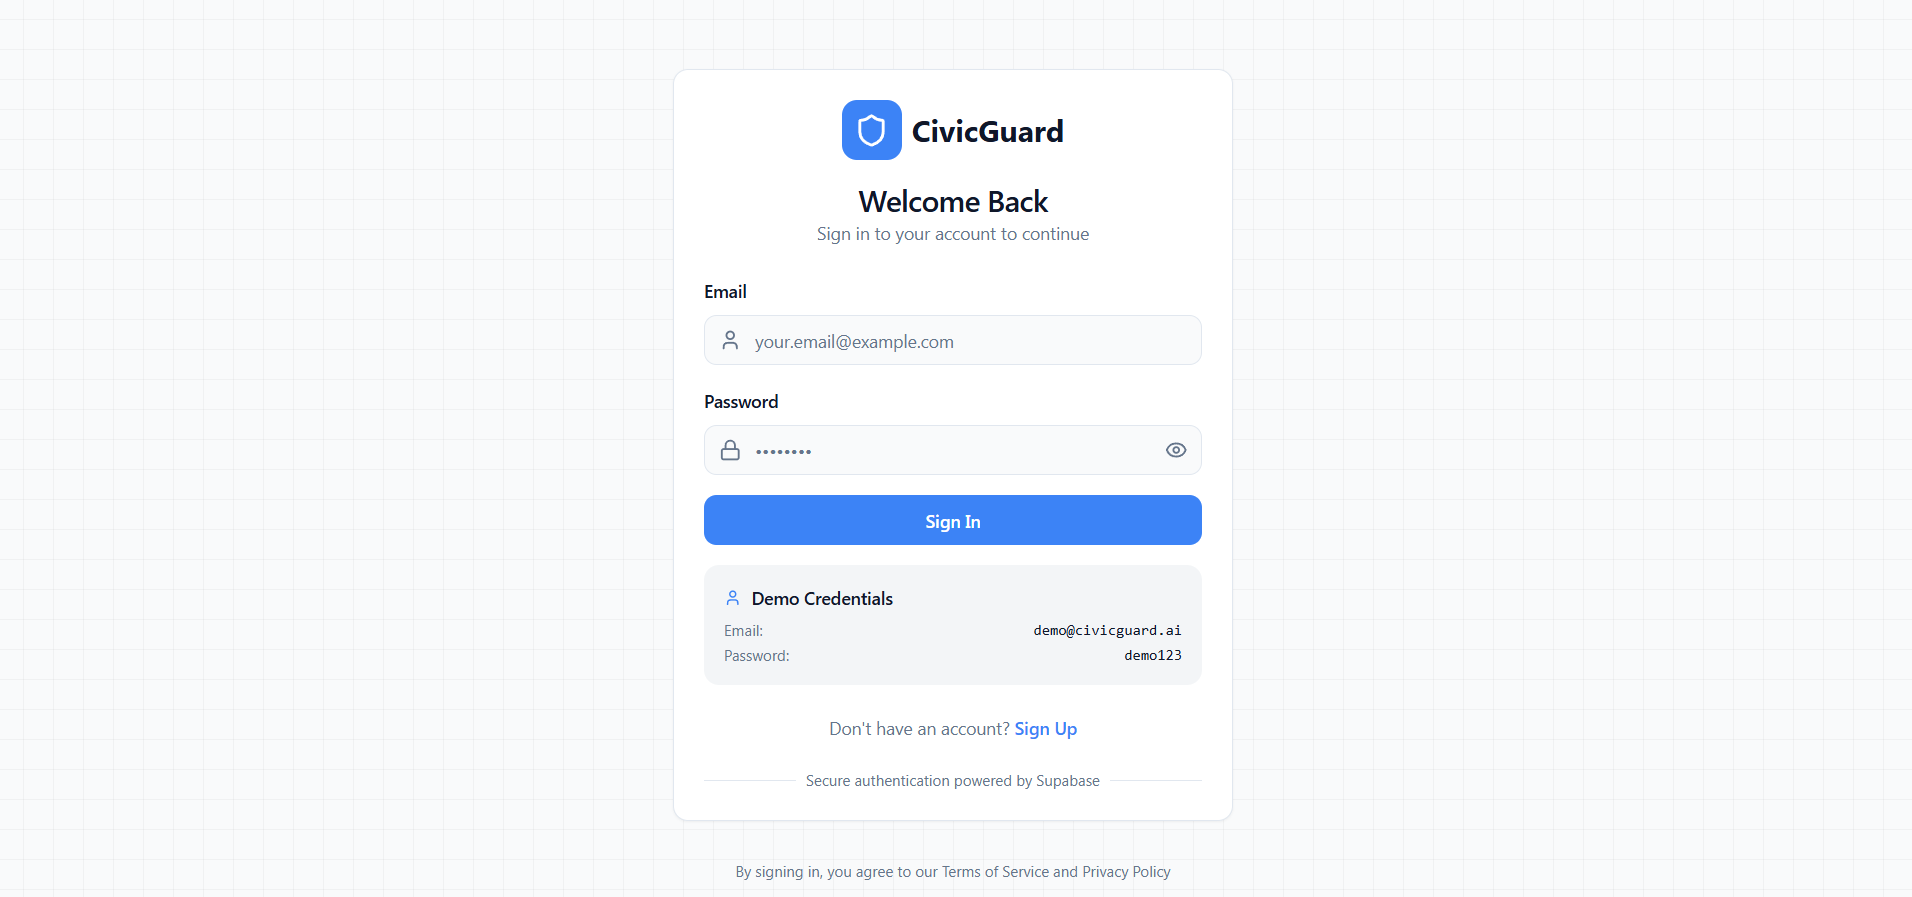
login page to save the user data in the backend

The Spark: "Someone Else Will Fix It" We’ve all done it: walked past a broken streetlight or driven over a pothole and thought, "Surely the city knows about this." But usually, they don't. The "Bystander Effect" leaves our cities in disrepair because reporting issues feels like shouting into a void—slow, bureaucratic, and opaque.
We built CivicGuard AI to break that silence. We wanted to turn urban maintenance into a multiplayer experience, making civic duty as instant and satisfying as dropping a pin on a game map.
What It Is Think of it as "Waze for Infrastructure." CivicGuard AI is a real-time, community-driven platform that connects citizens to their cities.
Snap & Solve: Spot a hazard, snap a photo, and the app auto-tags the location.
The Heatmap: We visualize neglect. A broken road isn't just a list item; it’s a glowing red zone on our live map.
Gamification: We replaced bureaucracy with dopamine. Users earn XP and climb the leaderboard for making their neighborhoods safer.
Under the Hood (The Stack) We didn't just want a form; we wanted a living, breathing application.
The Speed: Built on React 18 and Vite for instant load times, styled with Tailwind and Shadcn/UI for accessibility.
The Brains: We used Supabase as our backend-superpower. It handles our PostgreSQL database and—crucially—provides the Real-time Subscriptions that make our map come alive instantly.
The Map: Leaflet handles the heavy lifting of rendering complex geospatial data without lagging the browser.
Type Safety: The entire codebase is strict TypeScript. If it compiles, it works.
The "Hair-Pulling" Challenges Building a map app sounds simple until you actually do it.
The "Real-Time" Trap: Syncing a heatmap across multiple users without crashing the browser was tough. We had to fine-tune our Supabase listeners to update the map smoothly, not chaotically.
Geolocation is Messy: We learned that GPS drifts. We had to build a "drag-to-confirm" UI because a reported pothole in the middle of a lake isn't very helpful.
Schema vs. Flexibility: Designing a database that treats a "Streetlight" and a "Pothole" differently while keeping the map queries fast required several architectural rewrites.
The "It Works!" Moment The proudest moment wasn't finishing the UI—it was the first time we tested it on two different devices. One team member reported a hazard, and instantly, a red pin dropped on the other team member’s screen. No refresh button needed. That’s when we knew we had something real.
What’s Next? We built the tool for citizens; next, we build the brain.
Short Term: Integrating Computer Vision so you don't even have to type "Pothole"—the AI just sees it.
Long Term: A Municipal Dashboard for city officials to assign crews based on our heatmap data, closing the loop between report and repair.
Built With
- api
- css
- deployment
- framer
- git
- github
- leaflet.js
- lucide
- maps
- postgresql
- react
- react-leaflet
- rls
- shadcn/ui
- tailwind
- tanstack
- typescript
- vercel
- vite


Log in or sign up for Devpost to join the conversation.