-
-
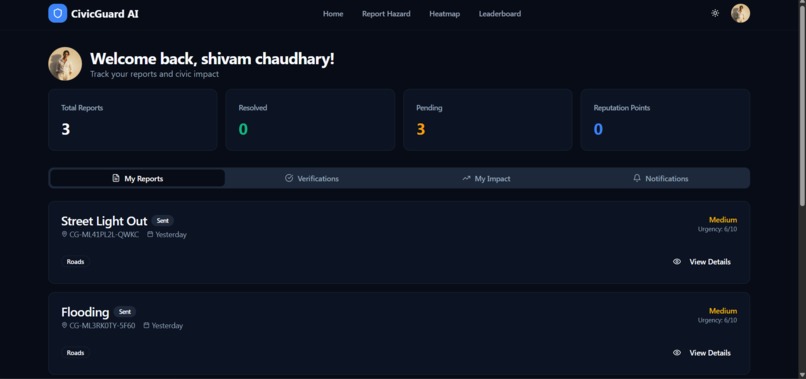
user interface
-

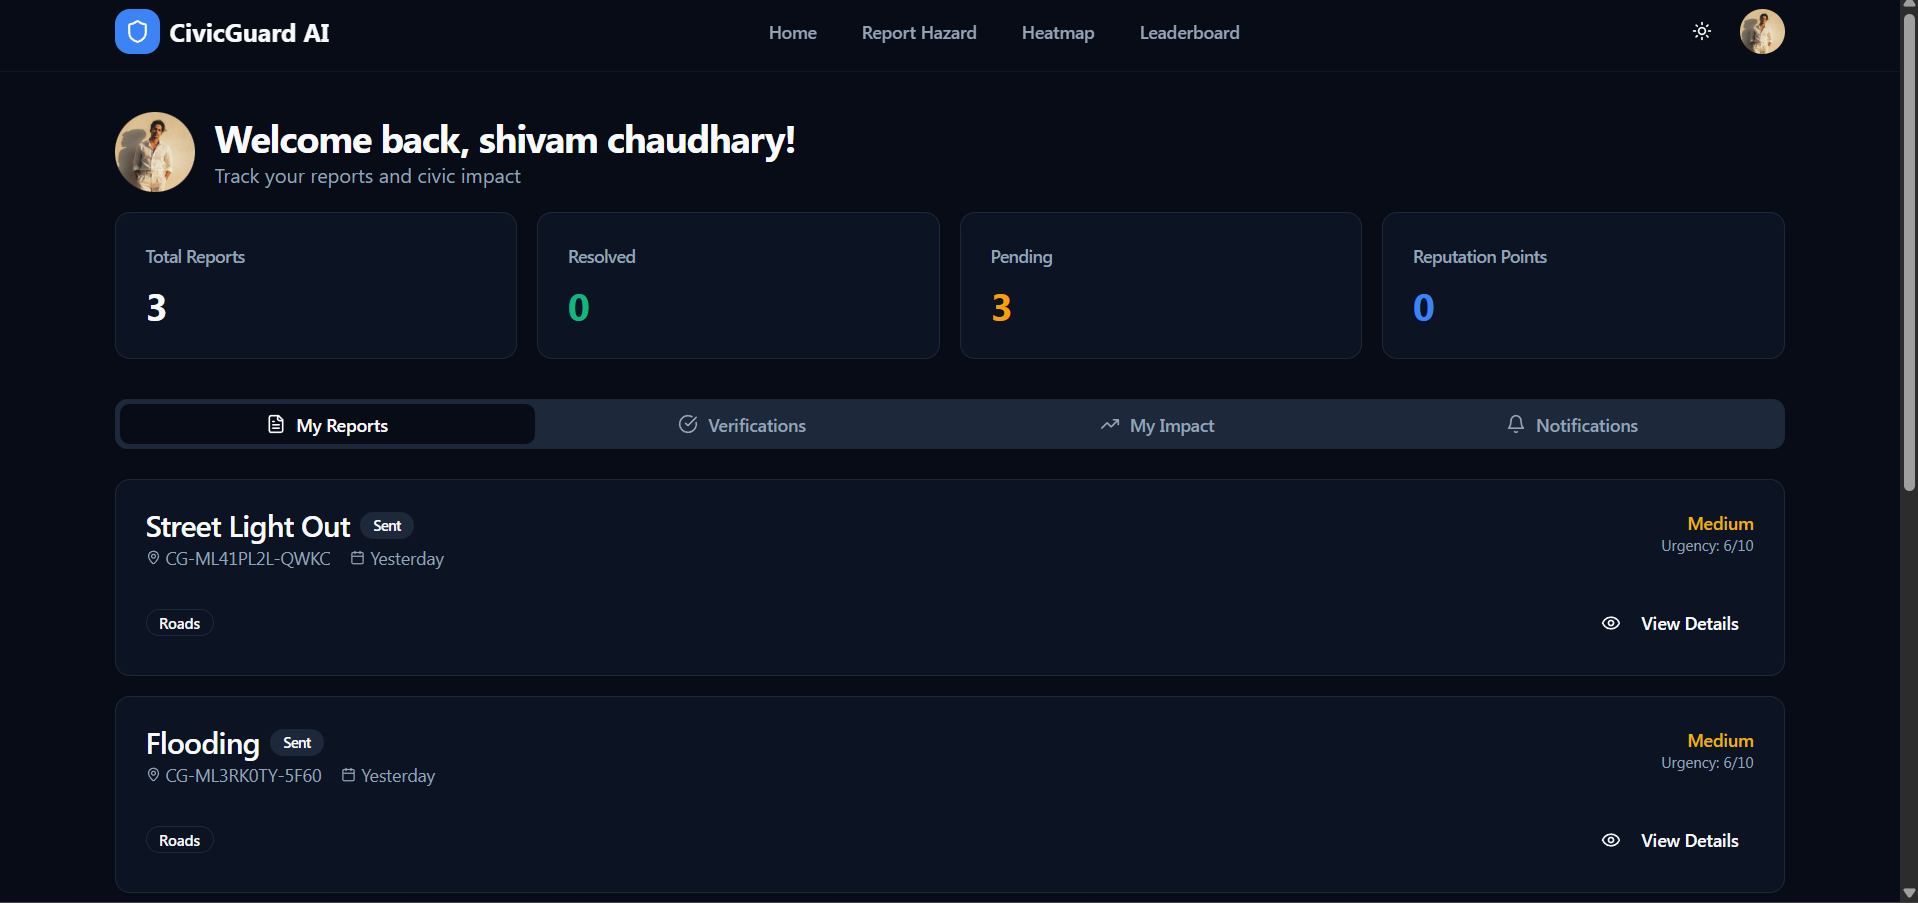
home page
-
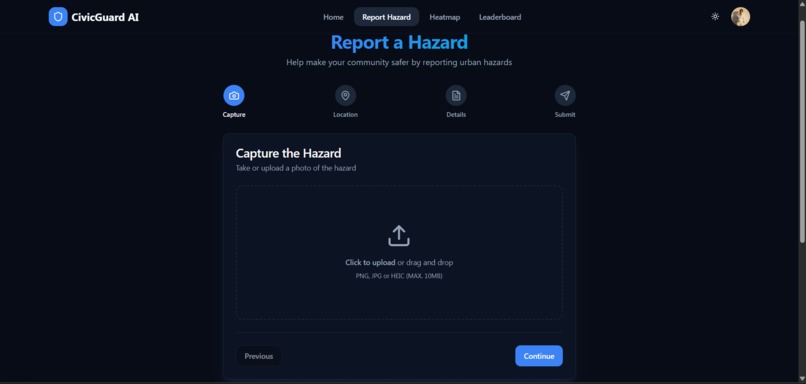
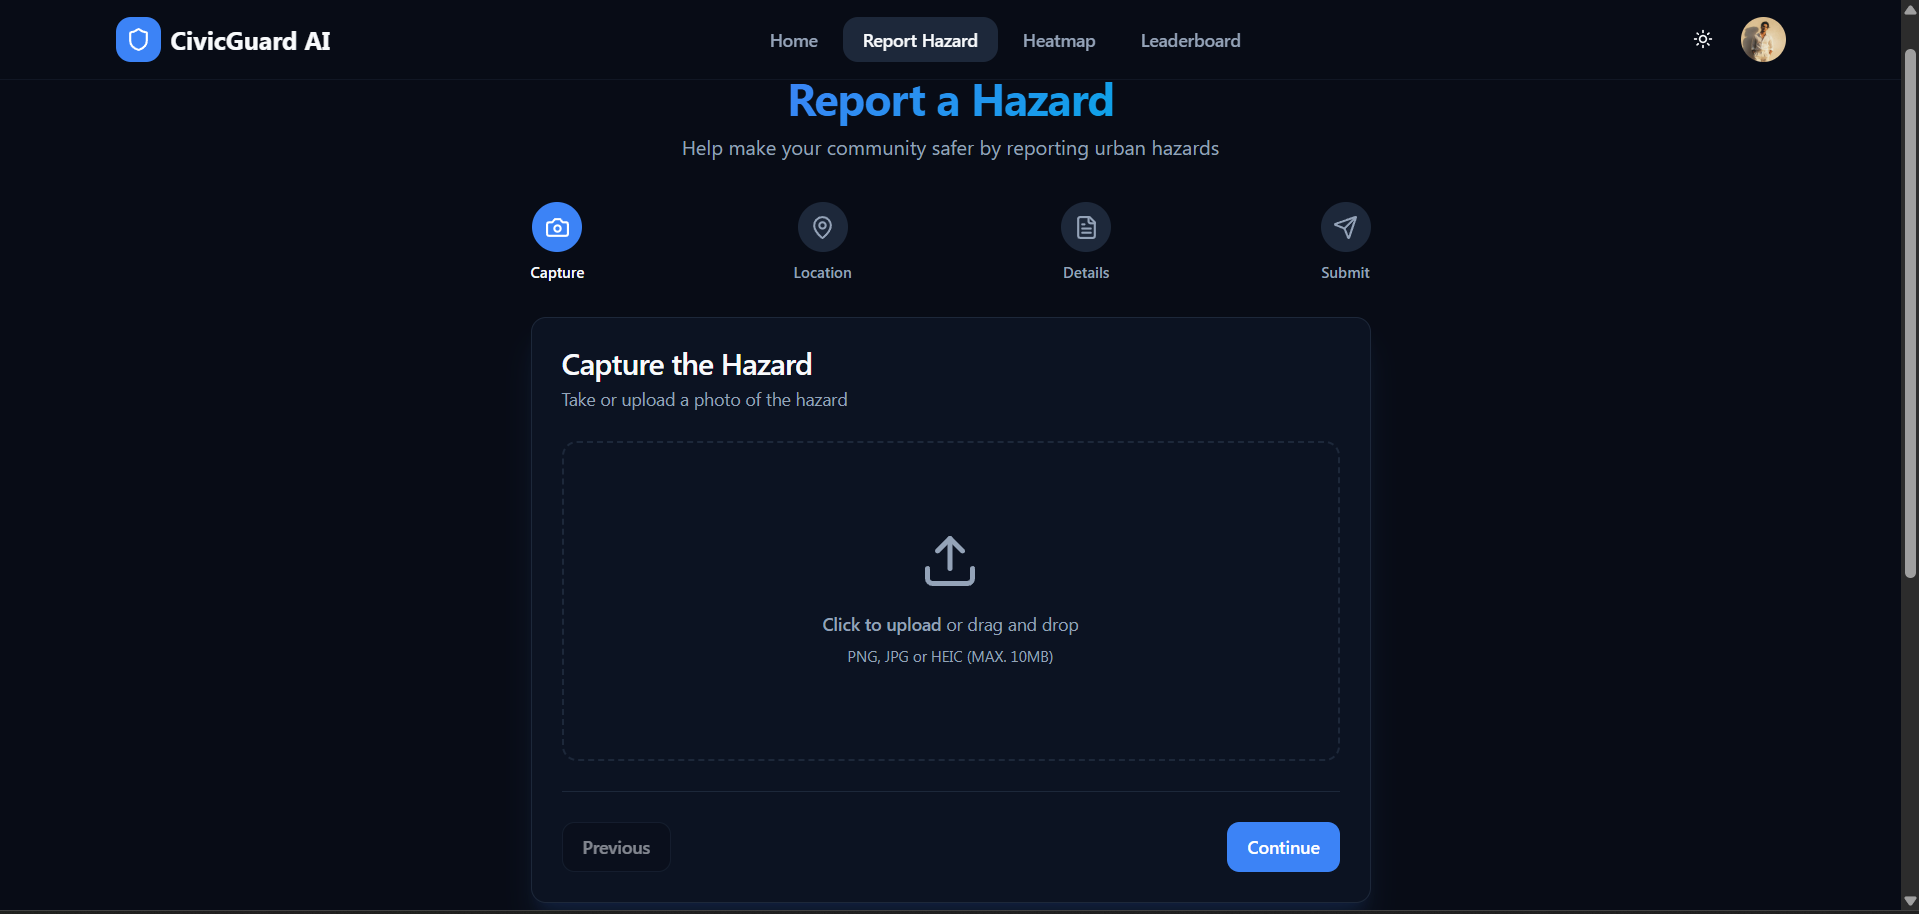
report hazard
-
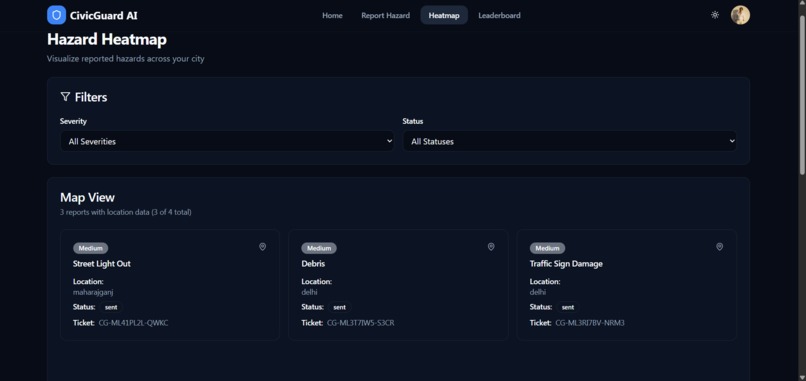
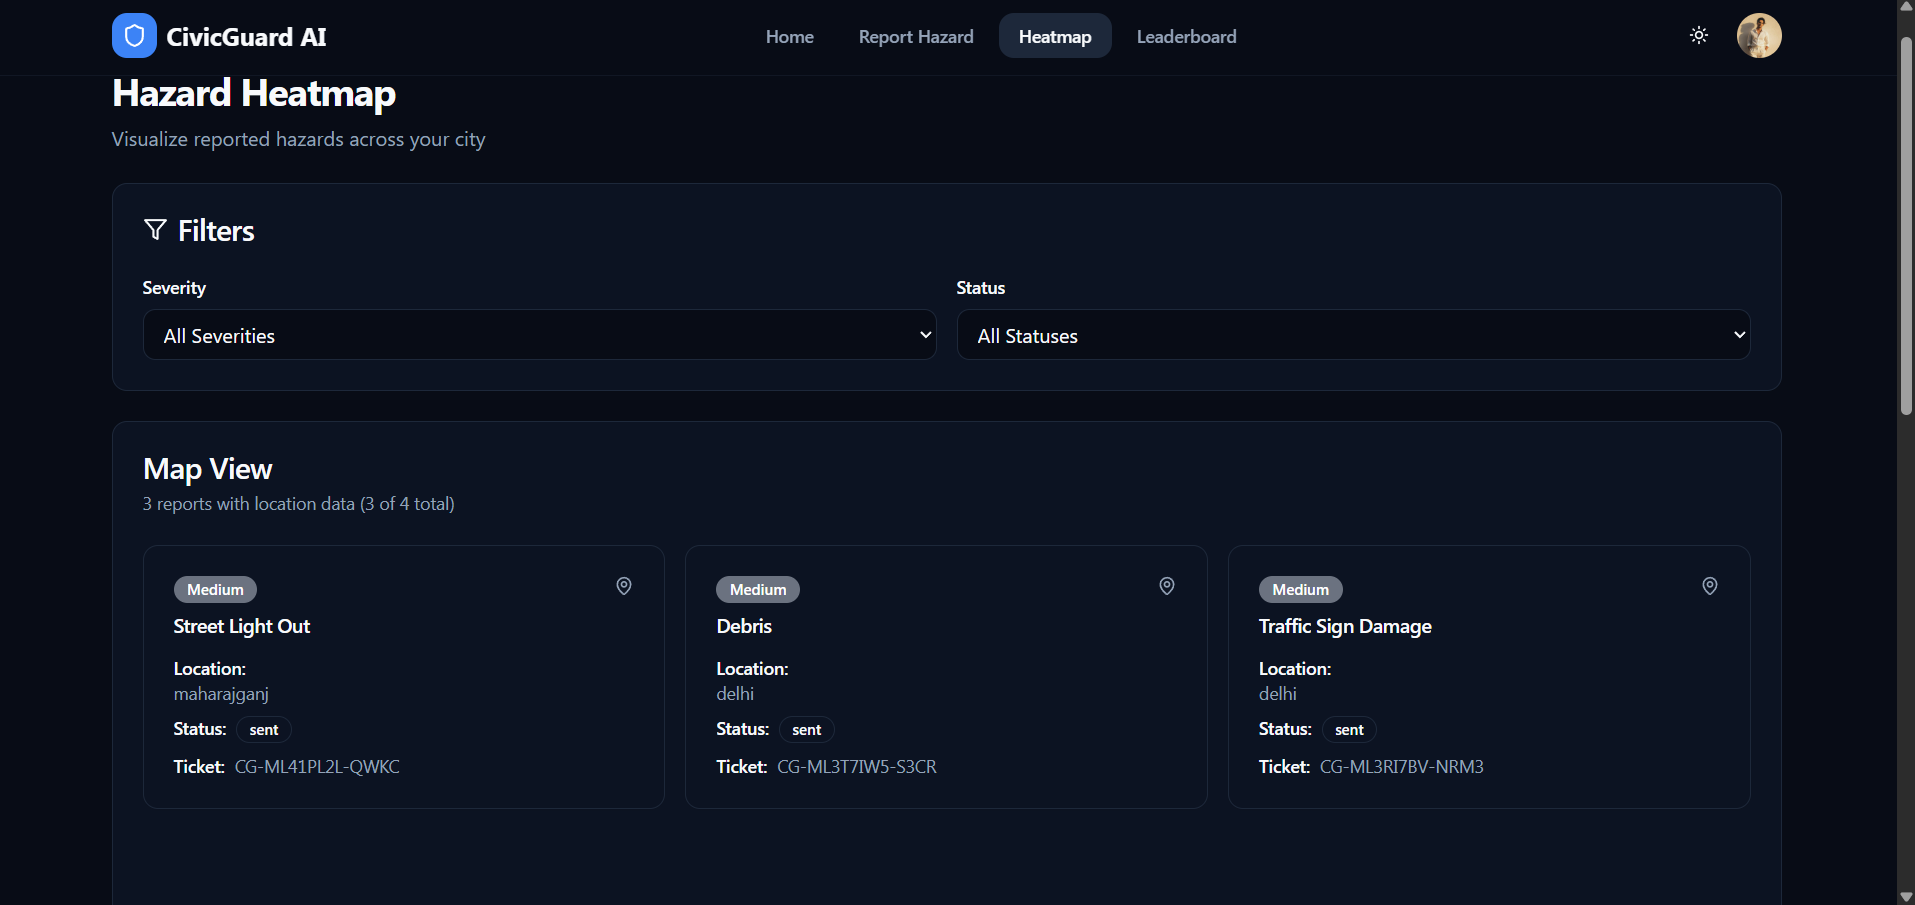
heatmap
-

different modes
-

achievement and contributors
-
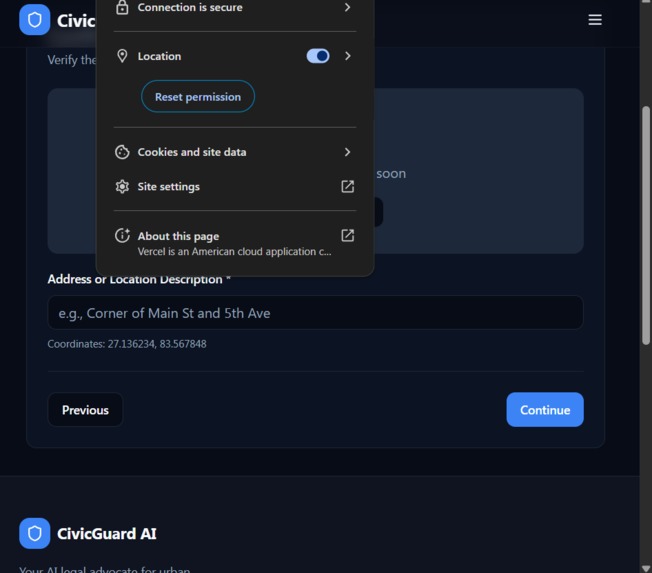
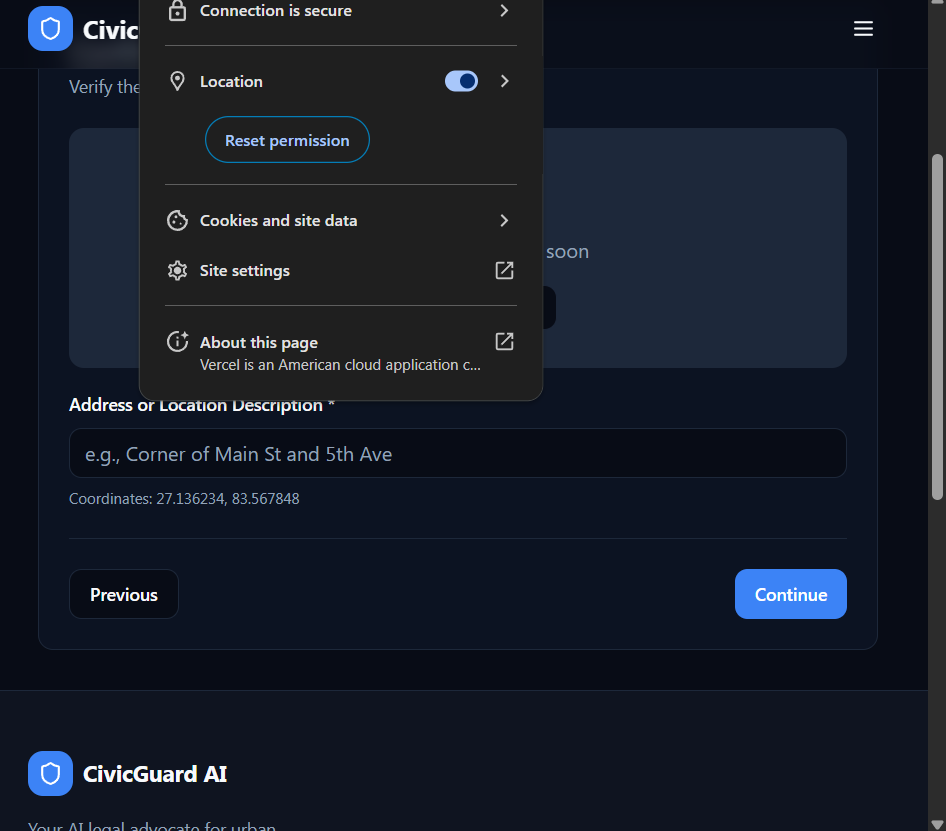
location access and coordinate determination in real time
-
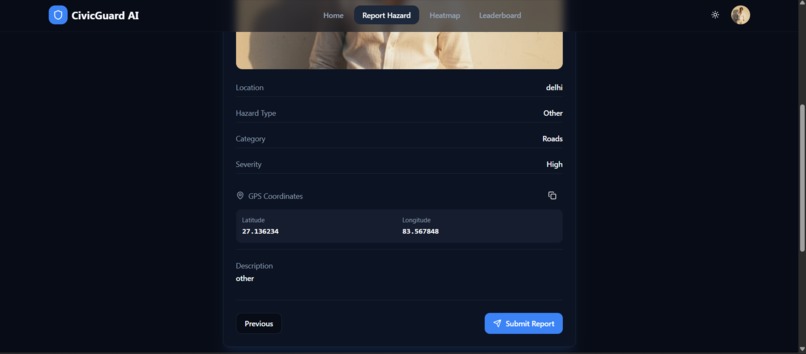
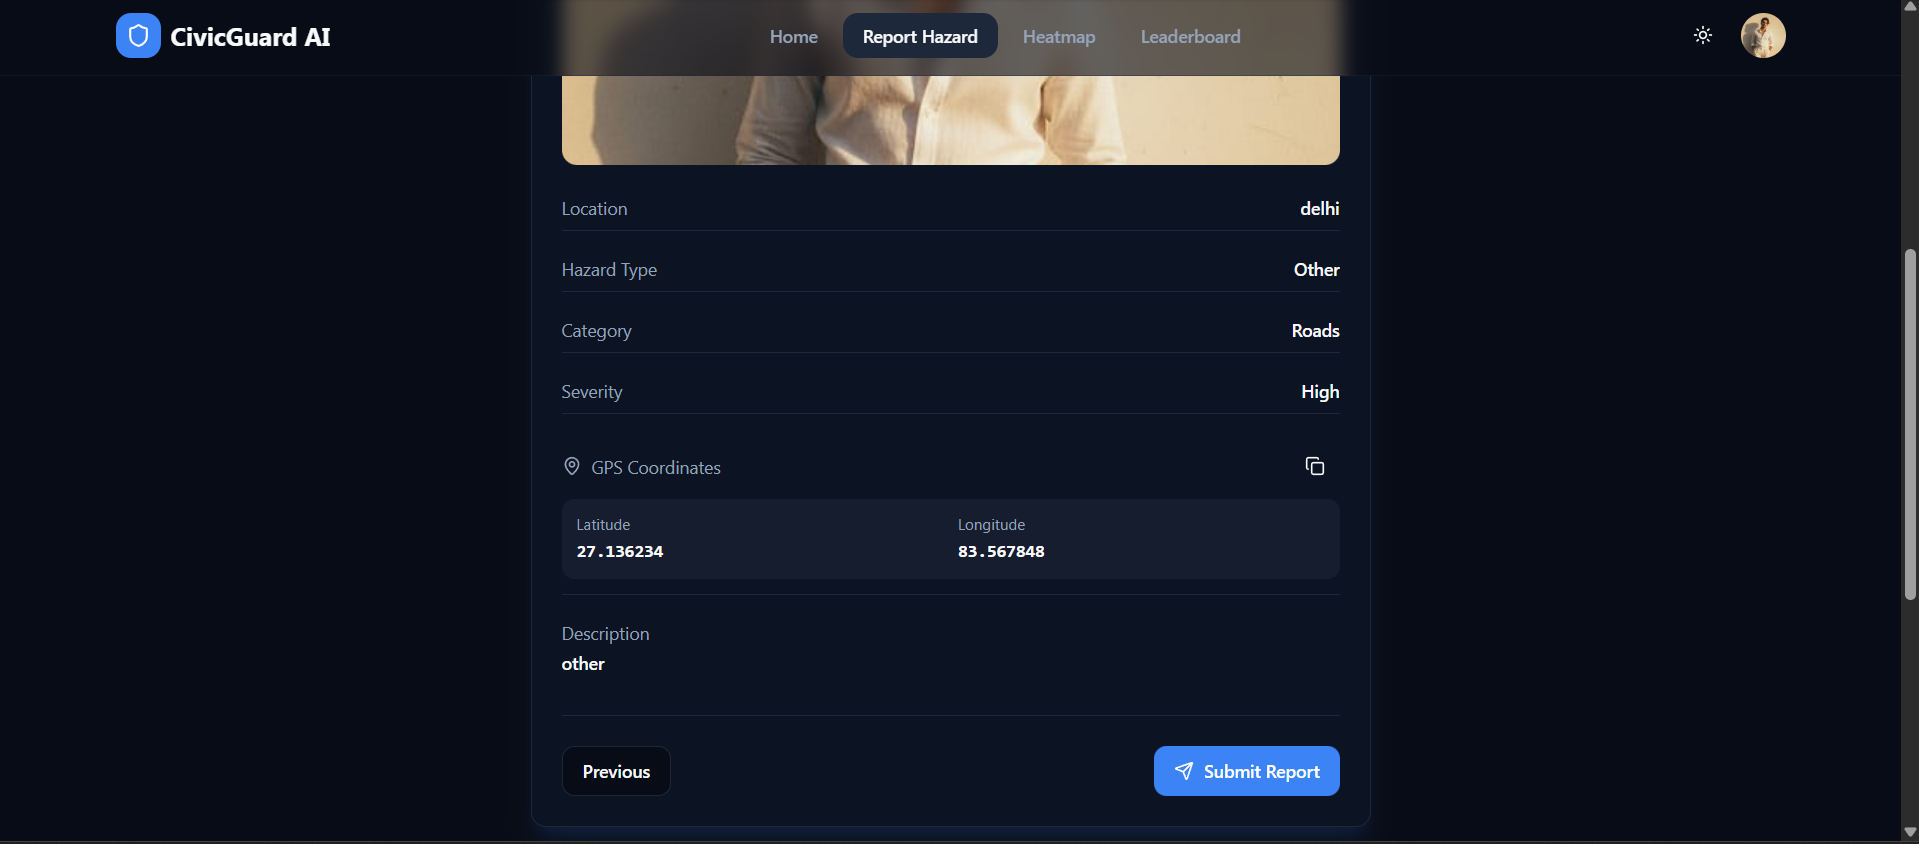
reporting the hazard



Inspiration
We’ve all experienced the "Bystander Effect" of urban decay. You drive past the same deep pothole or walk under a broken streetlight for weeks, thinking, "Surely the city knows about this by now." But often, they don't. The current reporting process is high-friction: finding the right municipal website, navigating a clunky UI, and filling out a long form—usually to never hear back.We realized that to solve infrastructure neglect, we needed to reduce the friction coefficient ($\mu$) of civic engagement to near zero. We wanted to build a platform where reporting a hazard is as instant and satisfying as dropping a pin in a game.
What it does
CivicGuard AI is a real-time, community-driven platform that bridges the gap between citizens and municipalities.📍 Snap & Solve: Users spot a hazard, snap a photo, and the app automatically captures the precise geolocation coordinates $(x, y)$.🔥 Real-Time Heatmap: We visualize neglect. Instead of a boring list, we render a dynamic heatmap where clusters of reports glow red, helping prioritize high-severity zones.🎮 Gamified Citizenship: We replaced bureaucracy with dopamine. Users earn XP and climb a global Leaderboard for verified reports, turning civic duty into a multiplayer experience.🔄 Transparency Loop: Users track the lifecycle of their report from Pending, In Progress ,Resolved, closing the feedback loop that traditional systems lack.
How we built it
We architected CivicGuard AI as a high-performance Single Page Application (SPA) to ensure responsiveness on mobile devices, where most reports happen.
The Frontend (The Speed) Core: Built with React 18 and Vite for blazing-fast load times.
Type Safety: The entire codebase is strict TypeScript, ensuring type safety across our component tree.
Mapping: We utilized Leaflet and React-Leaflet to handle complex geospatial rendering without lagging the browser.
State Management: We used TanStack Query to handle server state, caching report data to minimize network requests.
UI/UX: Tailwind CSS and Shadcn/UI allowed us to build an accessible, dark-mode-ready interface rapidly.
backend : We leveraged Supabase as a Backend-as-a-Service (BaaS) to handle the heavy lifting:Database: A PostgreSQL database stores user reports, implementing PostGIS concepts for spatial queries.Real-Time: We subscribed to database changes via websockets. When User A reports a pothole at time $t$, User B’s map updates at $t + \delta$ (where $\delta < 200ms$).Security: We implemented strict Row Level Security (RLS) policies. For example:$$\text{auth.uid()} = \text{user_id}$$This ensures users can only edit or delete their own reports while still being able to view public data.
Challenges we ran into
The "Real-Time" Chaos: Syncing the heatmap across multiple clients without crashing the browser was non-trivial. Initially, every database insert triggered a re-fetch of the entire dataset. We optimized this by listening only for new INSERT events and appending them to the local state, reducing the time complexity of updates from $O(N)$ to $O(1)$.Geolocation Drift: We learned that GPS accuracy varies wildly ($\pm 20m$ on some devices). To fix this, we implemented a "Drag to Confirm" UI feature, allowing users to fine-tune the marker position manually before submission.Database Schema vs. Flexibility: Designing a schema that could distinctively categorize hazards (e.g., pothole vs streetlight) while keeping the heatmap queries efficient required several iterations of normalization.
Accomplishments that we're proud of
Solo Full-Stack Delivery: Successfully architecting and deploying a production-ready application with Authentication, Storage, and Database logic entirely from scratch.
Latency Minimization: Achieving a near-instant sync between devices. Seeing a pin drop on a mobile phone and appear on a laptop screen simultaneously was a "magic moment."
Gamification Logic: Implementing a robust XP system that calculates user rank based on the impact and frequency of their reports.
What we learned
The Power of BaaS: We learned how to leverage Supabase to ship features that typically take weeks (like Auth and Vector Storage) in mere hours.
Geospatial Complexity: We gained a deep appreciation for the mathematics of mapping—projections, coordinate systems, and tile layers.
User Psychology: We learned that feedback is the primary driver of engagement. Users don't mind doing the work (reporting) if they get the reward (seeing the status change to "Resolved").
What's next for CivicGuard AI
Municipal Dashboard: A specialized admin view for city officials to assign work crews based on heatmap density clusters, optimizing routing paths.
Predictive Maintenance: Using historical data to predict infrastructure failure before it happens (e.g., predicting that a streetlamp sector is nearing its end-of-life).
Built With
- css
- git
- github
- html
- leaflet.js
- lucide
- postgresql
- react
- shadcn/ui
- supabase
- tailwind
- typescript
- vercel

Log in or sign up for Devpost to join the conversation.