CivicTrace
Inspiration
Phoenix is one of the fastest-growing cities in America and one of the hottest. With temperatures regularly exceeding 110°F and a built environment that spans thousands of civic, commercial, and residential buildings, the city faces an urgent and growing carbon problem.
But when we started asking questions which buildings are the biggest emitters? Where is solar ROI highest? What materials are being locked into buildings currently under construction? we couldn't find the answers anywhere. Environmental data was buried in PDF reports, scattered across government portals, or simply didn't exist at the building level.
We were inspired by a simple but powerful idea: what if every citizen could look at any building in their city and know exactly how green it is? Not a vague sustainability rating but real numbers. Real carbon. Real solar potential. Real air quality. And what if that data could be used to tell city leaders not just what the problem is, but exactly where to act first?
That's what CivicTrace was built to answer.
What It Does
CivicTrace is a real-time, building-level environmental intelligence platform for Phoenix, Arizona.
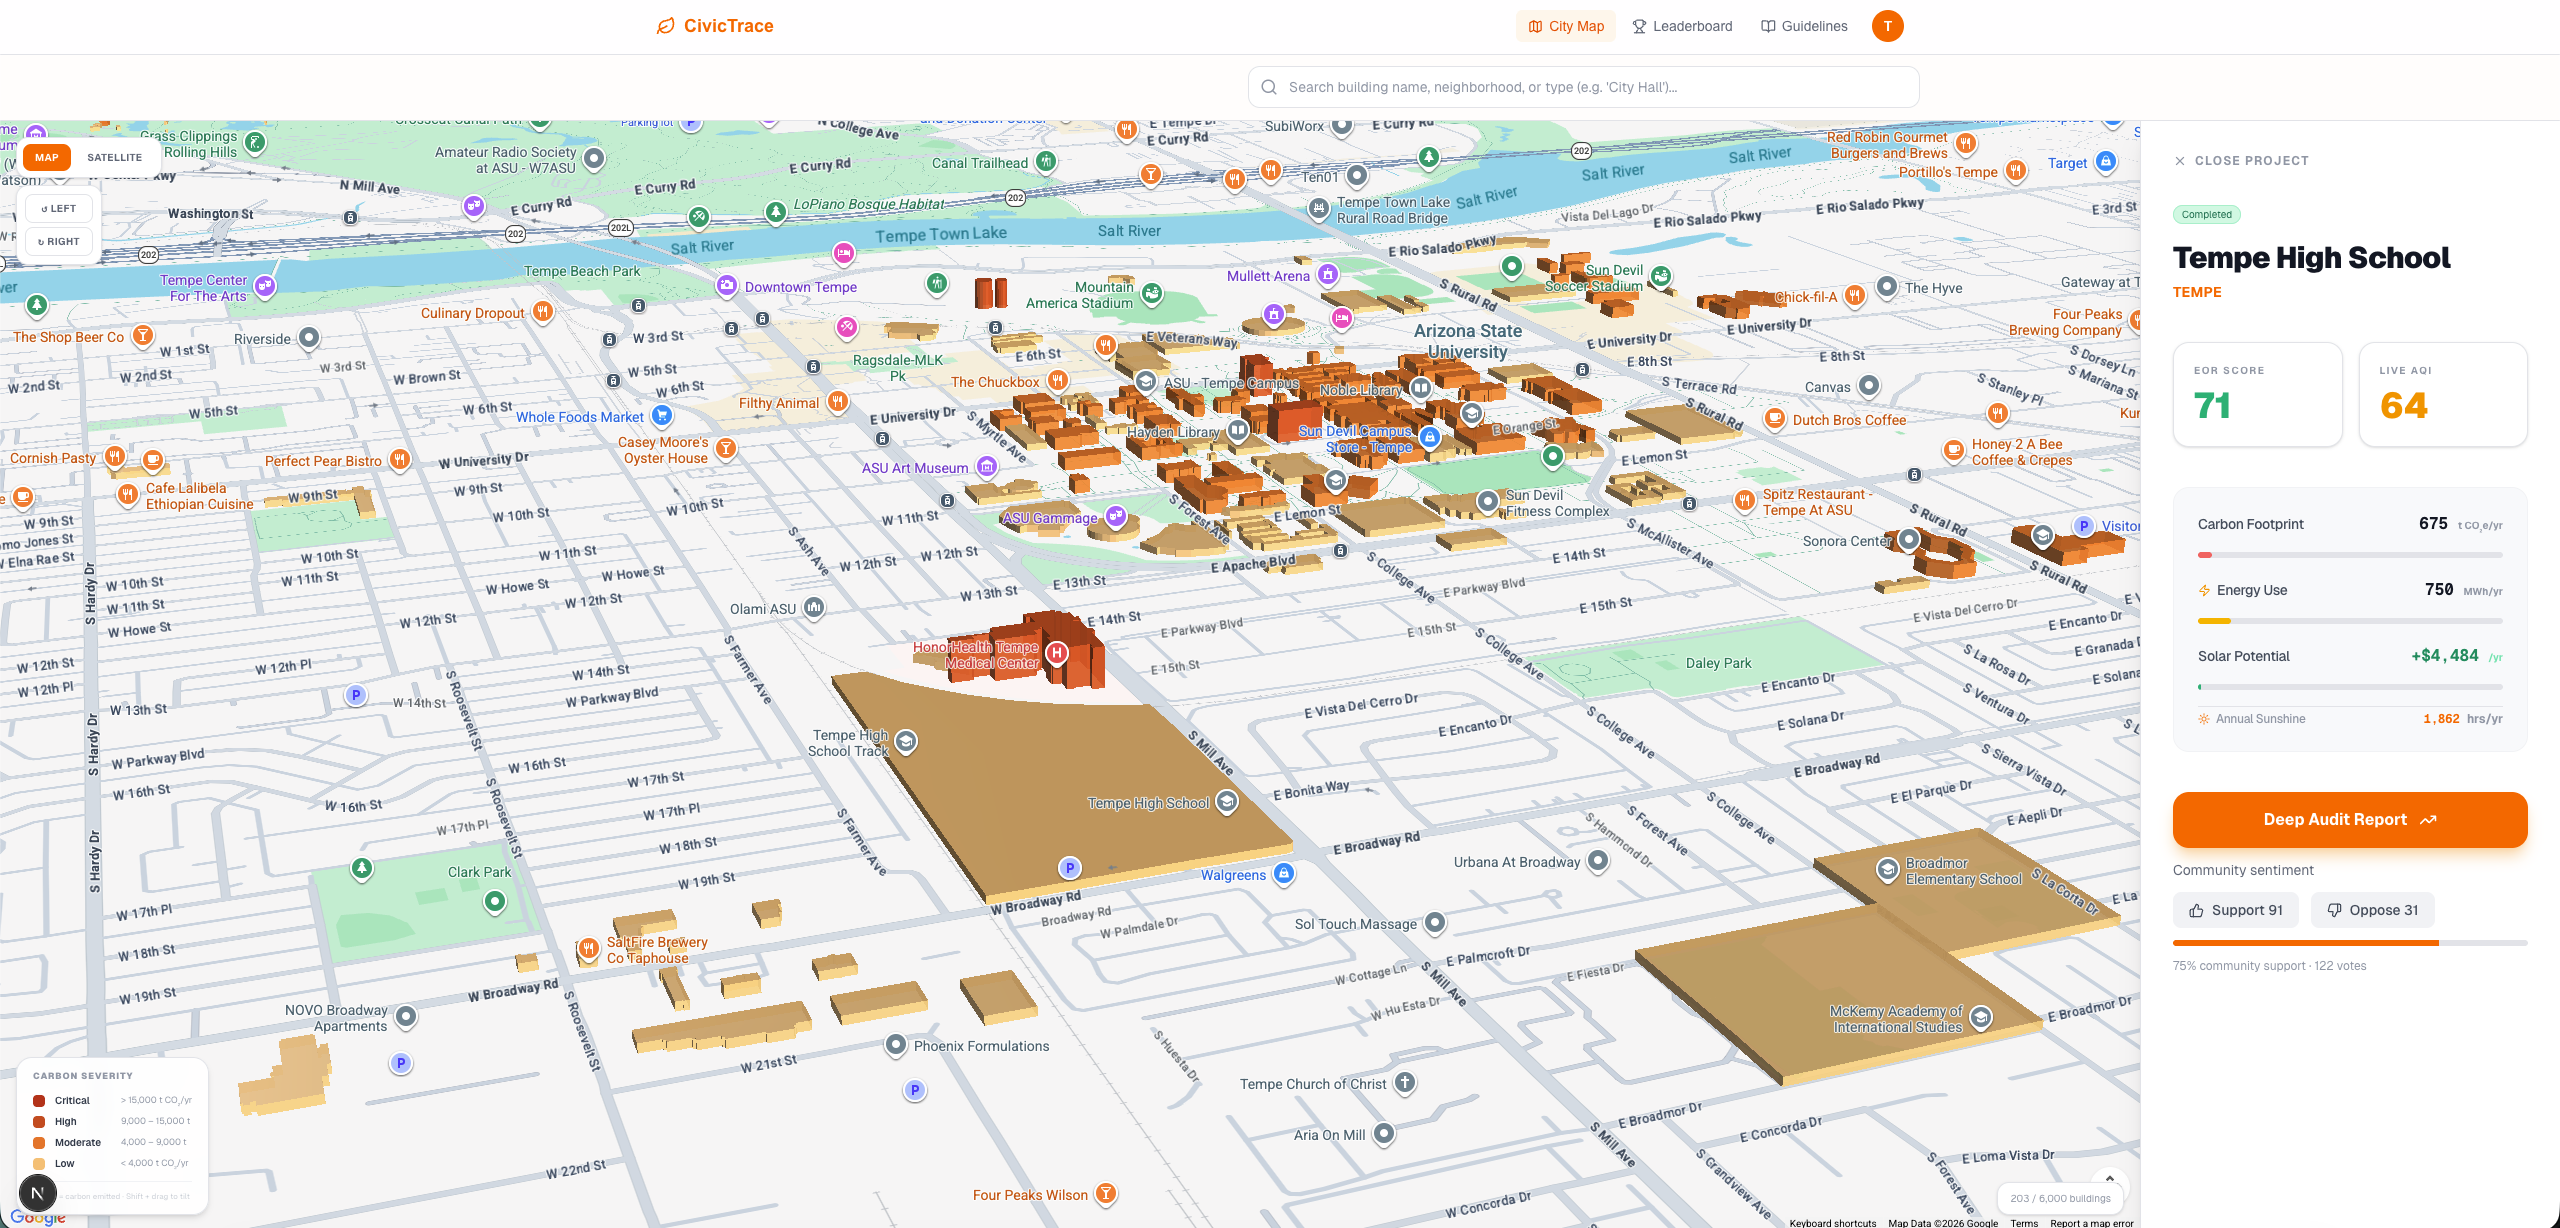
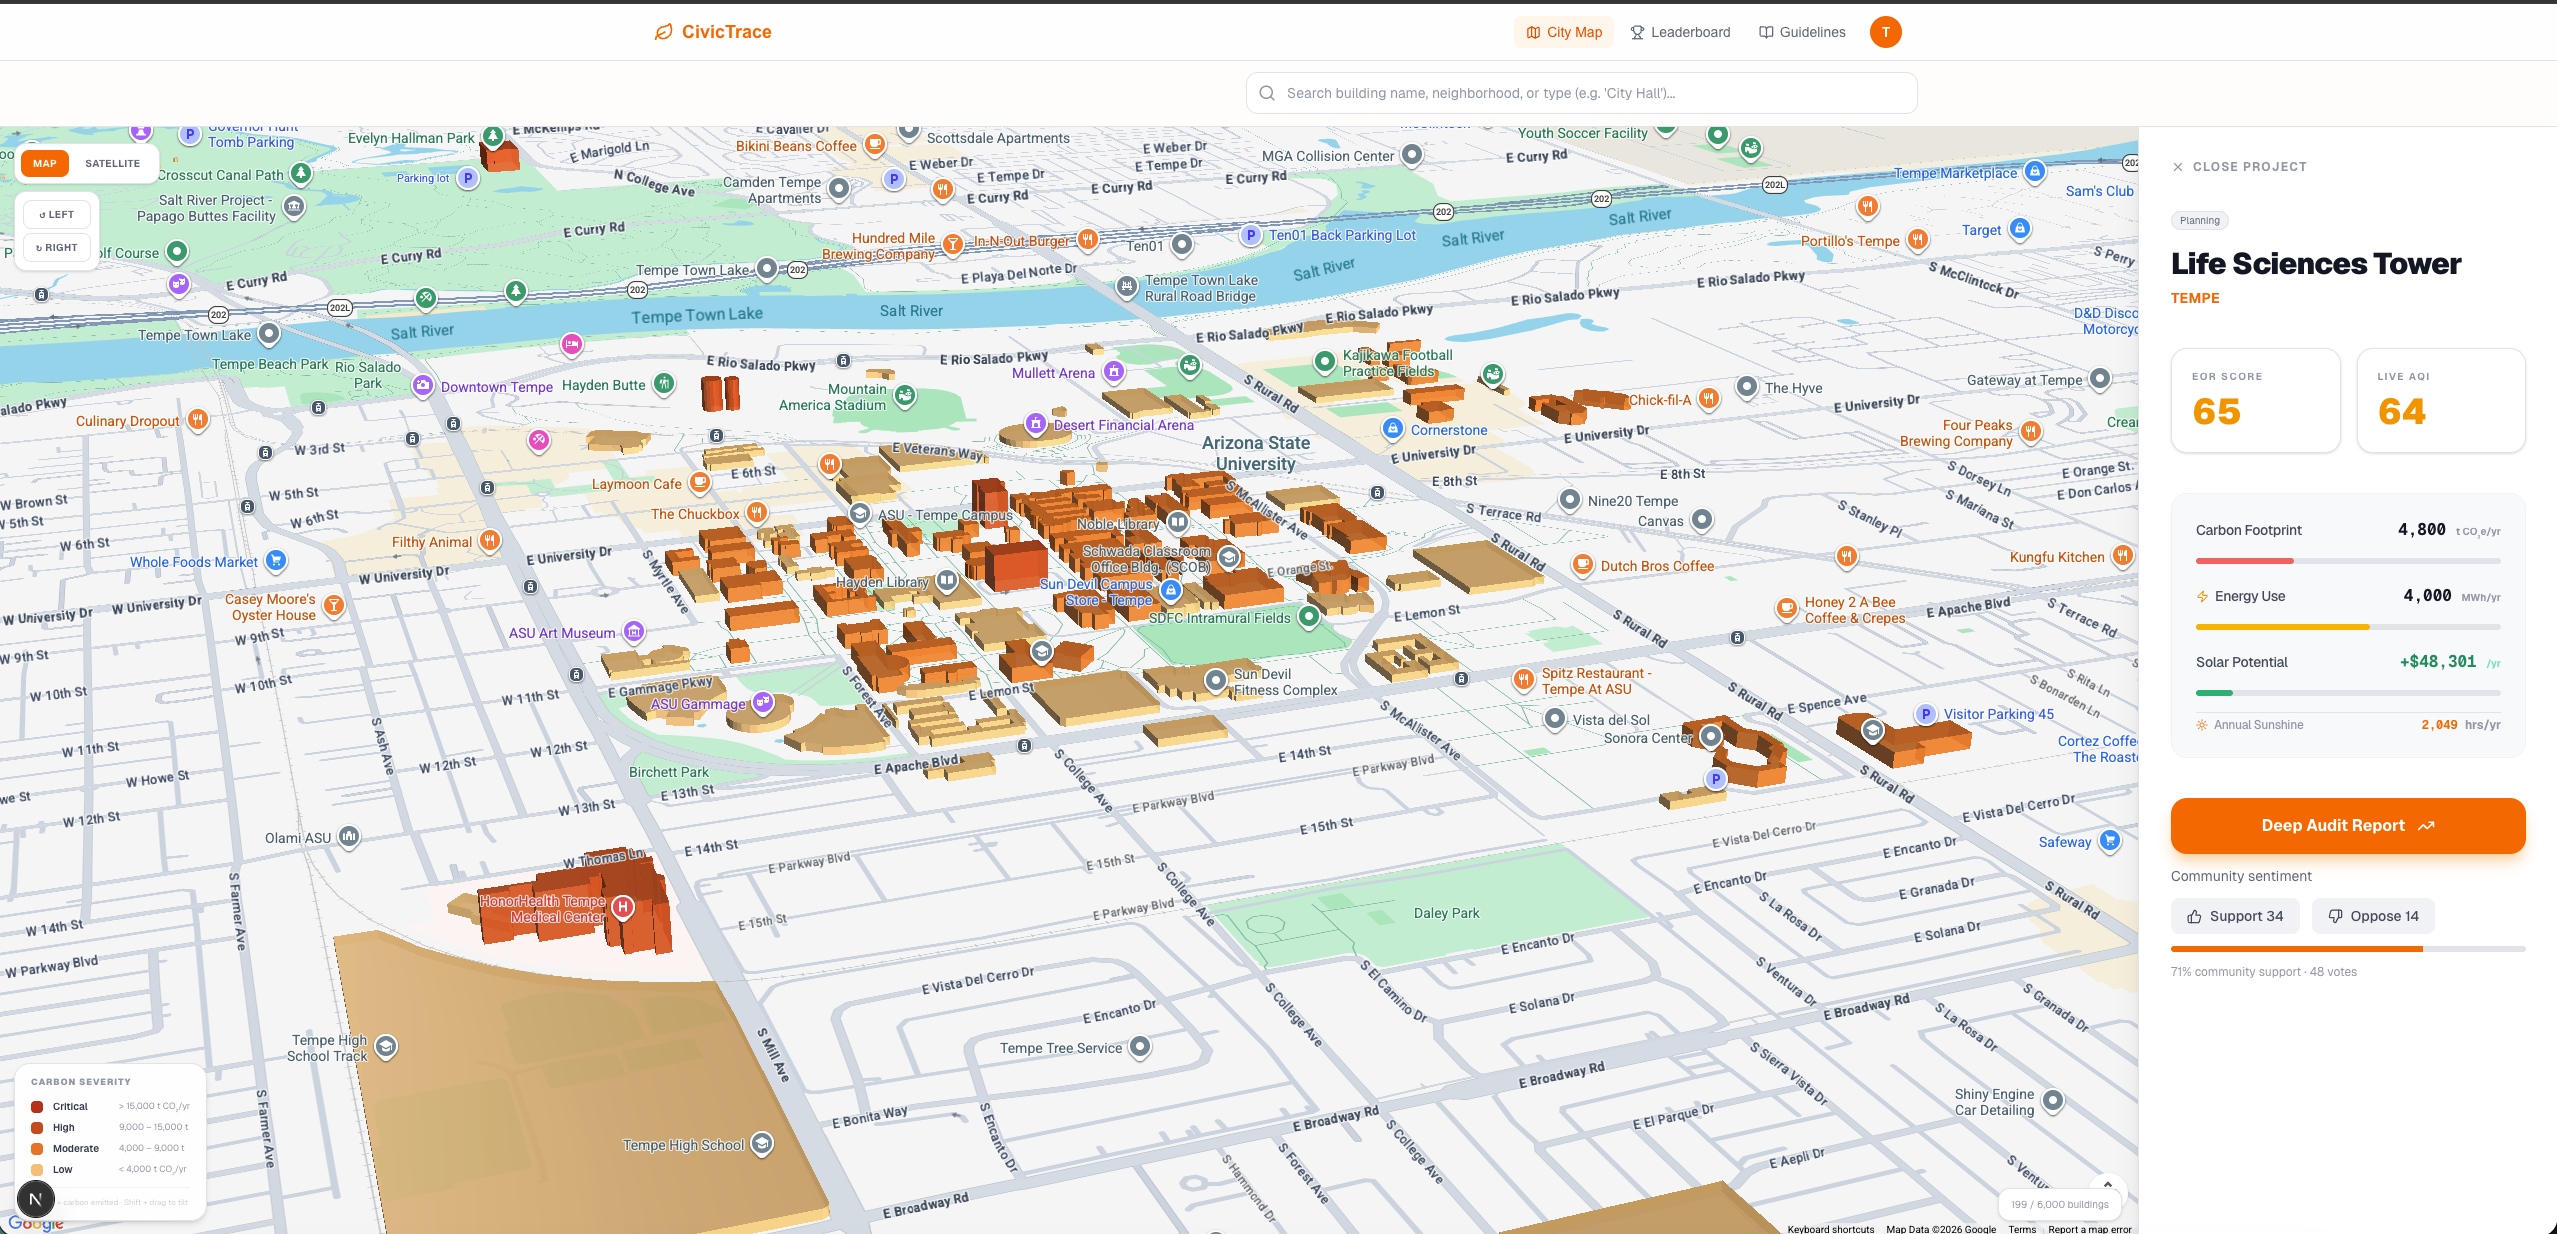
Interactive 3D Eco-Map Every major building in Phoenix is plotted on a live 3D Google Maps canvas, colour-coded by carbon severity from light amber (low emitter) to deep red (critical). Users can click any building to instantly surface its full environmental profile.
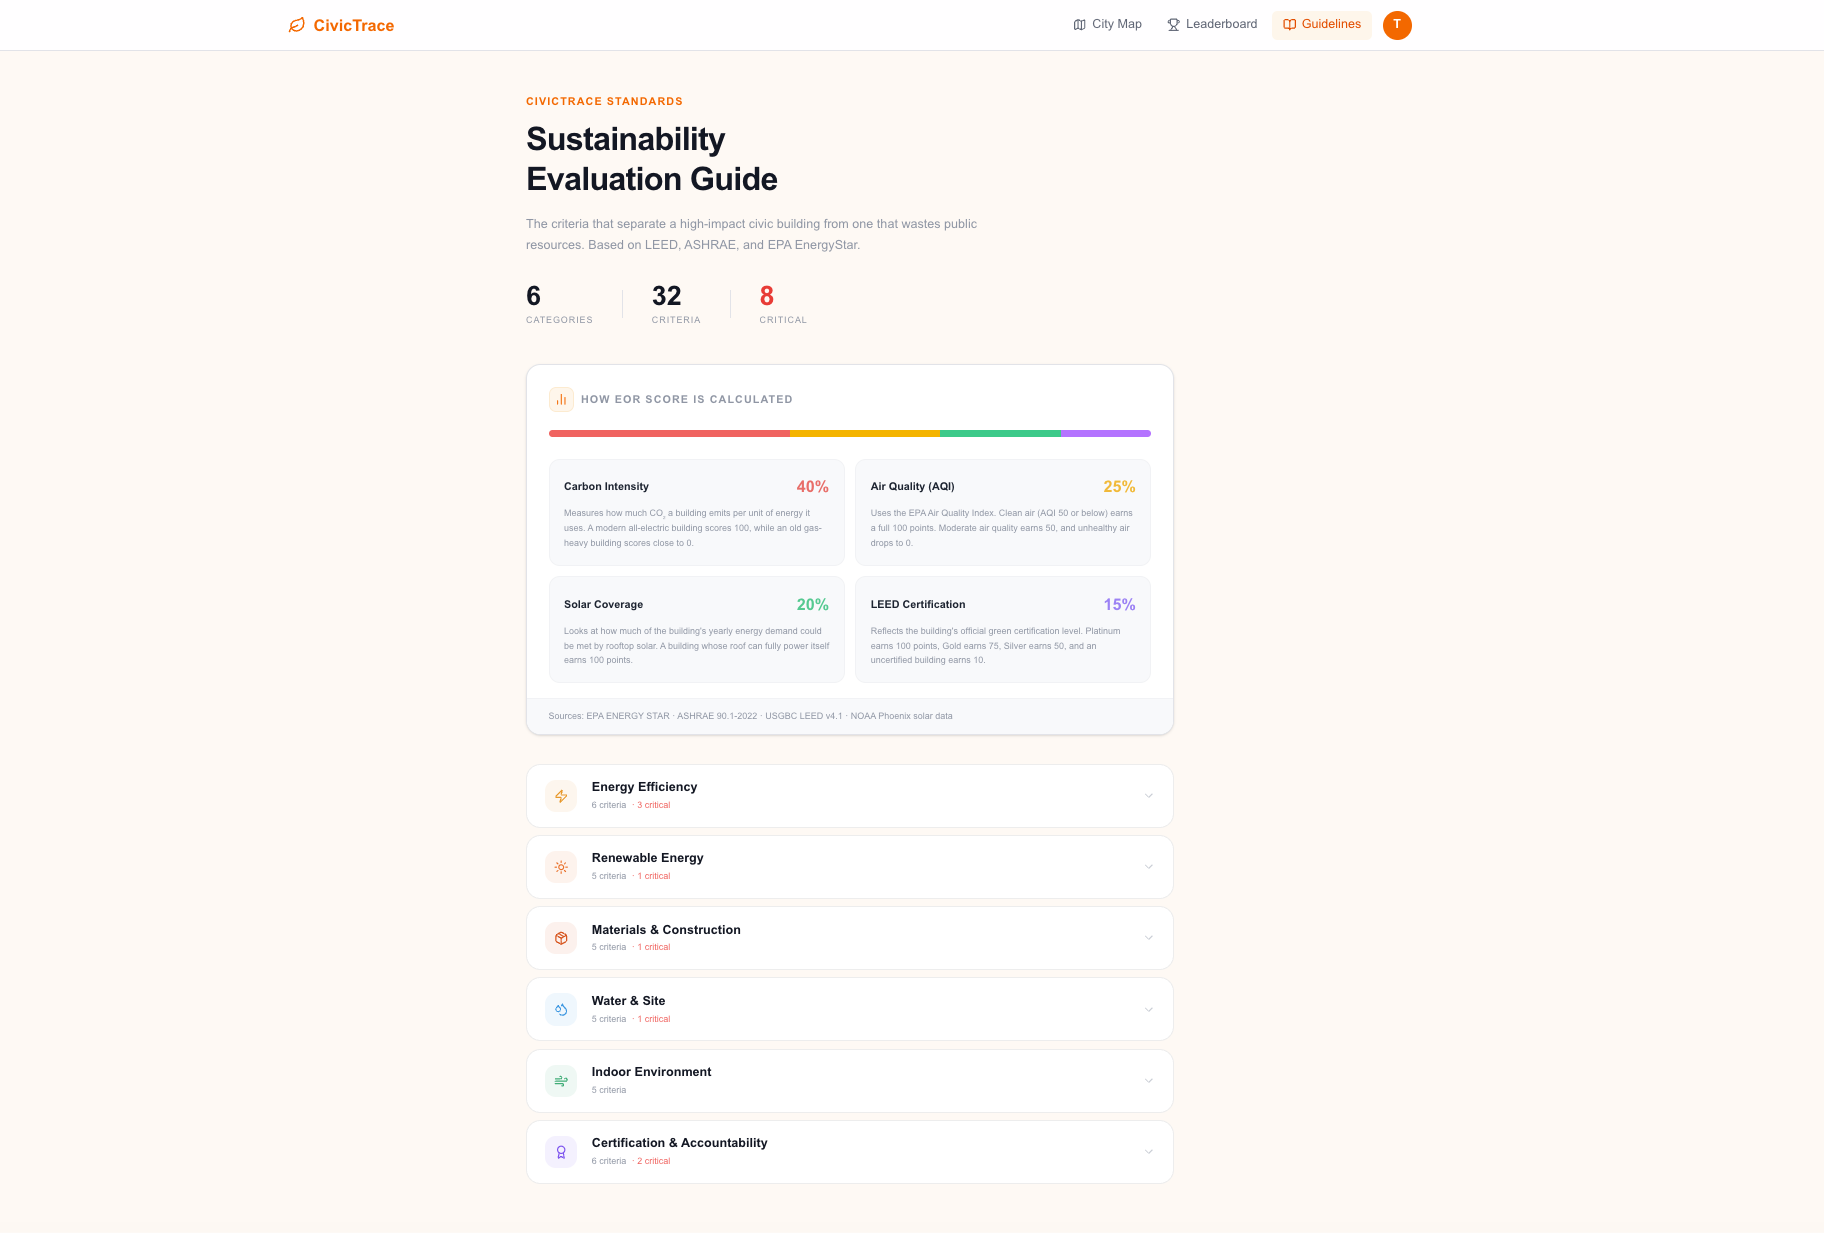
EOR Score Environmental Operations Rating Each building gets a composite sustainability score out of 100, combining:
- Carbon intensity (40%) tonnes of CO₂ per MWh consumed
- Air Quality Index (25%) live data from the Google Air Quality API
- Solar coverage potential (20%) fraction of energy demand rooftop solar could supply
- LEED certification tier (15%) third-party verified green building status
Carbon Footprint Breakdown Carbon is reported per the GHG Protocol broken into Scope 1 (direct combustion), Scope 2 (purchased electricity using the EPA eGRID Arizona grid factor of 0.386 t CO₂/MWh), and Scope 3 (supply chain and indirect emissions).
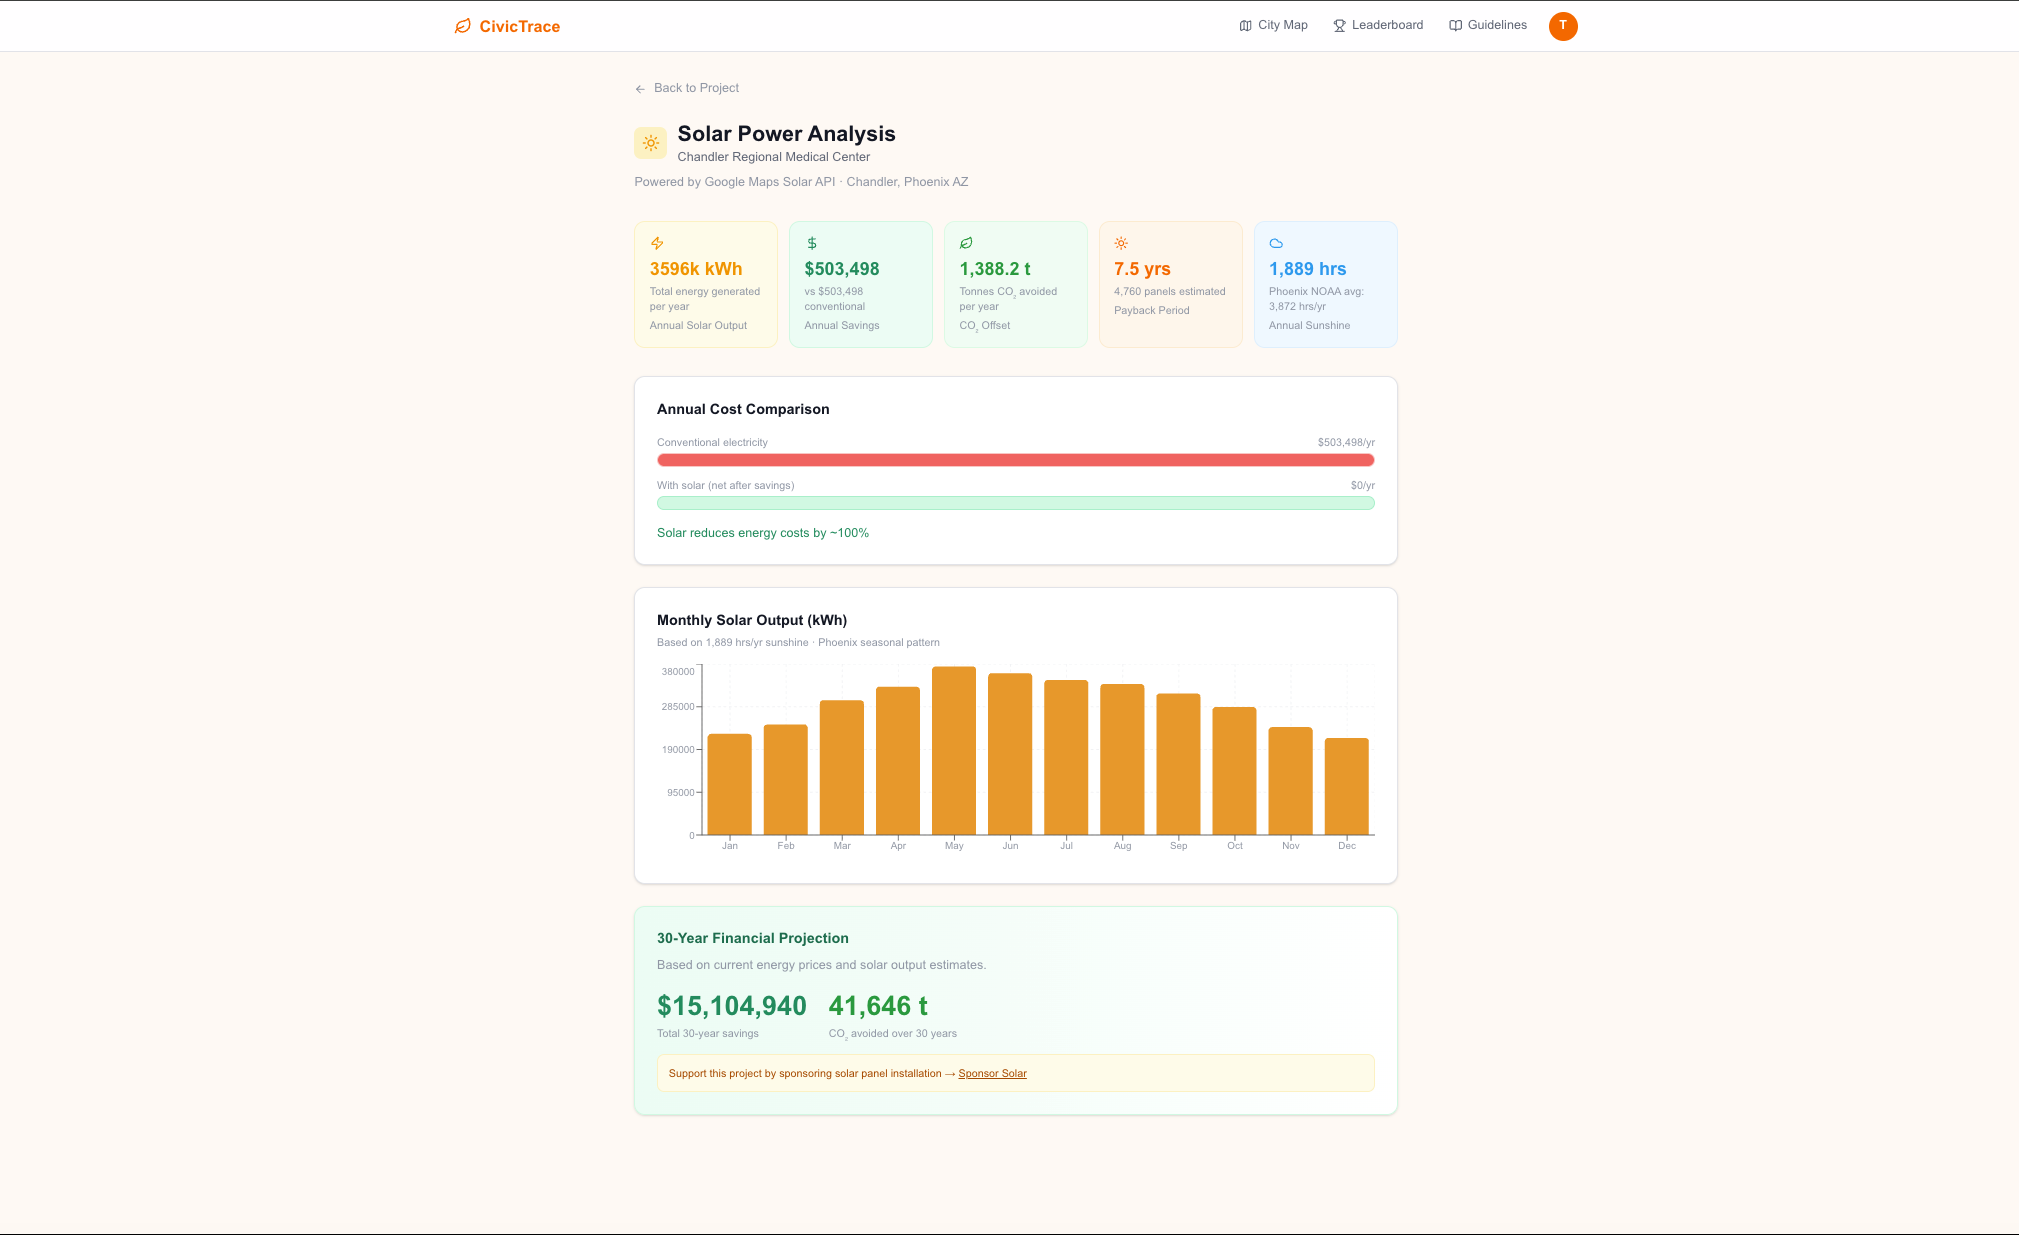
Solar Analysis Powered by the Google Solar API, every building gets a detailed solar report: annual kWh potential, estimated panel count, annual savings in dollars, CO₂ offset, payback period, and a month-by-month output chart shaped by Phoenix's seasonal sunshine pattern.
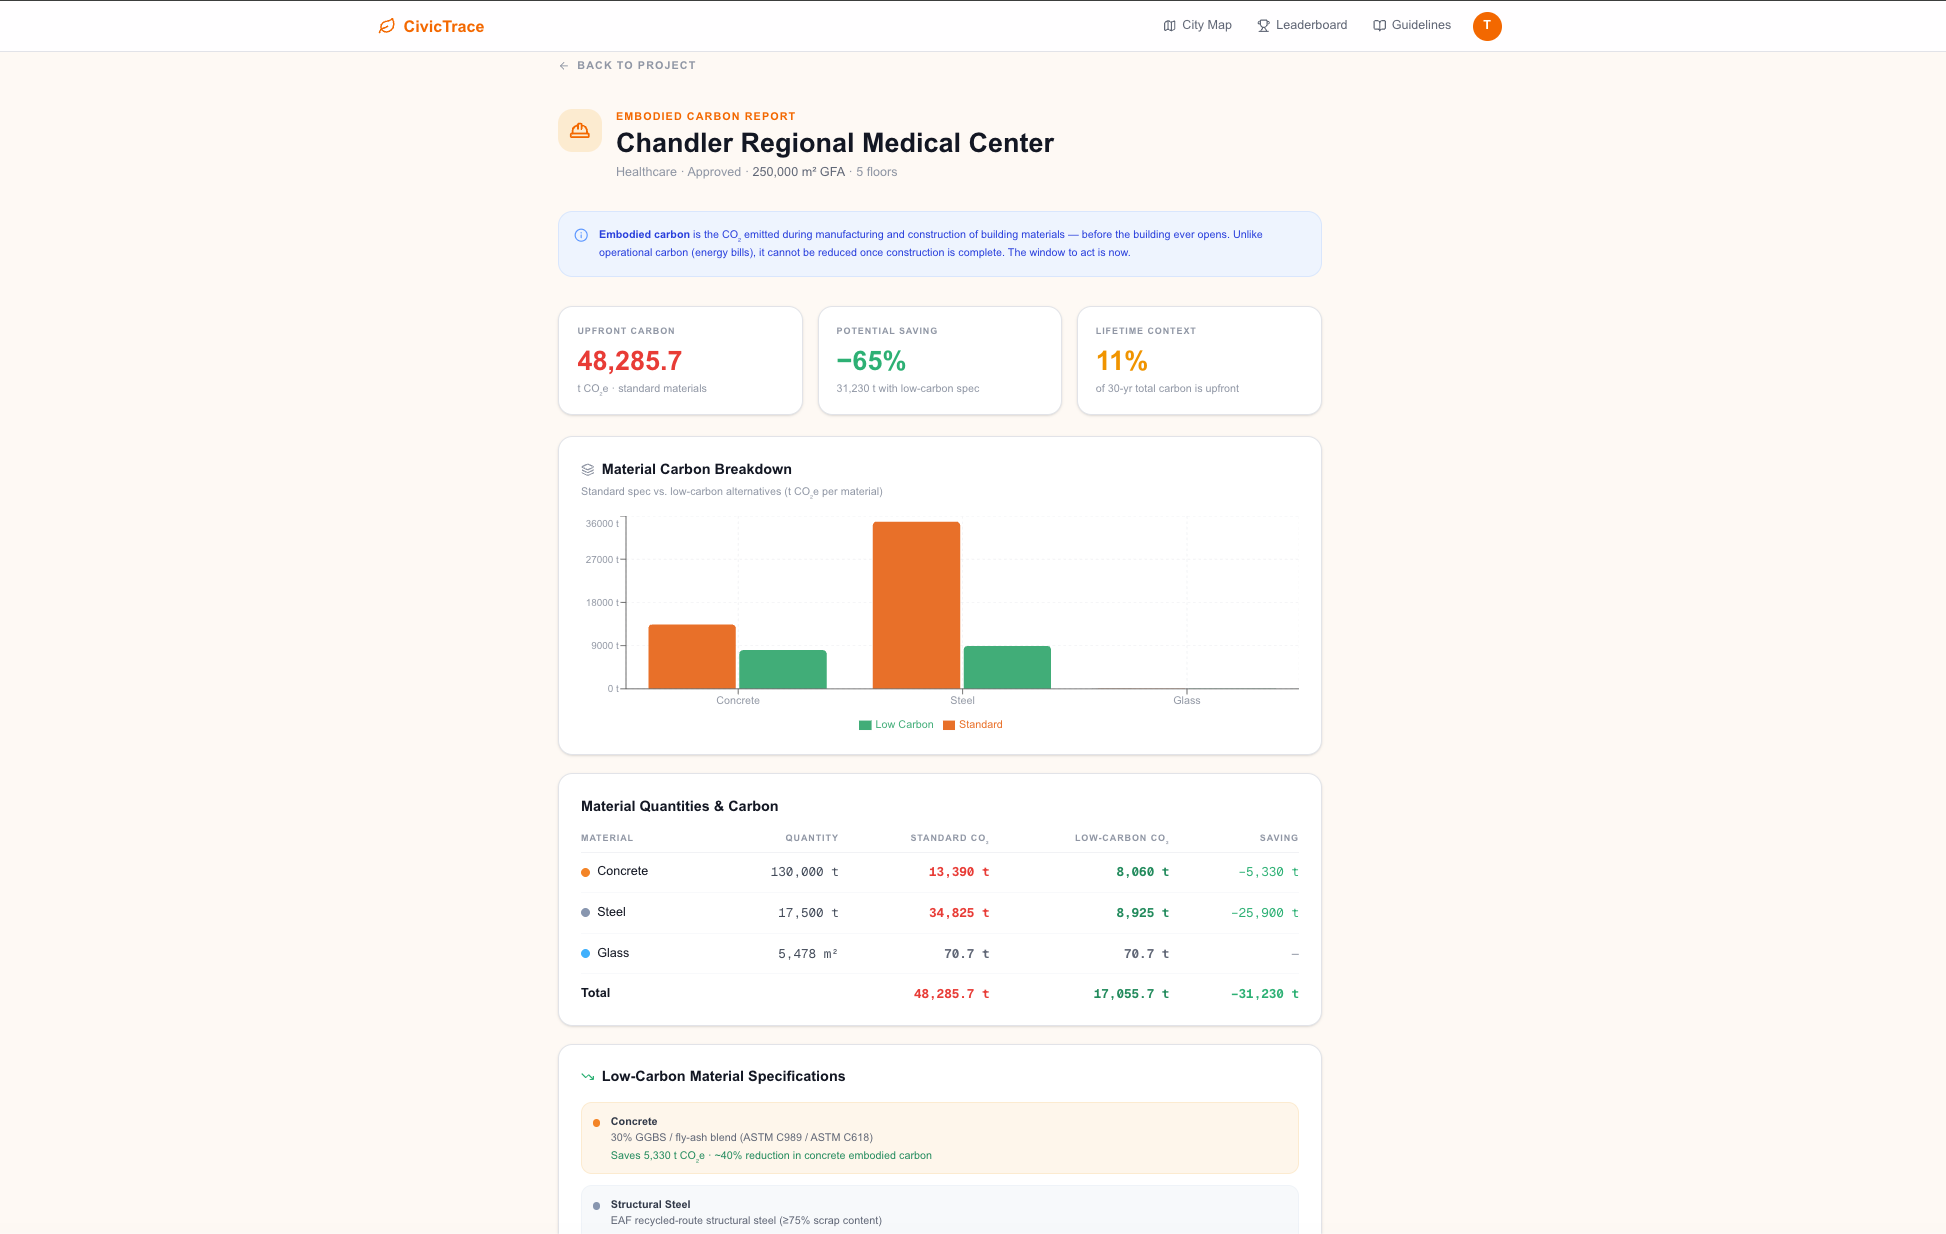
Embodied Carbon Report For buildings currently under construction or in the approval stage, CivicTrace calculates the upfront carbon locked into building materials concrete, steel, and glass before the building ever opens. Unlike operational carbon, embodied carbon cannot be reduced after construction. We show exactly how much CO₂ could be saved by specifying low-carbon concrete (SCM blends) and recycled-route steel, using carbon factors from the ICE Database v3.0.
AI Green Redesign Suggestions Each building has an AI-powered recommendations panel that generates prioritised, actionable sustainability improvements High, Medium, and Low priority with projected impact estimates.
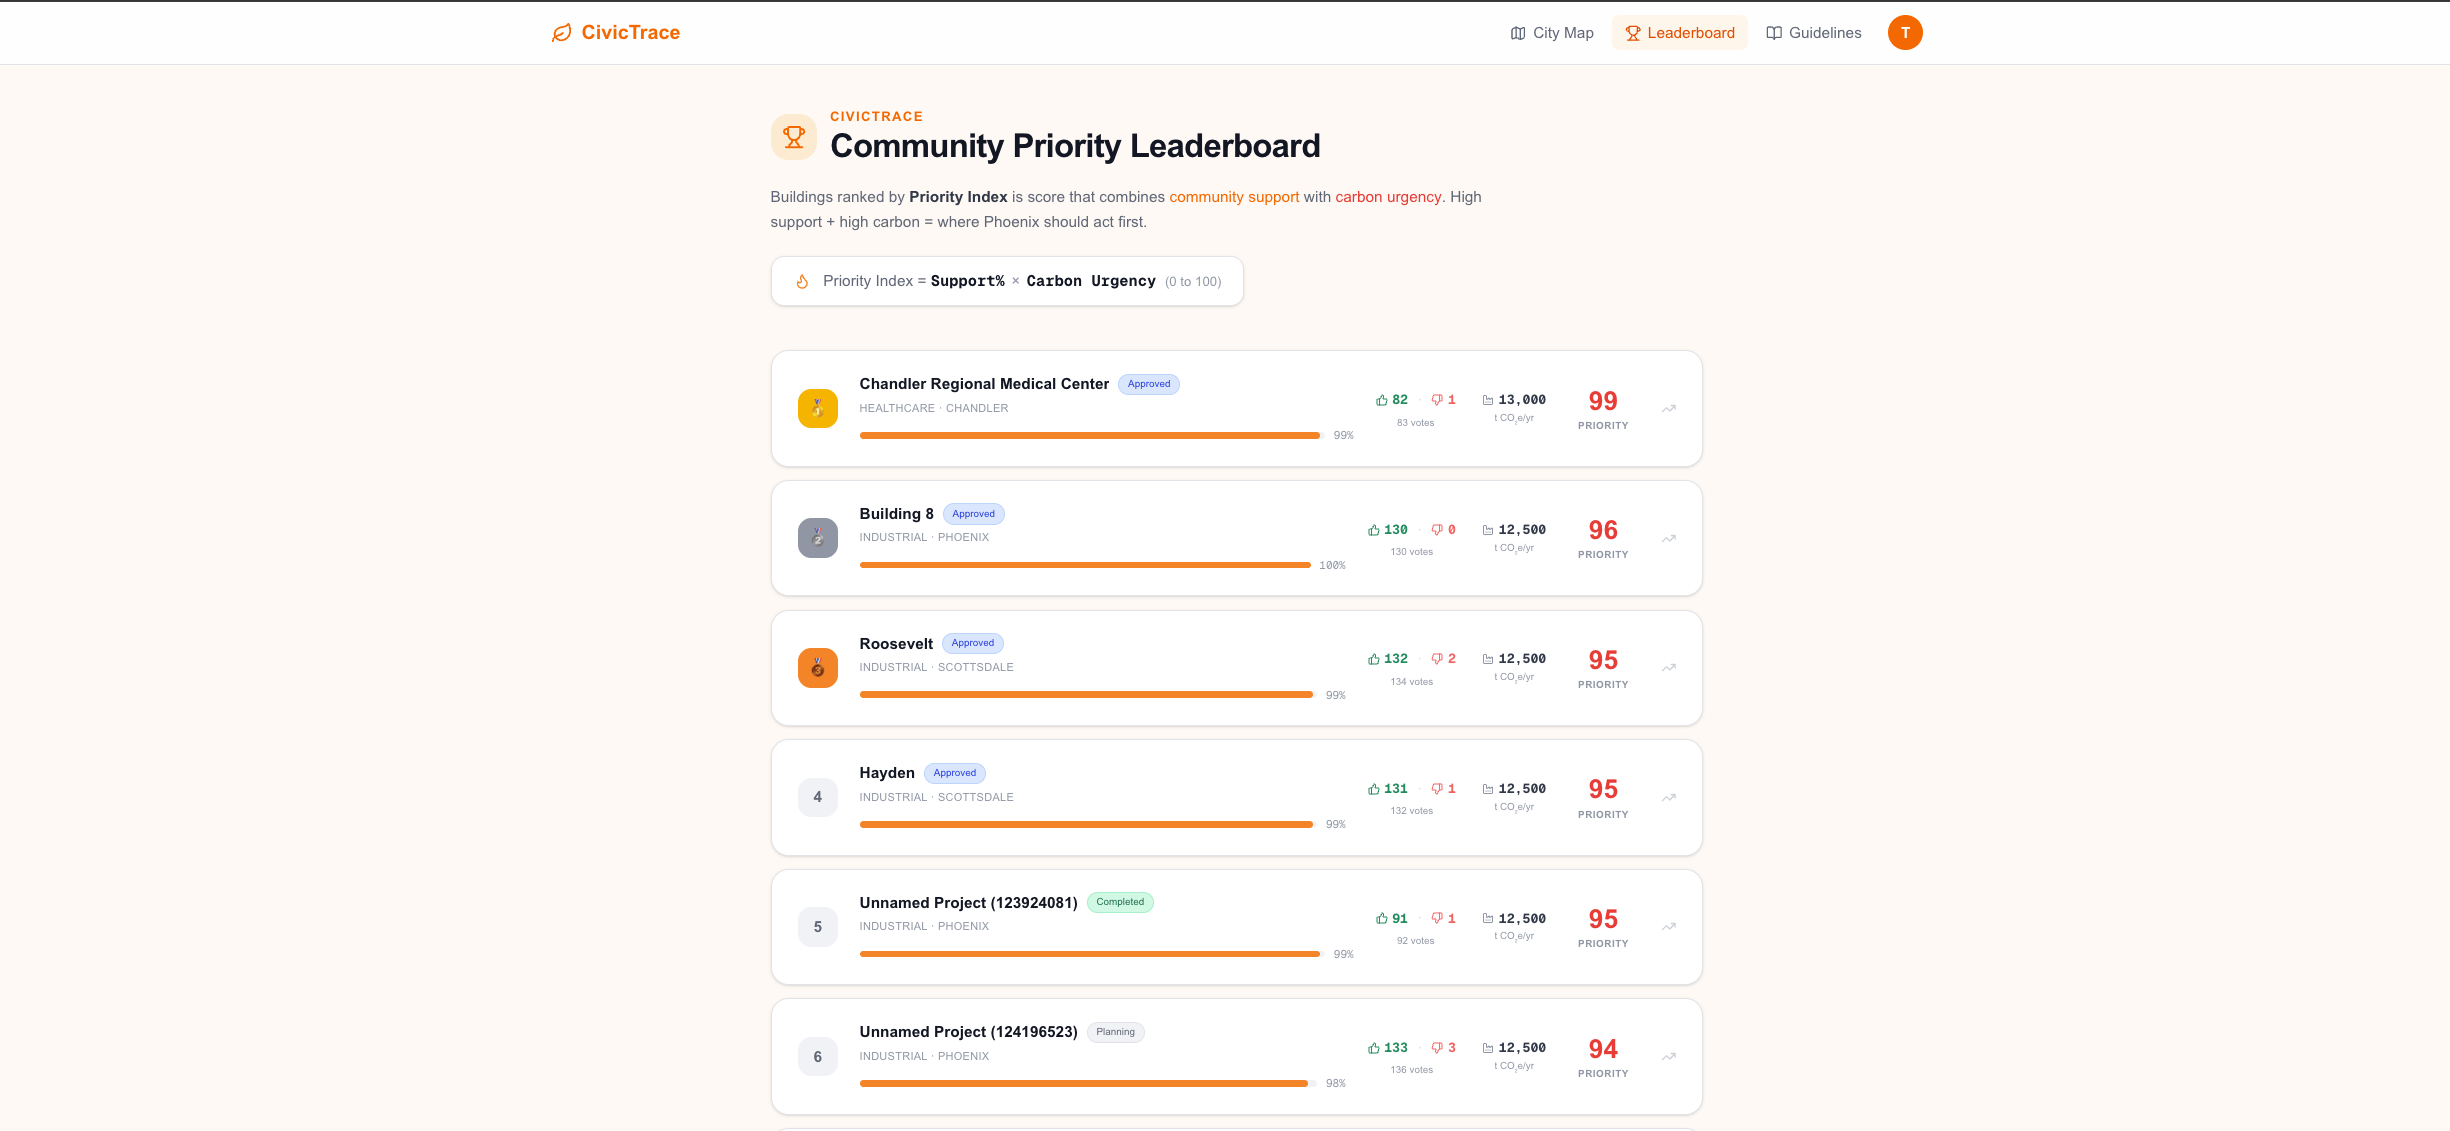
Community Priority Leaderboard Residents can vote on which buildings they most want to see go green. Buildings are ranked by a Priority Index community support percentage multiplied by carbon urgency score. This creates a data-backed, community-validated list of where Phoenix should act first: a policy roadmap built from civic participation.
How We Built It
Frontend: Next.js 16 (App Router) with TypeScript and Tailwind CSS v4. The 3D map is rendered using the Google Maps JavaScript API with vector tiles, 67.5° tilt, and building polygon overlays drawn as clickable google.maps.Polygon objects. Charts are built with Recharts.
Backend: Python 3.11 with FastAPI and Uvicorn. On startup, the backend queries the Overpass API (OpenStreetMap) to fetch real building footprints polygons, names, building types for the Phoenix/Tempe bounding box. Each building is then enriched on-demand with live data from the Google Air Quality API and Google Solar API, with results cached in memory.
Carbon modelling: Building energy and carbon profiles are derived from EPA CBECS 2018 benchmarks and ASHRAE 90.1-2022, calibrated to Phoenix-area building types. Carbon scope ratios are assigned per building type based on typical fuel mix (e.g. hospitals have high Scope 1 from gas sterilisation; offices are mostly Scope 2 electricity).
Embodied carbon: Computed from building footprint area (derived from OSM polygon geometry using the Shoelace formula) multiplied by floor count estimates and material intensity factors from the RICS Embodied Carbon Industry Review 2023 and ICE Database v3.0.
Auth and voting: Firebase Authentication (Google sign-in) gates the voting system. Each vote is written to Firestore (votes/{uid}_{projectId}) and synced to the backend vote store. Votes are changeable and retractable the backend handles delta updates atomically.
AI suggestions: OpenAI API (GPT-4o) generates building-specific green redesign recommendations based on the building's EOR score, carbon profile, type, and status.
Challenges We Ran Into
Live data latency. The Google Solar API and Air Quality API have real response times. Fetching both for every building on page load would make the app unusable. We solved this with lazy enrichment the map loads instantly with static building data, and live data is fetched and cached only when a building is selected.
Building polygon accuracy. OSM data for Phoenix is rich in some areas and sparse in others. Many buildings have no polygon, only a point. We built a fallback that synthesises a plausible footprint polygon from the building's carbon footprint value and a deterministic hash of its ID giving every building a distinct, consistently-shaped footprint even without OSM geometry.
Embodied carbon without BIM data. Accurate embodied carbon normally requires detailed bill-of-materials from architectural drawings. We don't have that. Instead, we built a material intensity model using GFA (gross floor area) estimates per building type, sourced from industry benchmarks, to produce credible directional estimates without any per-building data beyond the OSM footprint.
Making votes meaningful. A raw upvote count is just a popularity contest. The challenge was designing a metric that combined community sentiment with objective environmental data in a way that was genuinely useful for decision-making. The Priority Index formula support percentage × carbon urgency took several iterations to feel right.
Accomplishments That We're Proud Of
- Building-level carbon data for an entire city not estimates for "Phoenix" as a whole, but per-building, per-scope breakdowns for hundreds of real structures
- The embodied carbon report we believe this is the only publicly accessible tool that shows construction-phase carbon for Phoenix buildings and quantifies the impact of low-carbon material specifications in real time
- A civic feedback loop that actually means something the Priority Index turns a thumbs-up button into a genuine input for urban policy
- Live data pipeline AQI and solar figures are not mocked; they are fetched from Google's APIs for the building's actual coordinates at the moment you click it
- The 3D map seeing an entire city's carbon footprint visualised as coloured building polygons on a tilted, rotatable 3D canvas is something no one on our team had seen done before for environmental data
What We Learned
- The GHG Protocol's Scope 1/2/3 framework is the right structure for building-level carbon but translating it to individual buildings without utility bills or energy audits requires careful benchmarking and honest assumptions
- Embodied carbon is massively underappreciated in public discourse. Operational carbon gets all the attention because it's ongoing, but for a building under construction right now, the material choices made this week will outlast any efficiency upgrade
- Community participation data is only useful if it's combined with objective metrics raw vote counts mislead, weighted indices inform
- OpenStreetMap is an extraordinary resource more comprehensive for Phoenix building footprints than we expected, and freely queryable at scale via Overpass
What's Next for CivicTrace
- Multi-city expansion the architecture is city-agnostic; the Overpass query, grid carbon factor, and sunshine hours are the only Phoenix-specific inputs
- Real utility data integration partnering with APS/SRP to replace estimated energy consumption with actual meter data for enrolled buildings
- Persistent vote and trend data tracking how community sentiment shifts over time as buildings are renovated or new projects are announced
- Developer API allowing city planning departments, architecture firms, and NGOs to query building-level carbon data programmatically
- Permit integration automatically flagging newly submitted building permits and running embodied carbon projections before ground breaks
- Mobile app letting residents scan a QR code on a construction site hoarding and instantly see the embodied carbon of what's being built in front of them
Built With
- fastapi
- firebase
- google-maps
- nextjs
- osm

Log in or sign up for Devpost to join the conversation.