-
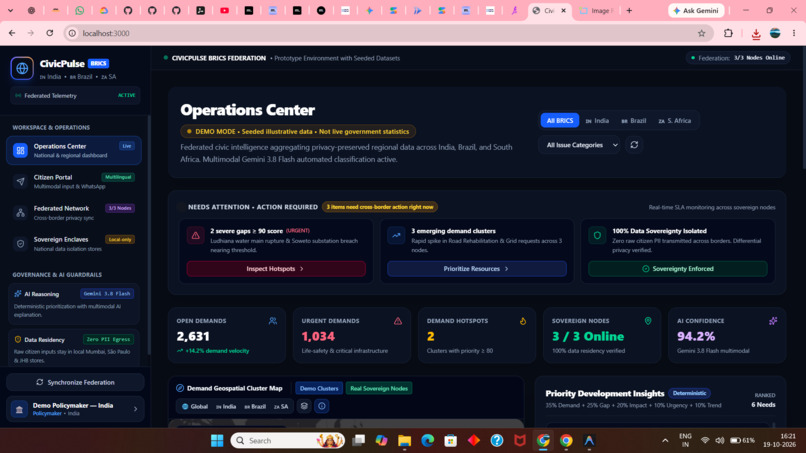
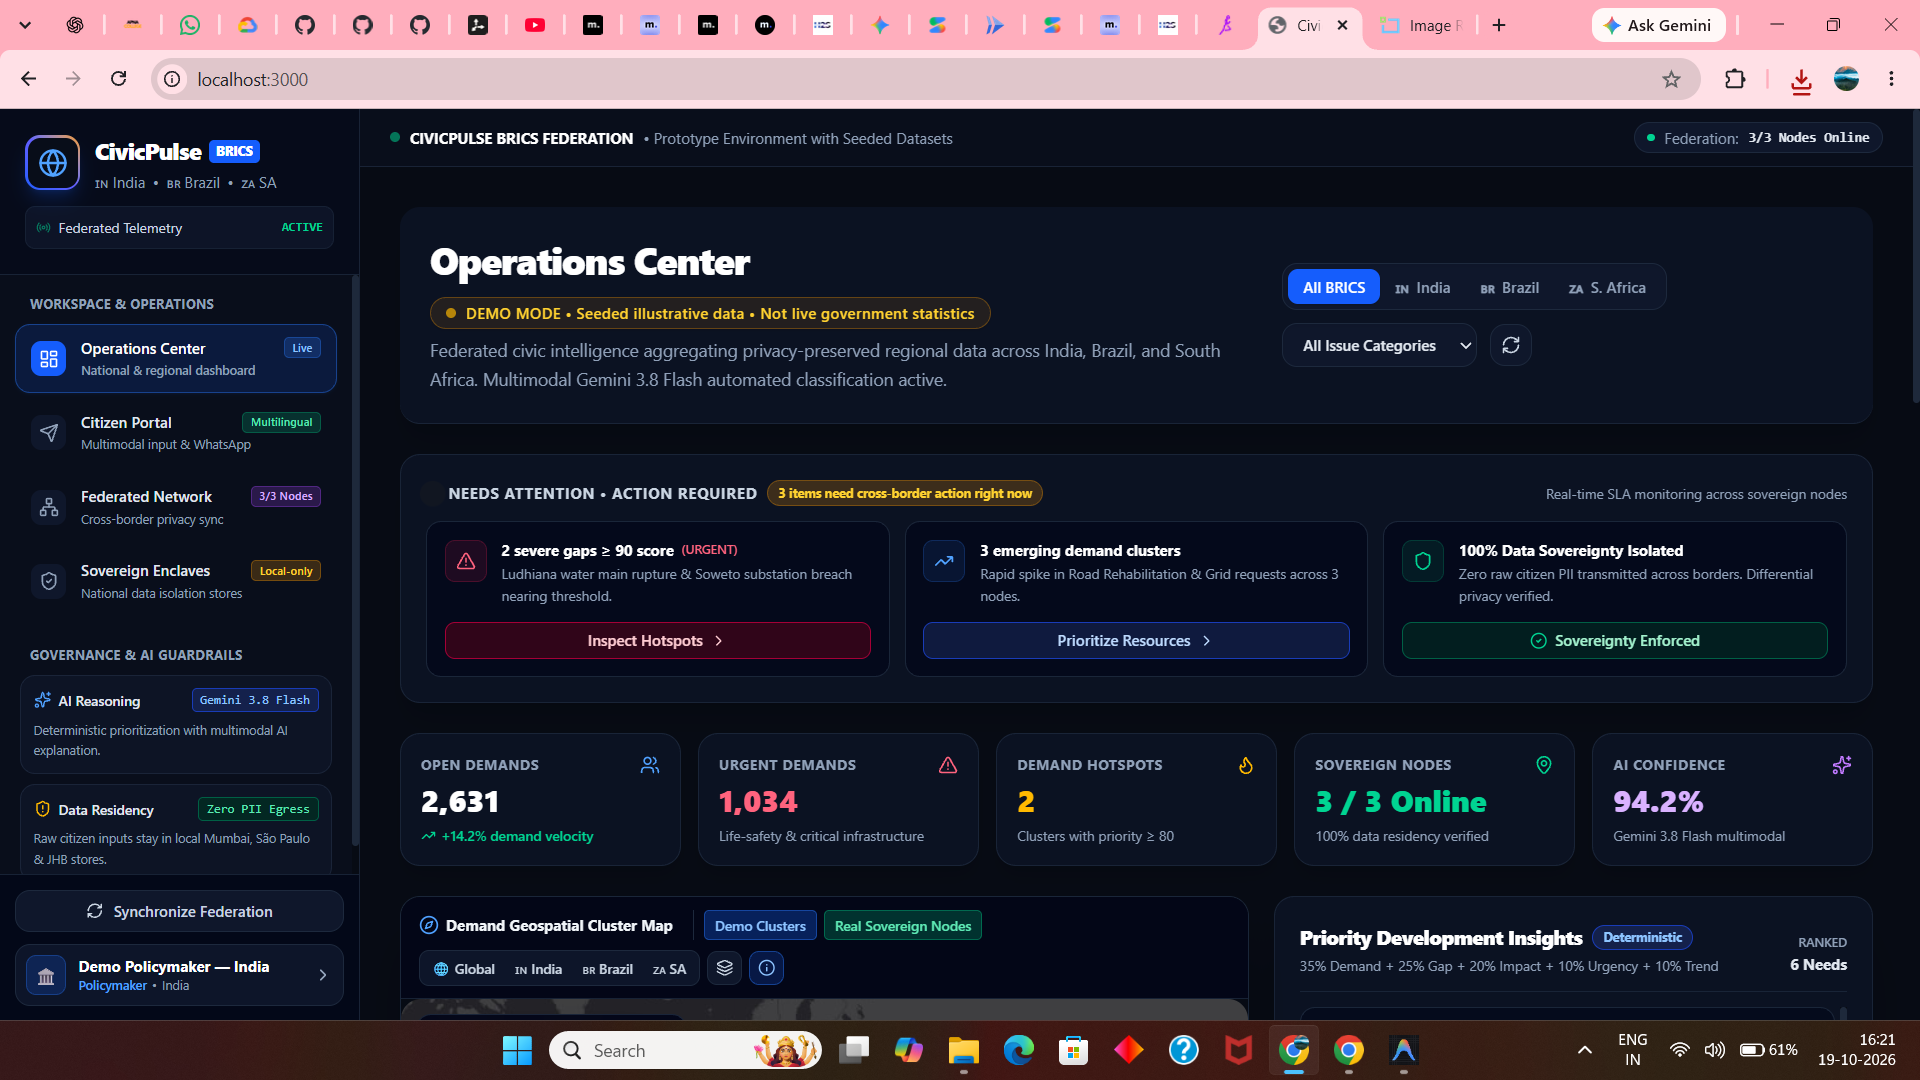
Main Dashboard
-
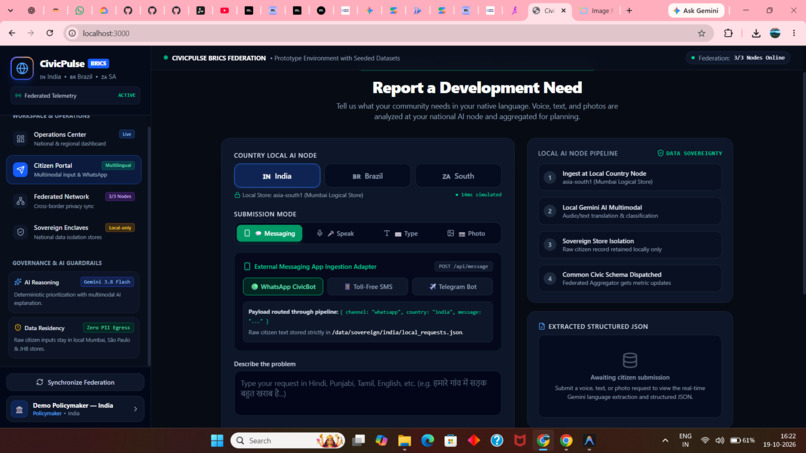
Citizen portol
-
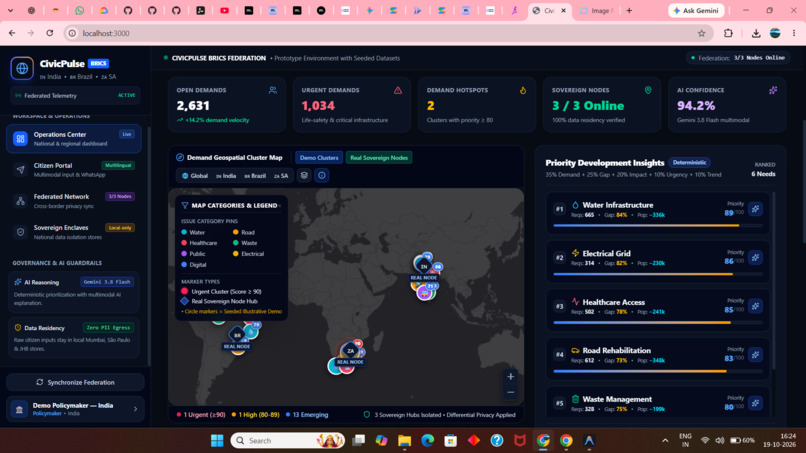
Map UI
Inspiration
Civic decision-makers in developing and emerging economies face a critical dilemma: millions of grassroots infrastructure requests—from broken water distribution pipelines to dangerous highway cratering—are trapped in silos or lost across linguistic barriers. Meanwhile, traditional civic dashboards are often cluttered, slow, and fail to provide immediate operational context.
We were inspired by modern municipal operations command platforms to fundamentally rethink how cross-border civic data is presented. Our goal for HyperBloom October was to build an enterprise-grade Operations Center that balances deep analytical power with accessible, intuitive human-centered design—empowering policymakers to take action while protecting citizen privacy.
🎨 What Was Redesigned for HyperBloom vs. Pre-Existing
Because CivicPulse had a foundational prototype, our primary focus for this hackathon was a comprehensive UI/UX and information architecture overhaul:
| Dimension | Pre-Existing Baseline | HyperBloom Hackathon Redesign (New UI/UX) |
|---|---|---|
| Information Architecture | Crowded horizontal top navbar that shrank and broke on mobile. | Compact Left Sidebar: Persistent, elegant SaaS navigation with branding, active workspace indicators, telemetry status, and profile switcher. |
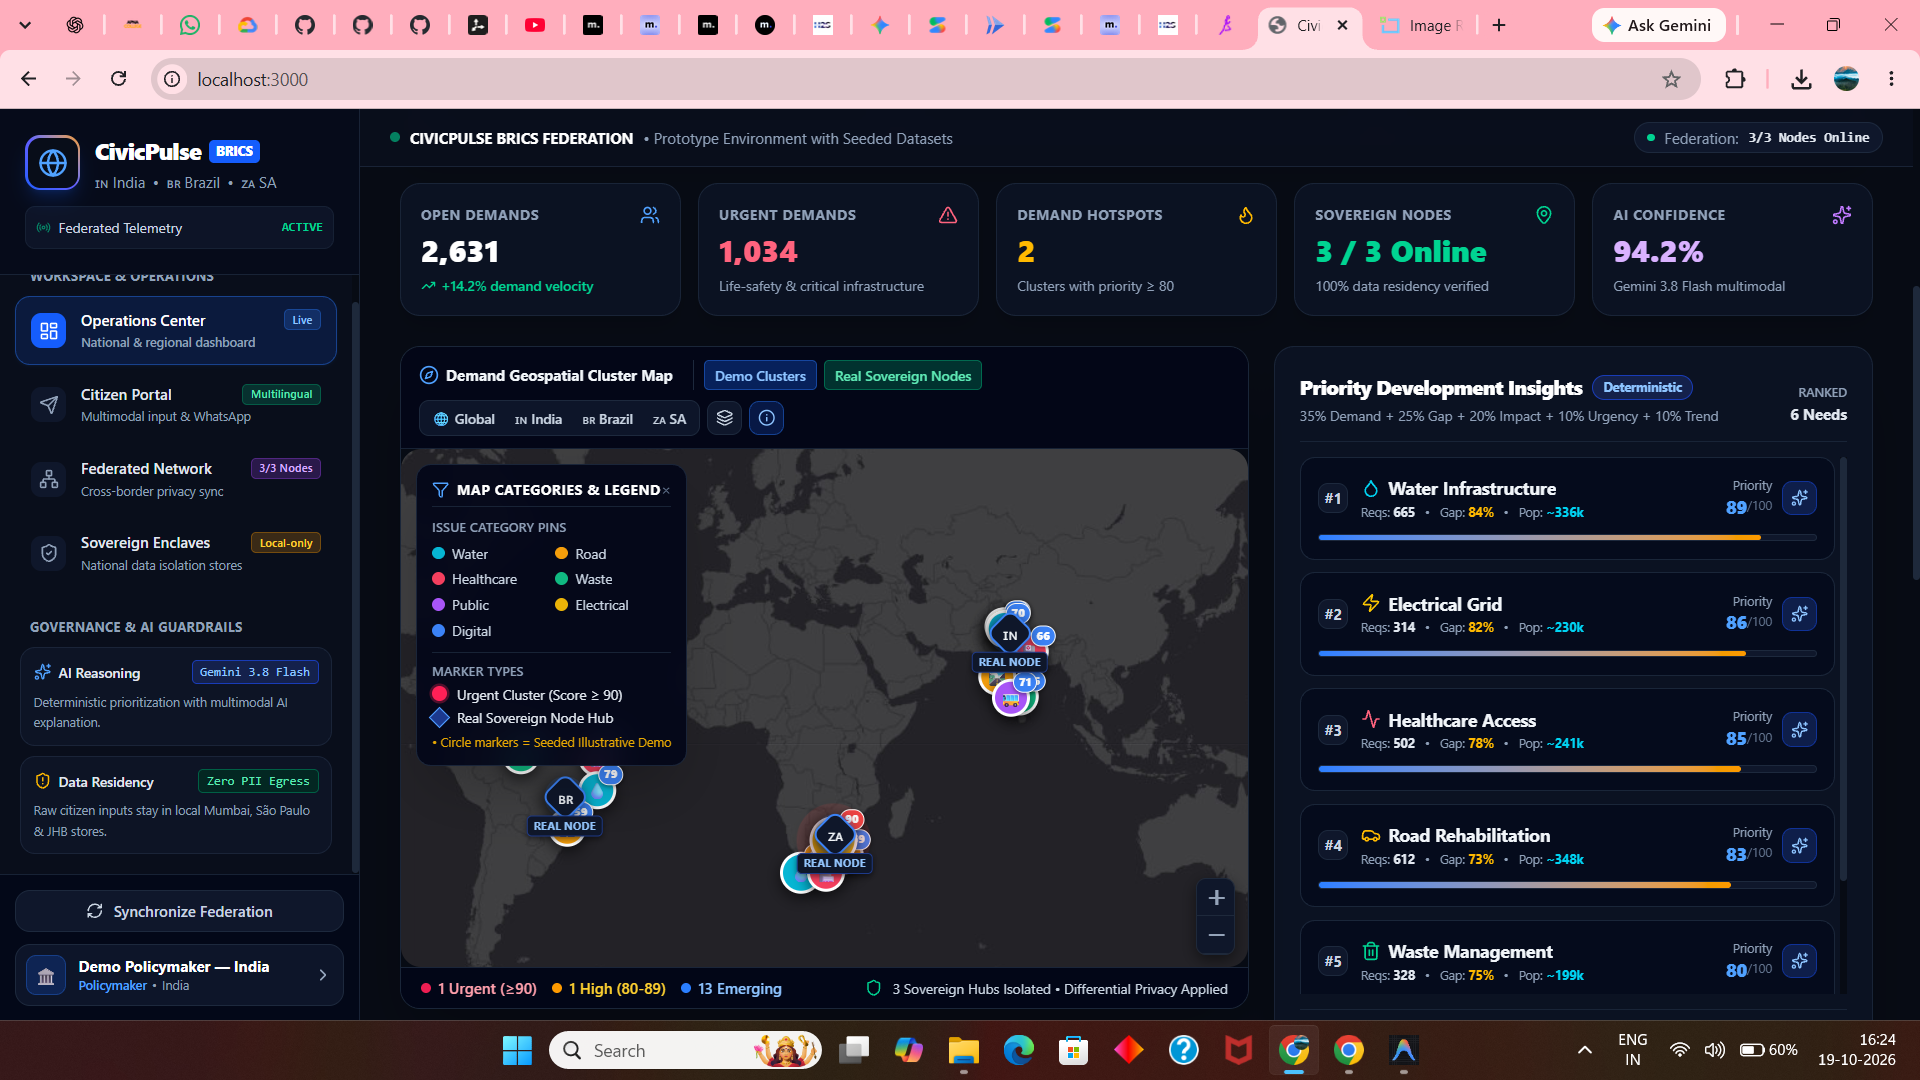
| Visual Hierarchy | Long single-column vertical scroll where a giant dark map pushed all analytics off-screen. | Side-by-Side Split Architecture: Prominent geospatial map (7 cols) directly paired with contextual Priority-Insights Panel (5 cols), placing actionable intelligence side-by-side. |
| Map Experience | Low-contrast dark base; overlapping yellow circles with tile watermarks. | Geospatial Engine Overhaul: High-contrast tile layer with Dark/Street toggle, anti-overlap coordinate dispersion, distinct category color-coding, interactive layer controls, and bottom status bar. |
| Node Anchors vs Demo Clusters | No visual distinction between physical servers and simulated clusters. | Explicit Architectural Separation: Real Sovereign Nodes (New Delhi, Brasília, Pretoria) rendered as glowing diamond-shield anchors with country flags, separate from circular demo hotspot beacons. |
| Crisis Management & SLA | Generic numeric stat boxes. | "Needs Attention" Action Cards: 3 high-urgency action cards (Severe Gaps, Cross-Border Demands, Sovereignty Enforcement) with direct inspection triggers. |
| Data Integrity & Labeling | No persistent disclaimers beside dashboard headings. | Persistent Header Pill: DEMO MODE · Seeded illustrative data · Not live government statistics. |
| Audit Trail & Feed | No tabular report list. | Recent Civic Reports & Ingestion Feed Table: Comprehensive table with status badges, priority colors, multilingual channel indicators (audio, photo, WhatsApp), and search filter. |
| Mobile Responsiveness | Rigid layout unsuited for small screens. | Fluid Mobile UX: Responsive off-canvas slide-out sidebar, mobile header with hamburger trigger, and responsive multi-column grid adaptations. |
What It Does
- Enterprise Operations Center: Presents a real-time, side-by-side command center featuring:
- "Needs Attention" Action Cards: Immediate triage for SLA-critical infrastructure breaches.
- 5 Core KPI Metric Cards: Tracking open demands, life-safety classifications, demand hotspots, node uptime, and AI classification confidence.
- Contextual Geospatial Intelligence:
- High-contrast, watermark-free map with smooth country fly-tos (India, Brazil, South Africa).
- Dynamic anti-overlap coordinate dispersion ensuring tightly clustered metropolitan demands are individually distinct and clickable.
- Clear visual differentiation between Real Sovereign Server Nodes (diamond anchors with national flags) and Illustrative Demo Clusters.
- Interactive Priority-Insights Panel:
- Sits adjacent to the map. Clicking any map marker automatically highlights and links to its matching ranking card.
- Explains priorities using a transparent, deterministic mathematical formula:
35% Demand + 25% Gap + 20% Population + 10% Urgency + 10% Trend.
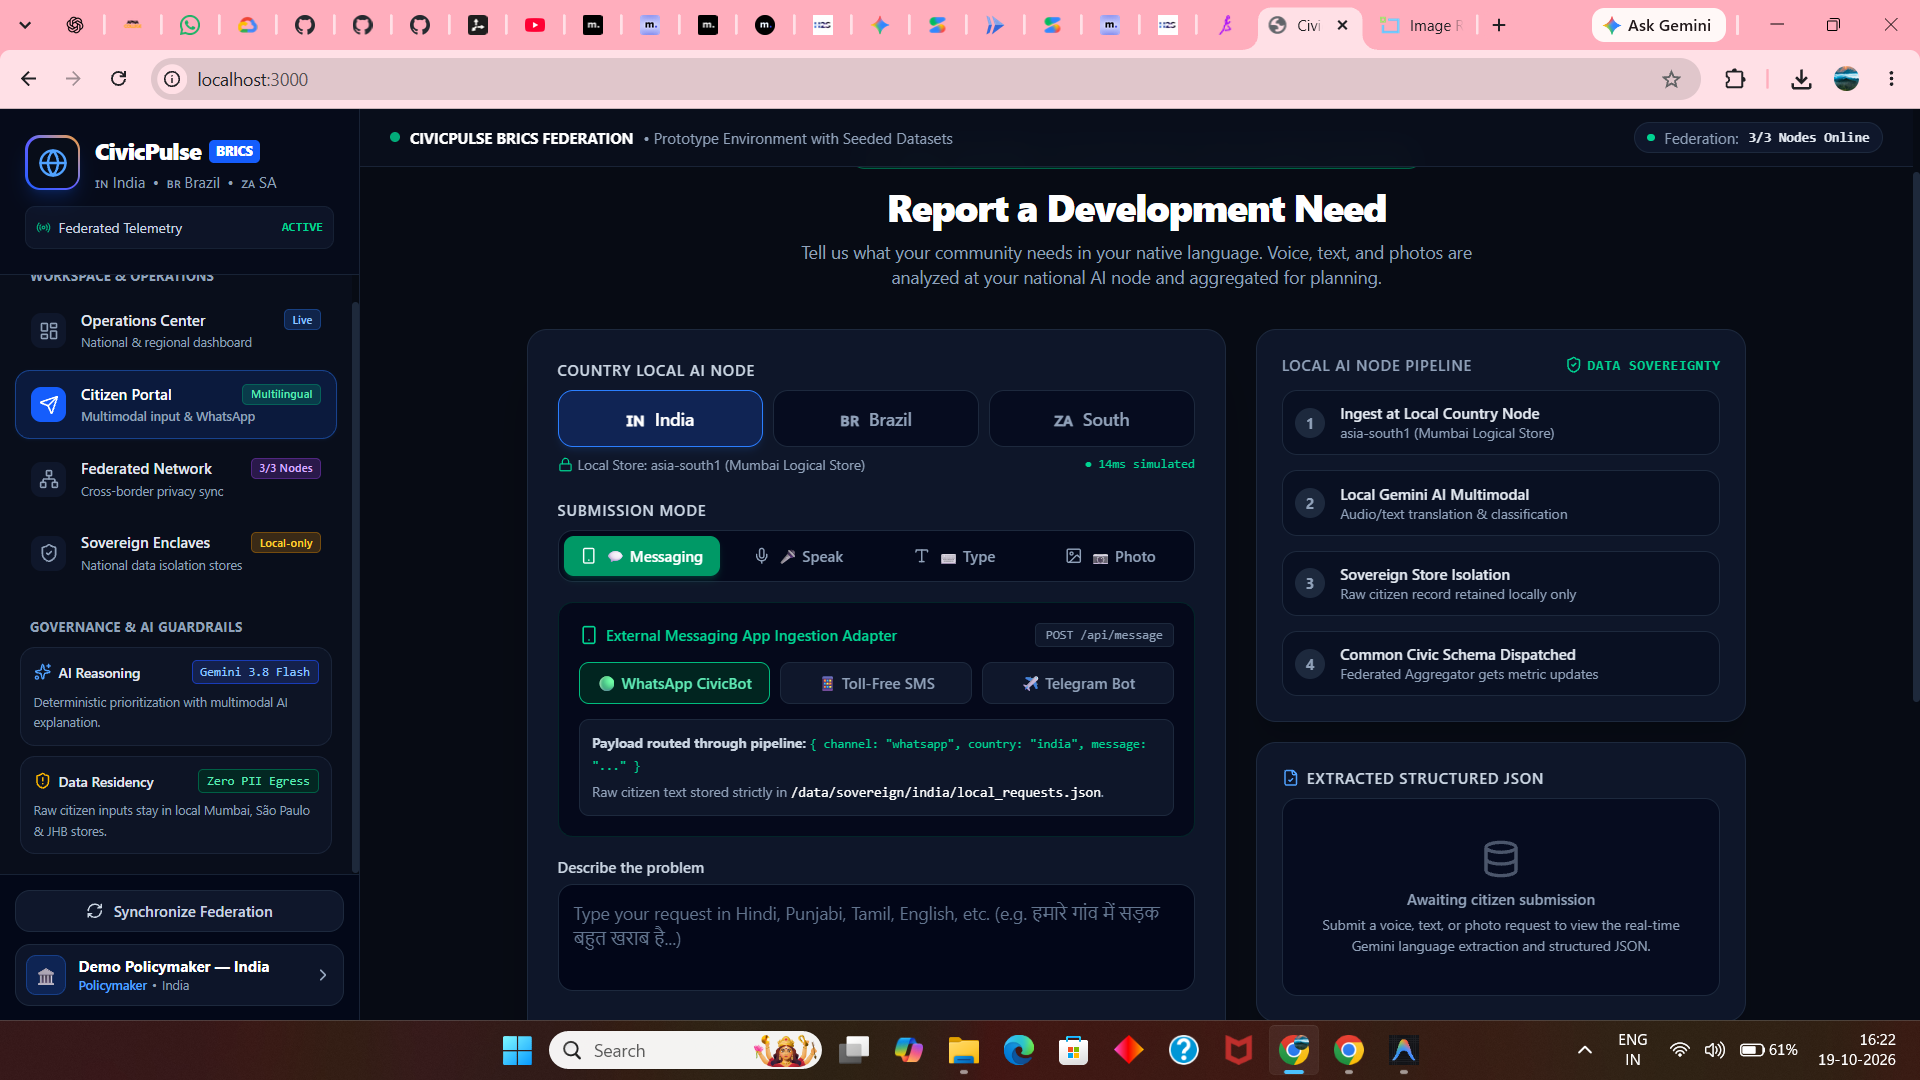
- Multimodal Citizen Reporting:
- Allows citizens to submit infrastructure failures via voice audio notes, photos, text, or WhatsApp/SMS in their native languages (Hindi, Punjabi, Marathi, Portuguese, isiZulu, English).
- Local nodes use Google Gemini 3.8 Flash to transcribe, translate, and classify the problem into a common civic schema.
- Zero-PII Data Sovereignty:
- Raw personal data never crosses national borders; only anonymized numeric summaries enter the central dashboard.
How We Built It
- Frontend & Design System: React 19, TypeScript, Vanilla CSS design tokens with Tailwind CSS v4, Lucide React icons, and Recharts for analytical data visualizations.
- Geospatial Engine: Leaflet.js with custom SVG pin markers, pulse ring animations, and high-contrast Esri Dark Canvas and OpenStreetMap raster layers.
- AI Multimodal Reasoning: Google Gemini 3.8 Flash API for speech-to-text, visual evidence recognition, and generating strategic fiscal policy guidance.
- Backend Architecture: Express.js with isolated country-partitioned sovereign data stores (
data/sovereign/india,brazil,south_africa) guaranteeing strict privacy boundaries. - Testing & Quality Assurance: Python virtual environment (
.venv) with automated pytest coverage (14/14 API tests passing).
Challenges We Ran Into
- Map Marker Overlapping: In densely populated regions like Ludhiana or São Paulo, multiple issue categories shared identical coordinates, resulting in unclickable overlapping markers. We developed a radial angular dispersion algorithm to cleanly offset co-located markers while maintaining geographic accuracy.
- Tile Watermarks & Usability: Standard public cartography CDNs recently added intrusive API key watermarks. We transitioned to high-contrast Esri World Canvas and OpenStreetMap raster layers, restoring a crisp, professional aesthetic.
- Balancing Rich Data with Clean Layout: A single dashboard had to show maps, deterministic priority breakdowns, charts, and report feeds without overwhelming the user. We solved this with a split-screen 7:5 ratio grid on desktop and an off-canvas drawer on mobile.
Accomplishments That We're Proud Of
- Cohesive Navy-and-Blue Brand Identity: Crafted a distinctive, modern digital public good aesthetic that feels authoritative yet clean and accessible.
- True Side-by-Side Contextuality: Seamlessly synchronizing map clicks with the adjacent priority insights panel so policymakers never lose context.
- Full Mobile Responsiveness: Seamlessly transitioning from a wide multi-column operations dashboard on desktop to a smooth mobile drawer experience.
- Architectural Honesty: Clearly separating seeded illustrative demo data from real physical node telemetry through persistent badges and dedicated marker shapes.
What We Learned
- How micro-animations (pulsing urgency rings, hover transitions, and progress score meters) significantly improve visual hierarchy and user engagement in data-dense interfaces.
- The importance of accessible color palettes—differentiating 7 distinct civic infrastructure categories (Water, Roads, Healthcare, Waste, Energy, Transport, DPI) while maintaining high contrast in dark mode.
- Designing for digital sovereignty: how UI design can communicate complex privacy guarantees (e.g. zero PII egress) clearly to both citizens and government auditors.
What's Next for CivicPulse
- Interactive Scenario Modeling: Adding budget simulation sliders so policymakers can test how funding allocations affect regional priority scores.
- Offline PWA Citizen Ingestion: Extending the citizen portal with progressive web app caching for rural areas with intermittent connectivity.
- Cross-Border Peer Knowledge Sharing: Enabling municipal planners in Durban to review case studies and engineering solutions deployed for similar road failures in Pune.
Built With
- civic-tech
- data-visualization
- digital-public-goods
- express.js
- gemini-api
- google-gemini
- leaflet.js
- node.js
- pytest
- python
- react
- recharts
- tailwindcss
- typescript
- ui-ux
- web-design


Log in or sign up for Devpost to join the conversation.