-
-

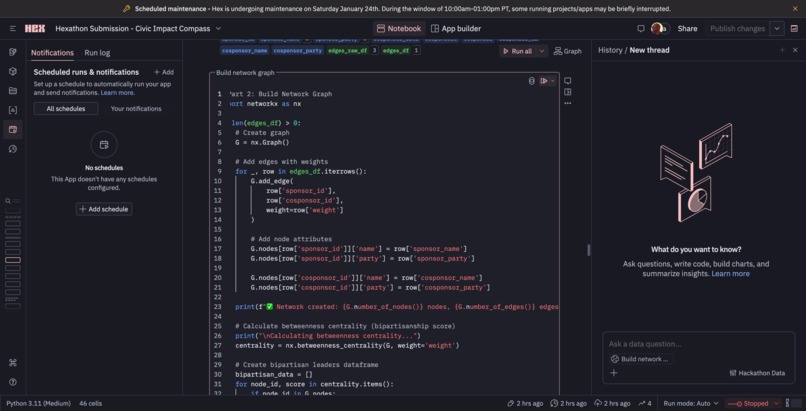
Bipartisan Network Graph (notebook)
-
Congress Productivity Ranker
-
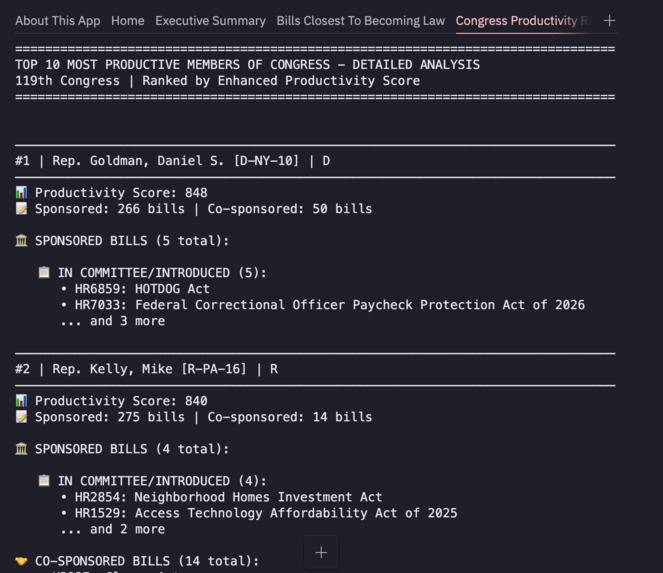
Congress Productivity Detail Analysis
-

-
-
Bipartisan Network Graph
-
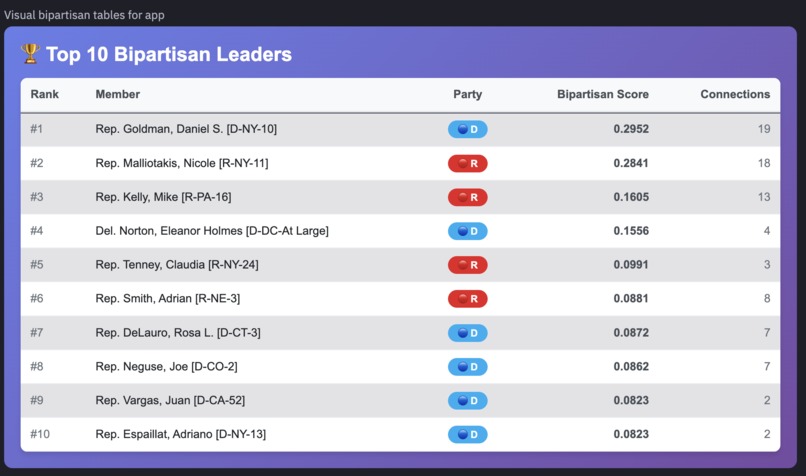
Top Bipartisan Congresspeople


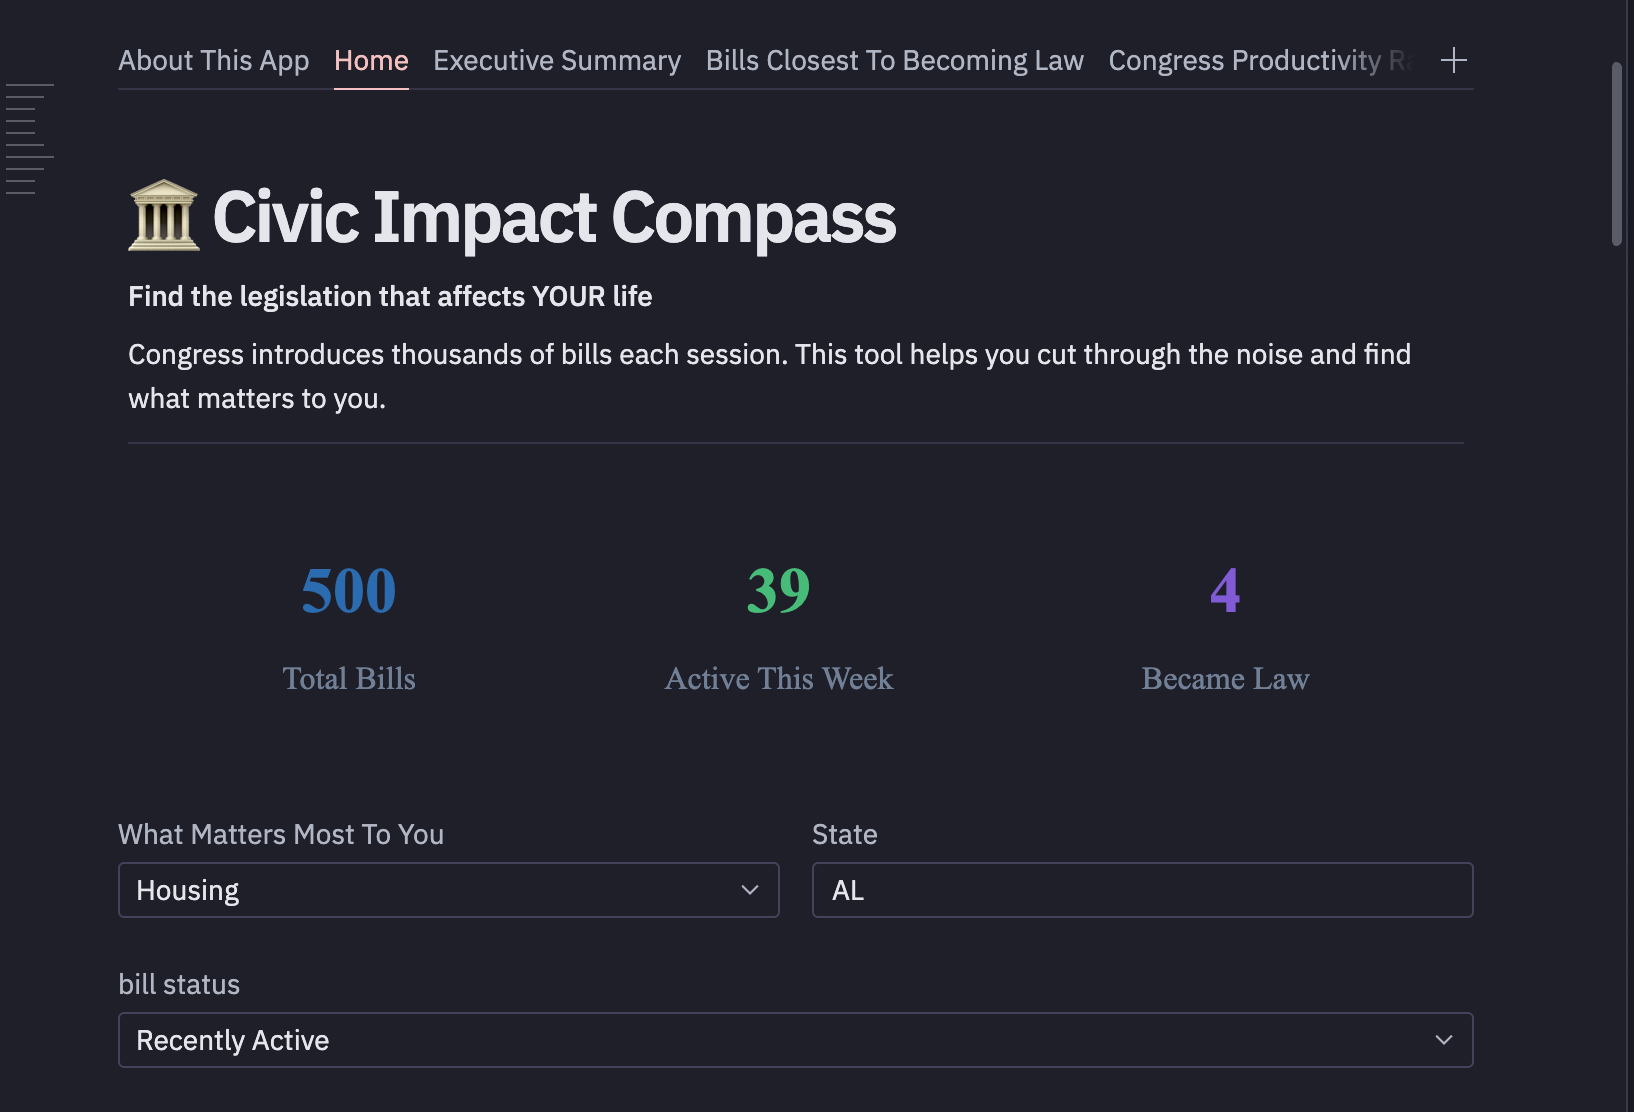


Civic Impact Compass
Congress data meets AI-powered analysis — find the bills that affect YOU.
📋 Project Overview
Civic Impact Compass transforms raw congressional data into personalized legislative intelligence. Instead of sifting through 10,000+ bills per session, citizens select their interests and location to instantly see which legislation matters to them — with AI-generated plain-language explanations.
The Problem: Most Americans have no idea which bills directly affect their healthcare, taxes, education, or daily lives. The data exists, but it's inaccessible.
The Solution: A Hex-powered data app that combines live Congress.gov API data, interactive filtering, network analysis of bipartisan collaboration, and conversational AI (Threads) to make civic engagement accessible to everyone.
✨ Creativity
What Makes This Different
Personalized Civic Intelligence, Not Just Dashboards
Traditional legislative trackers show you all bills or require you to know exactly what you're looking for. Civic Impact Compass flips this: start with who YOU are (your state, your interests) and the relevant legislation surfaces automatically.
Network Science Meets Democracy
I didn't just list bills — I built a bipartisan collaboration network using graph theory. By analyzing co-sponsorship patterns and calculating betweenness centrality, the app identifies "bridge builders" in Congress: legislators who work across party lines to get things done. This reveals a side of politics that partisan media rarely shows.
The App I Wished Existed
As someone who works in public media and civic technology, I've spent years explaining complex information to diverse audiences. I built the tool I wished existed: something that answers "What is Congress doing that affects me?" without requiring a political science degree.
Interactive Problem-Solving
The app adapts to every user:
- Select "Healthcare" + "Wisconsin" → See healthcare bills, your representatives, their collaboration patterns
- Select "Veterans" + "Texas" → Completely different dataset, different insights
- Use Threads to ask "Which bills should small business owners watch?" → AI-powered response grounded in actual data
This isn't a static report — it's a living, interactive analysis that changes based on who's asking.
🛠️ Use of Resources
Hex Platform Features Used
| Feature | How I Used It |
|---|---|
| Notebooks | 15+ interconnected cells: API calls, data processing, visualizations, AI summaries |
| Data Apps | Published interactive app with drag-and-drop layout, responsive design |
| AI Agent | Generated bill deep-dive cards, debugging assistance, code optimization |
| Threads | Enabled conversational Q&A so users can ask natural language questions about legislation |
| Input Parameters | Dropdowns for interest area, state selection, bill status filtering, activity windows |
| Reactive Execution | Cells automatically update when user changes filters — true interactivity |
External Tools & Integrations
| Tool | Purpose |
|---|---|
| Congress.gov API | Live legislative data (bills, members, cosponsors, status) |
| NetworkX | Graph analysis for bipartisan collaboration networks |
| PyVis | Interactive network visualizations with physics-based layouts |
| Plotly | Responsive charts for legislative activity analysis |
| Python Pandas | Data transformation and analysis pipeline |
Technical Implementation Highlights
Live API Integration:
# Real-time data from Congress.gov, not static CSVs
def fetch_congress_data(endpoint, params=None):
    url = f"{BASE_URL}/{endpoint}"
    params = params or {}
    params["api_key"] = CONGRESS_API_KEY
    response = requests.get(url, params=params)
    return response.json()
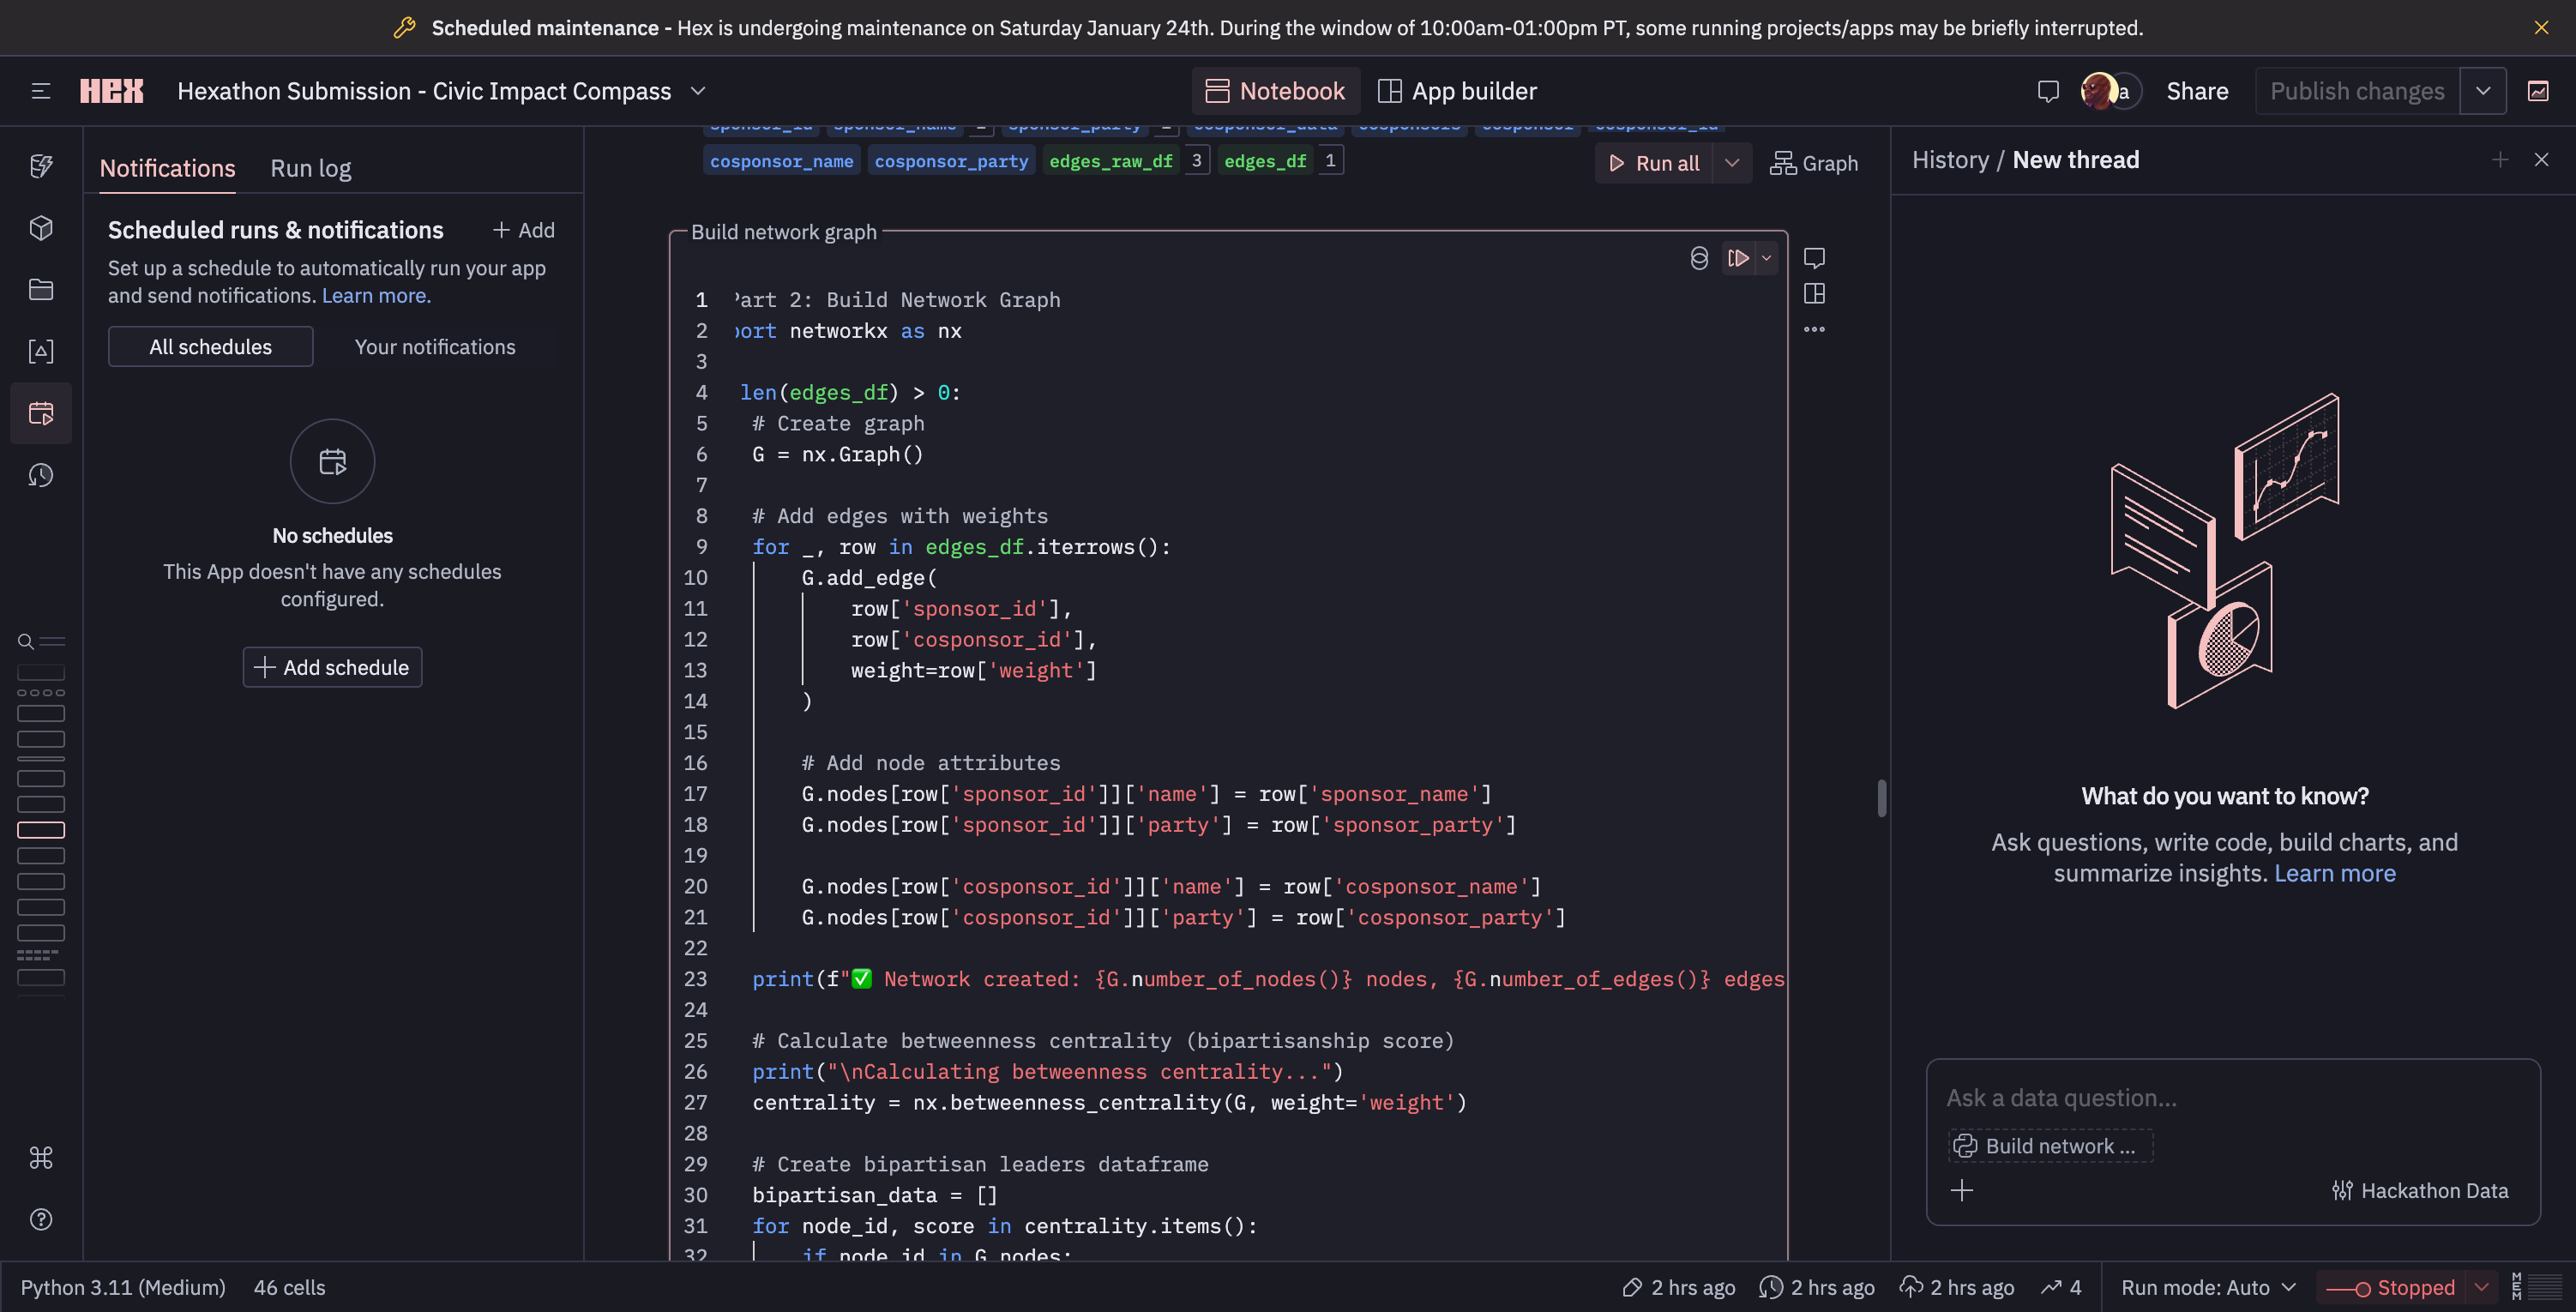
Bipartisan Network Analysis:
# Calculate betweenness centrality to identify bridge-builders
import networkx as nx
G = nx.Graph()
# Add edges for cross-party co-sponsorships
centrality = nx.betweenness_centrality(G)
# Rank legislators by their ability to connect different factions
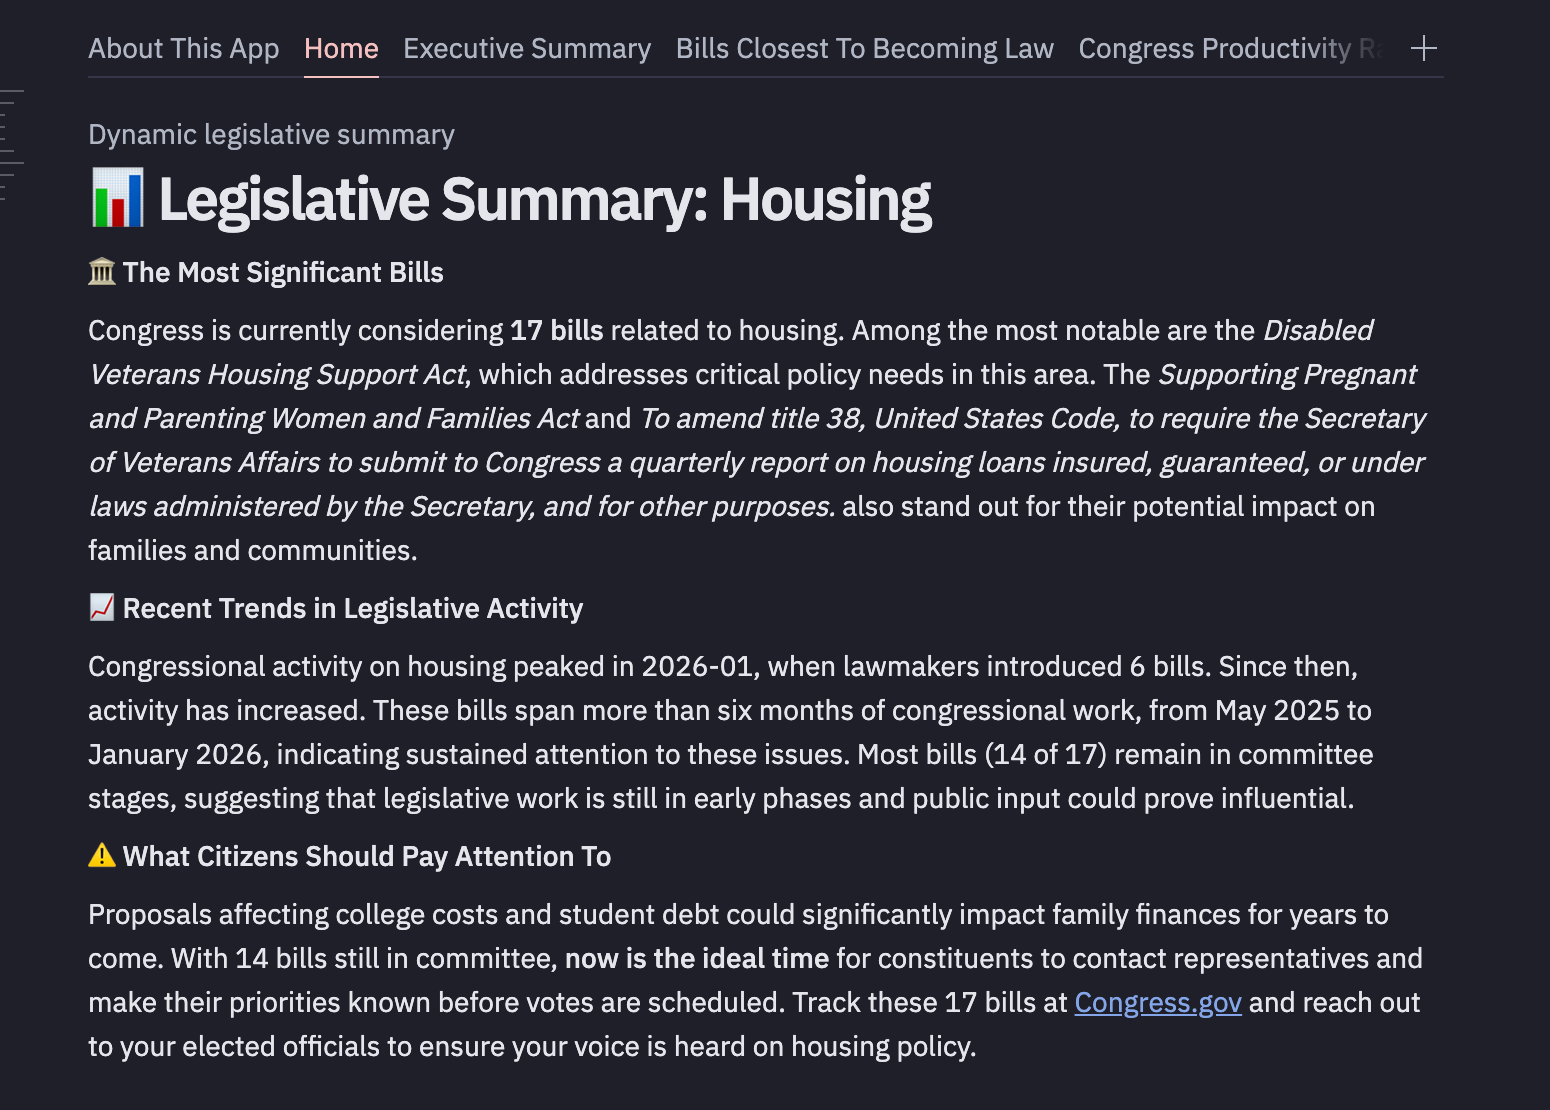
AI-Powered Summaries: The Notebook Agent generates dynamic, plain-language explanations of legislation based on the filtered dataset. Users see different summaries depending on their selected interests — not boilerplate text.
Threads Integration
With Threads enabled, the published app becomes conversational:
- "What bills should I watch if I care about climate?"
- "Who are the most bipartisan members from my state?"
- "Explain HR 1234 in simple terms"
This transforms the app from "view-only" to "ask anything" — exactly what Hex's AI capabilities enable.
📊 Data Storytelling
The Problem (Clearly Stated)
Congress introduces 10,000+ bills every session. Most die in committee. A handful become law. Yet the average citizen has no efficient way to:
- Find bills that affect their specific interests
- Understand what those bills actually do (in plain language)
- Know which representatives are working across party lines
- Track legislation from introduction to law
Result: Civic disengagement. People don't participate because the barrier to entry is too high.
The Solution (Sound Methodology)
Step 1: Live Data Pipeline Pull real-time data from Congress.gov API — bills, members, cosponsors, status updates. No stale CSVs.
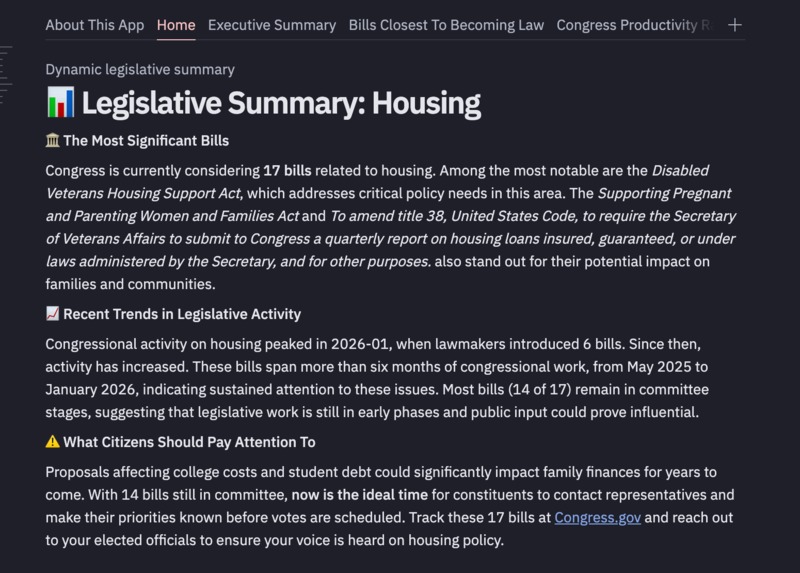
Step 2: Smart Categorization Analyze bill titles and subjects to categorize legislation into citizen-relevant topics: Healthcare, Education, Economy, Environment, Veterans, etc.
Step 3: Personalization Engine Match user inputs (state, interests, activity window) to filter thousands of bills down to the ~10-50 that actually matter to them.
Step 4: Network Analysis Build co-sponsorship graphs to identify bipartisan collaboration patterns. Calculate betweenness centrality to surface "bridge builders" who connect partisan divides.
Step 5: AI Summarization Use the Notebook Agent to generate accessible explanations tailored to the user's filtered dataset.
Step 6: Conversational Interface Enable Threads so users can ask follow-up questions in natural language.
Key Insights Surfaced
The app reveals patterns that traditional legislative trackers miss:
1. Bipartisan Bridge-Builders Network analysis identifies legislators who collaborate across party lines — ranked by betweenness centrality, not just bill count. High centrality = ability to connect different factions.
2. Legislative Productivity Scores Not all bill activity is equal. Sponsoring a bill that becomes law (6× multiplier) matters more than introducing 100 bills that die in committee (1× multiplier). The Enhanced Productivity Score captures real legislative effectiveness.
3. Your Representatives' Activity See exactly what your senators and representatives are sponsoring, co-sponsoring, and how they collaborate with members of the opposing party.
Data Quality & Transparency
- Source: Congress.gov (official government data)
- Freshness: API updates within 24 hours of legislative action
- Methodology: Documented in-app and in appendix
- Error-free: Published project tested across all filter combinations
🎯 Why This Matters
Transparency: Know what Congress is working on without needing a lobbyist.
Engagement: Finding relevant legislation makes it easier to contact your representatives.
Insight: Bipartisan network analysis reveals problem-solvers vs. gridlock contributors.
Accessibility: Plain-language summaries remove the barriers that keep citizens from participating.
🔧 Challenges & Solutions
| Challenge | Solution |
|---|---|
| API Rate Limits (5,000/hour) | Strategic caching — fetch once into DataFrames, work from memory |
| Hex Learning Curve | Used the Agent as a teacher: "How do I make this reactive?" |
| Data Normalization | Built helper functions to handle nested JSON and state name variations |
| Information Overload | Focused on personalization — less is more for engagement |
📈 What's Next
- Cosponsorship Network Graphs: Visualize which legislators work across party lines using interactive network analysis. Identify the "bridge builders" in Congress and surface bipartisan legislation that often gets overlooked.
- Representative Scorecards: Vote records aligned to your priorities
- Embeddable Widgets: For news sites and civic organizations
- Community Layer: Allow users to share their personalized views, comment on bills, and see how others in their district or interest community are engaging with legislation.
🔗 Links
- Public Hex Project: [Insert Published URL]
- Demo Video: Insert YouTube/Vimeo URL
- Data Source: Congress.gov API
Built for Hex-a-thon 2026 | "Build the analysis you wish existed"
Appendix: Understanding the Visualizations
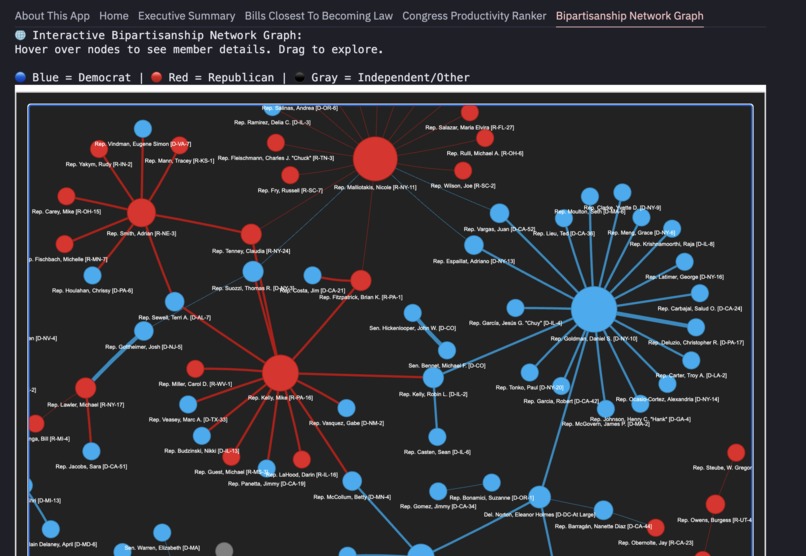
🌐 Bipartisan Network Visualization
What You're Looking At
The network visualization is a relationship map showing how members of Congress work together across party lines.
How to Read It
Circles (Nodes):
- 🔵 Blue = Democrats
- 🔴 Red = Republicans
- ⚫ Gray = Independents
- Size = Collaboration level (bigger = more cross-party work)
Lines (Edges):
- Connect members who co-sponsor the same bills
- Thicker = Multiple shared bills (strong relationship)
- Thinner = Occasional collaboration
Layout: Physics-based positioning pulls frequent collaborators together. Clusters form naturally around working groups.
Key Metric: Betweenness Centrality
We rank bipartisan leaders by how often they act as bridges between different groups:
- High centrality = Bridge builder connecting factions
- Low centrality = Team player within their own party
Interaction
- Hover over circles for member details
- Hover over lines to see shared bill counts
- Drag to explore relationships
- Scroll to zoom
📊 Enhanced Productivity Score
How Members Are Ranked
Base Weight (Role):
- Sponsoring a bill: 3×
- Co-sponsoring a bill: 1×
Multiplier (Bill Advancement):
| Stage | Multiplier |
|---|---|
| ✅ Became Law | 6× |
| 🏛️ With President | 5× |
| 📜 Passed Both Chambers | 4× |
| 🗳️ Passed One Chamber | 3× |
| 📋 On Calendar | 2× |
| ⏭️ Reported from Committee | 1.5× |
| 📝 Introduced | 1× |
Formula:
Score = (Sponsored × 3 × Stage) + (Co-sponsored × 1 × Stage)
Why This Matters: Sponsoring 5 bills that become law scores higher than introducing 100 bills that die in committee. Quality over quantity.
Methodology documentation ensures transparency in how we measure legislative effectiveness.
Built With
- congress-api
- hex.tech

Log in or sign up for Devpost to join the conversation.