# Inspiration
CityUnmasked was inspired by a core question: why do some Syracuse neighborhoods experience both heavy decay and high crime while others with similar decay do not? We wanted a data-driven way to separate assumptions from evidence.
## What it does
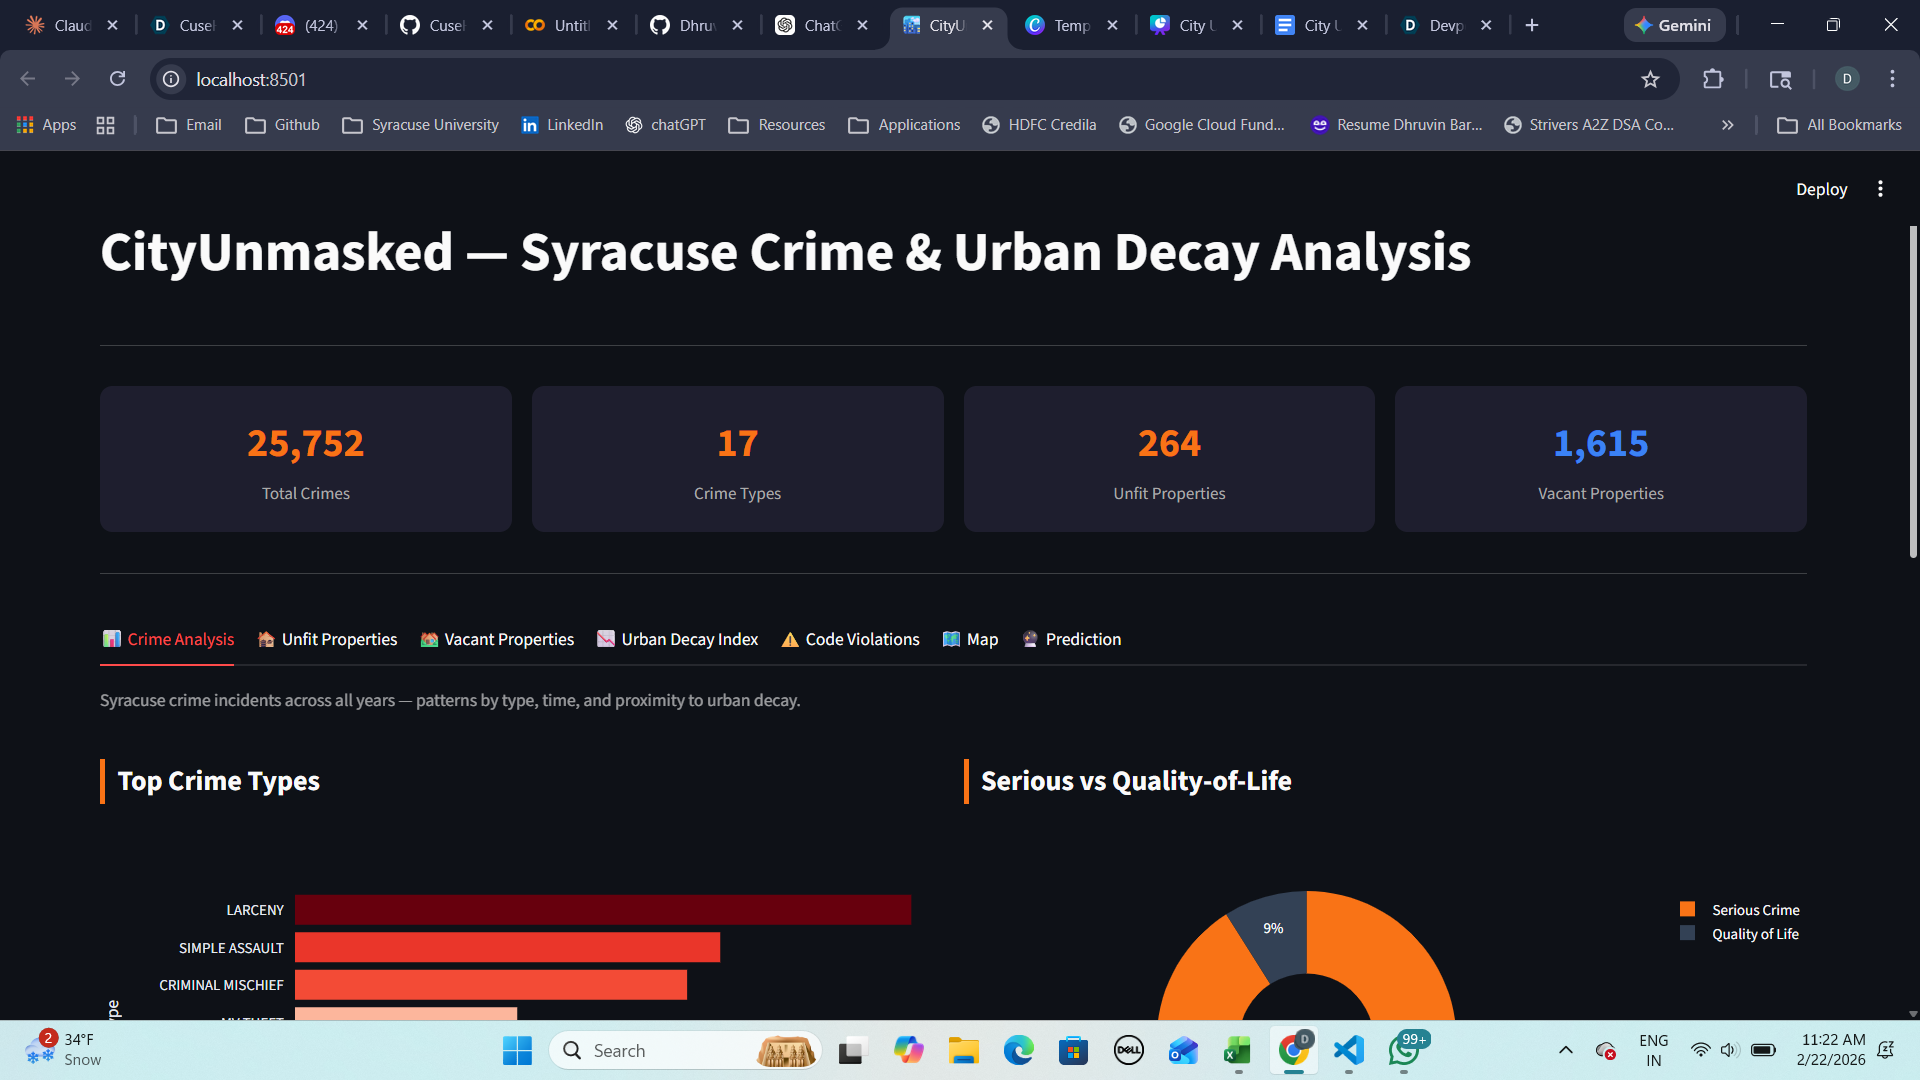
CityUnmasked unifies crime, unfit housing, vacant properties, and code violations into a single analytical framework. It maps hotspots, classifies neighborhoods by decay–crime patterns, and predicts which blocks are likely to become Q4 crime clusters.
## How we built it
We merged and cleaned multi-year city datasets, built spatial joins and decay metrics, created an Urban Decay Index, and trained a logistic regression model using Jan–Sep features to forecast Q4 hotspots. Everything is delivered through a Streamlit dashboard.
## Challenges we ran into
Aligning inconsistent geospatial data, removing duplicates across decades, and designing a model that could generalize across three years were major hurdles. Maintaining dashboard performance with large datasets was another.
## Accomplishments that we're proud of
We produced a unified framework that consistently identifies the same high-risk corridors (13204, 13205, 13208) across all methods and built a predictive model that allows proactive—not reactive—intervention.
## What we learned
Decay and crime are related but not identical; Type B abandonment zones show that blight isn't always crime-driven. We also learned how powerful multi-dataset integration and spatial ML can be for real-world policy.
## What's next for CityUnmasked
Integrating rental registry data, adding monthly forecasting, building parcel-level risk scoring, and deploying a public-facing interactive map for community insight.

Log in or sign up for Devpost to join the conversation.