-
-
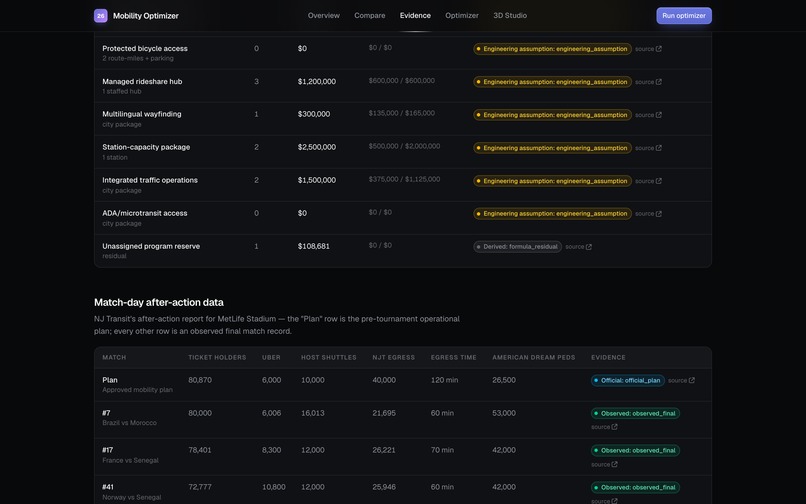
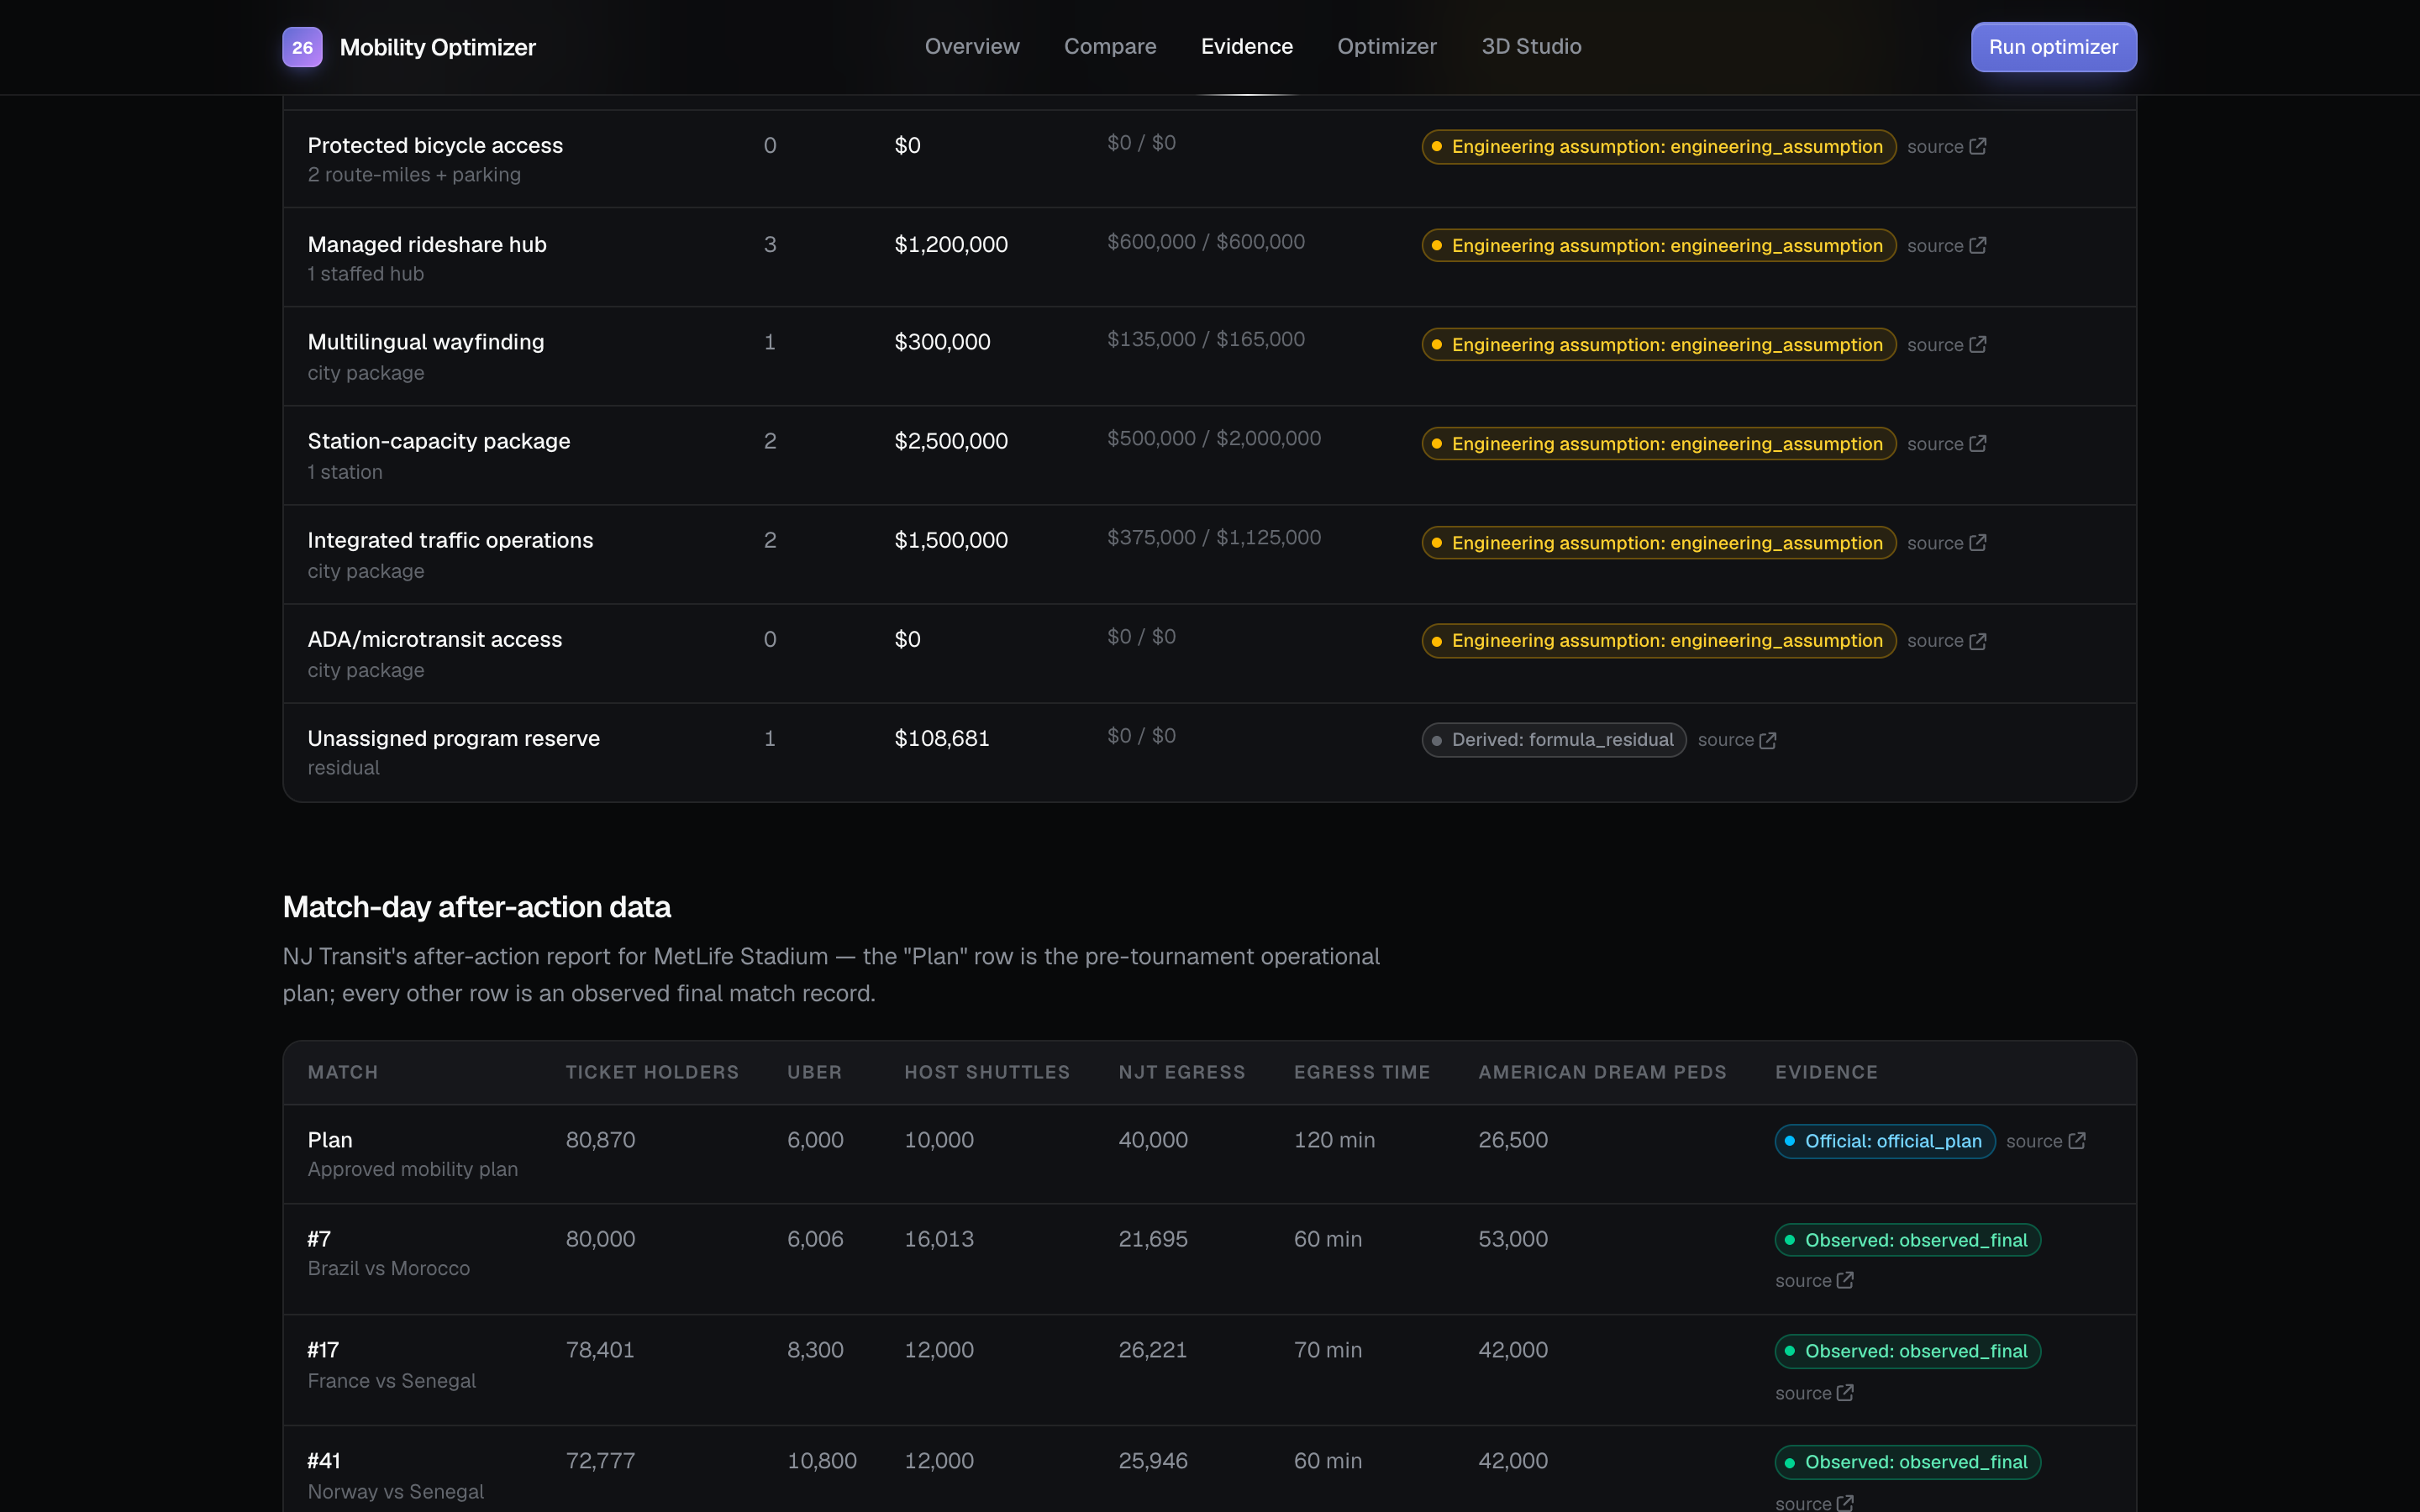
city evidence
-
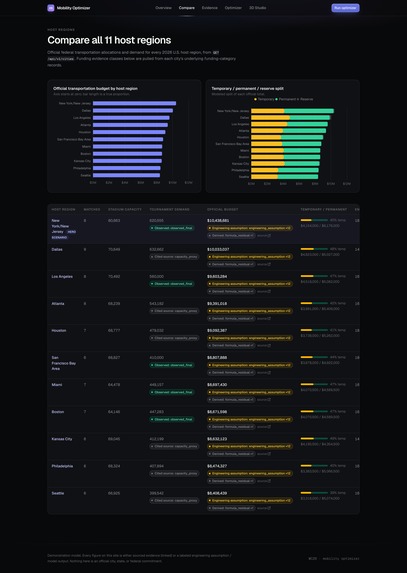
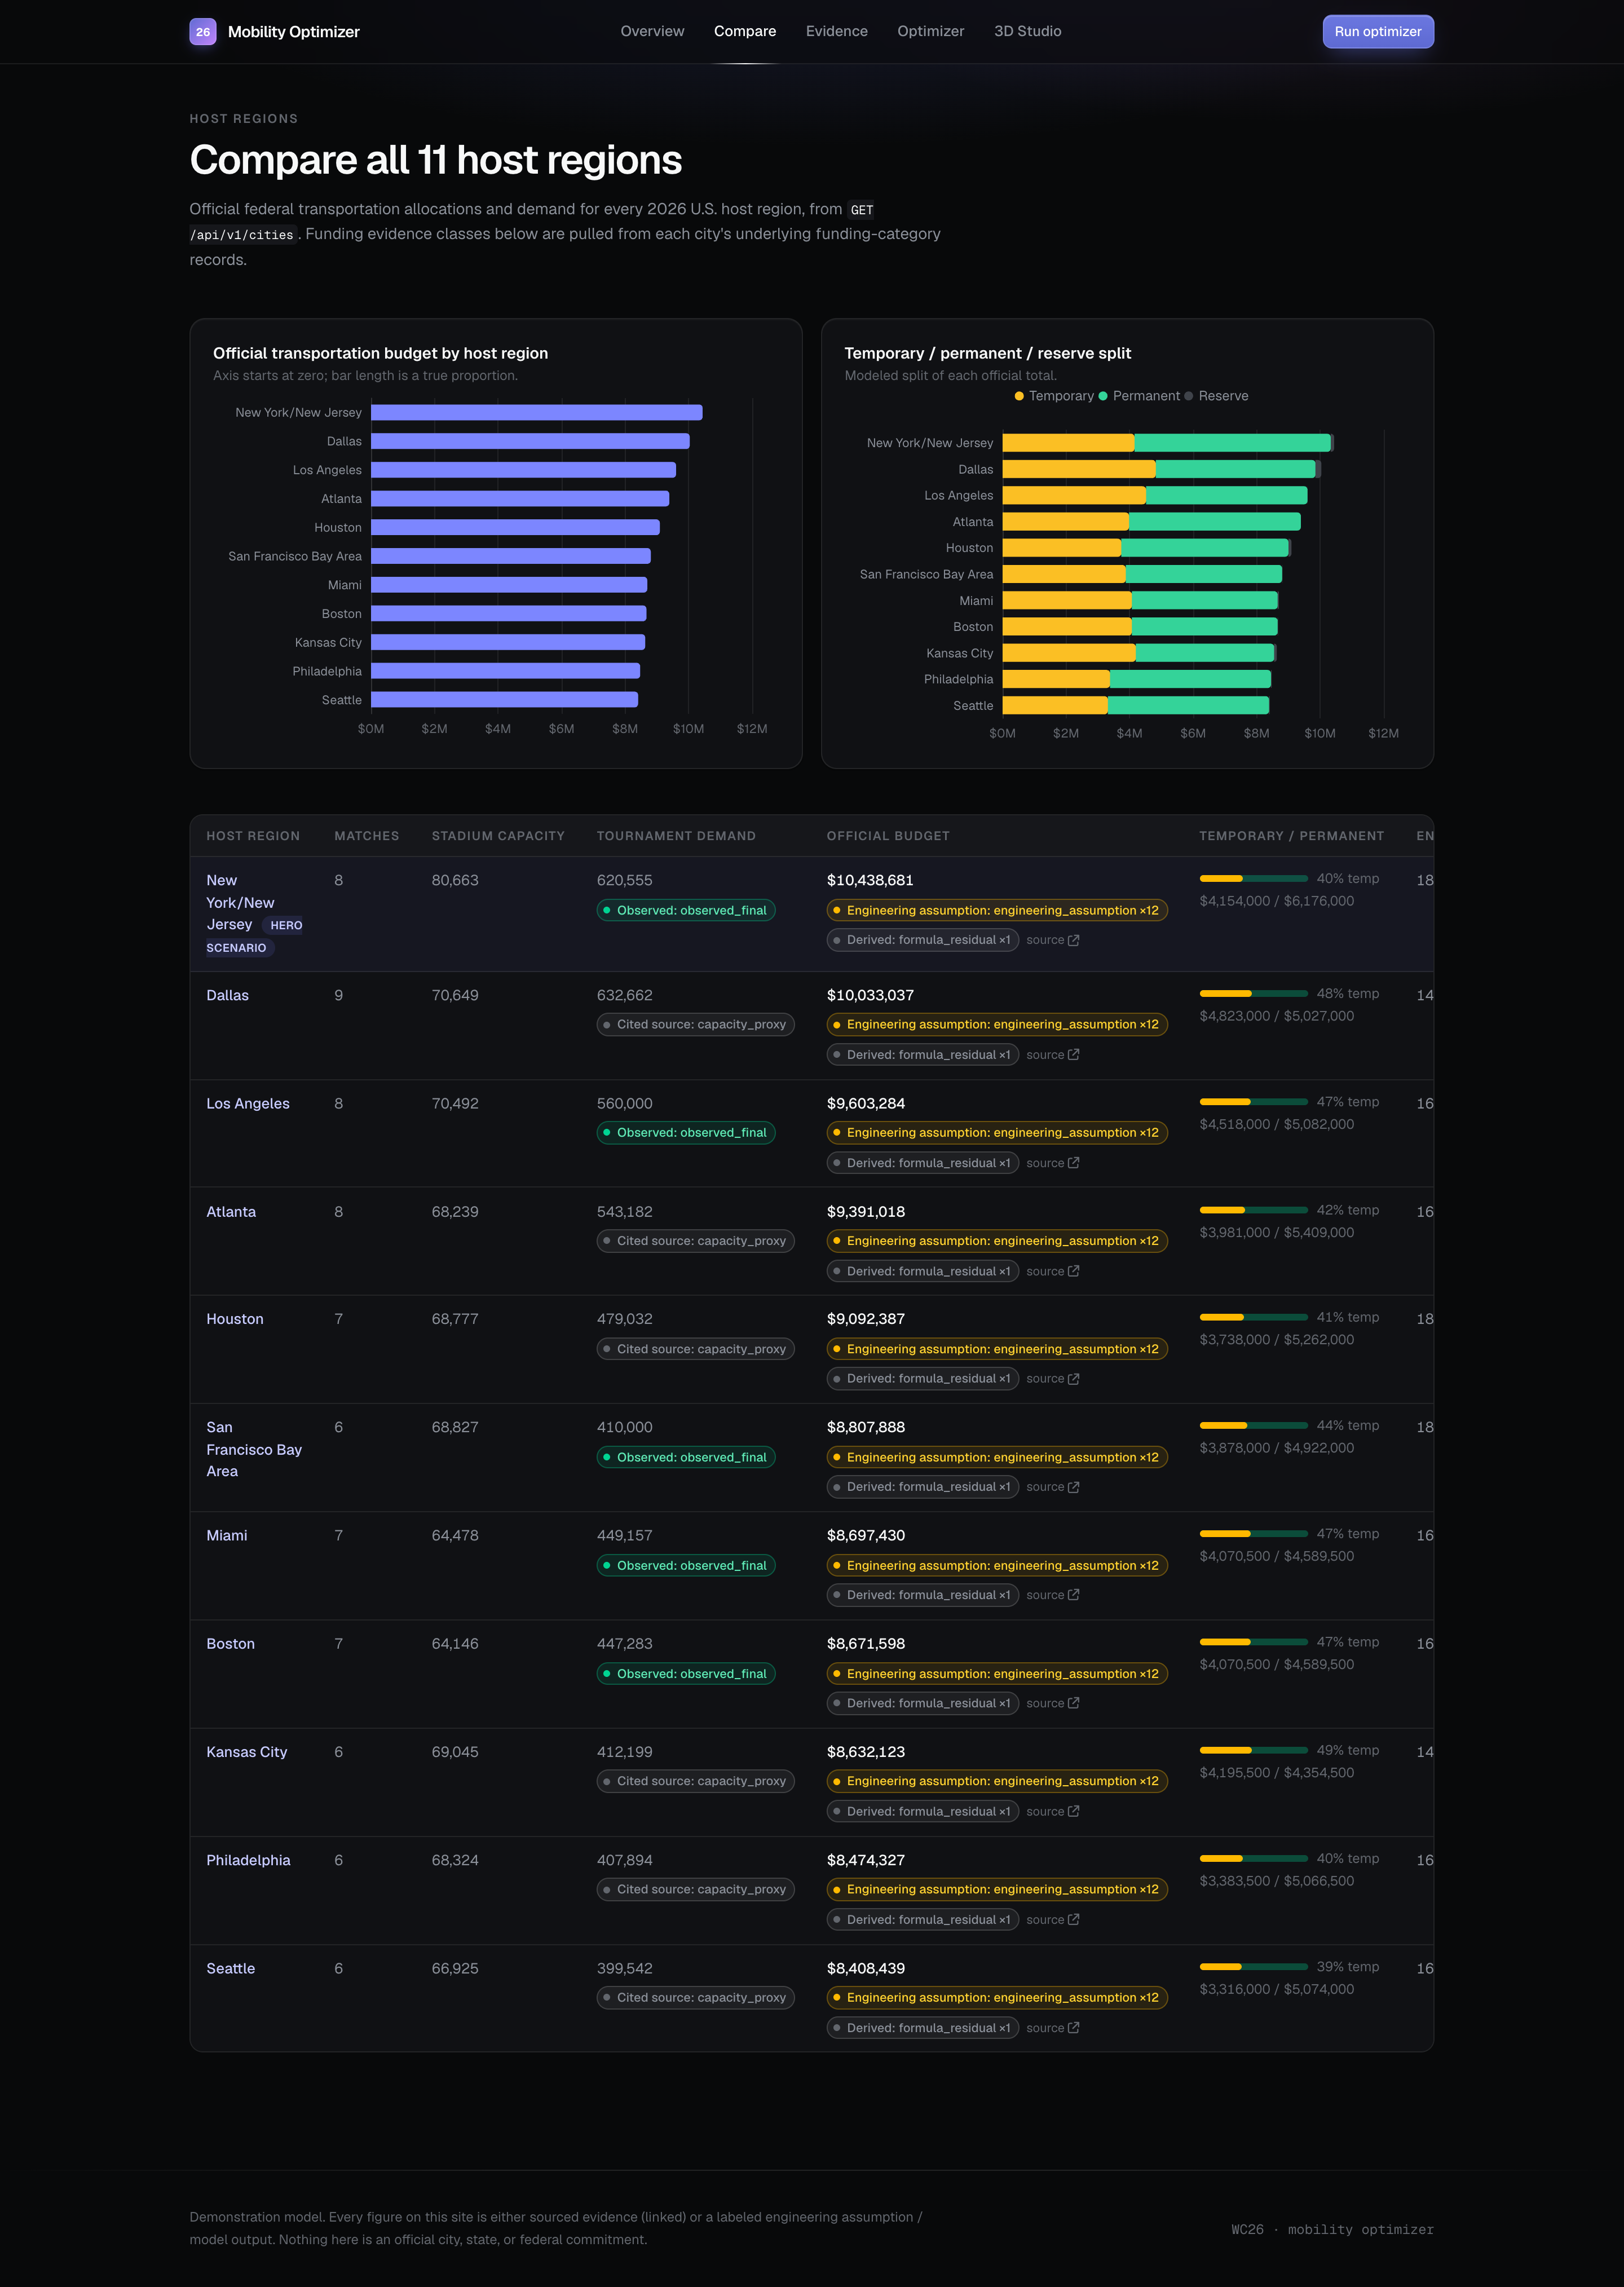
comparing
-
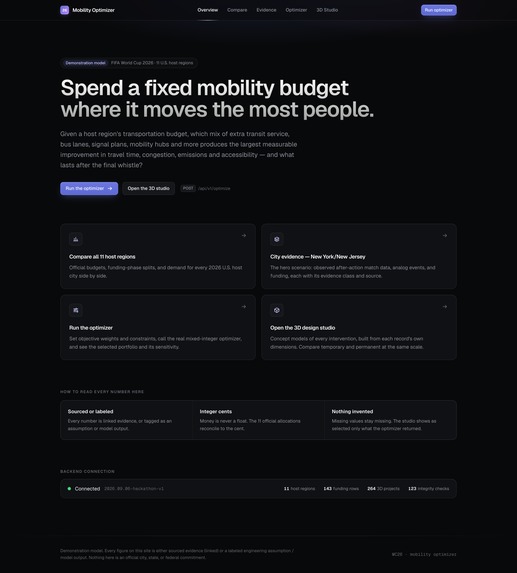
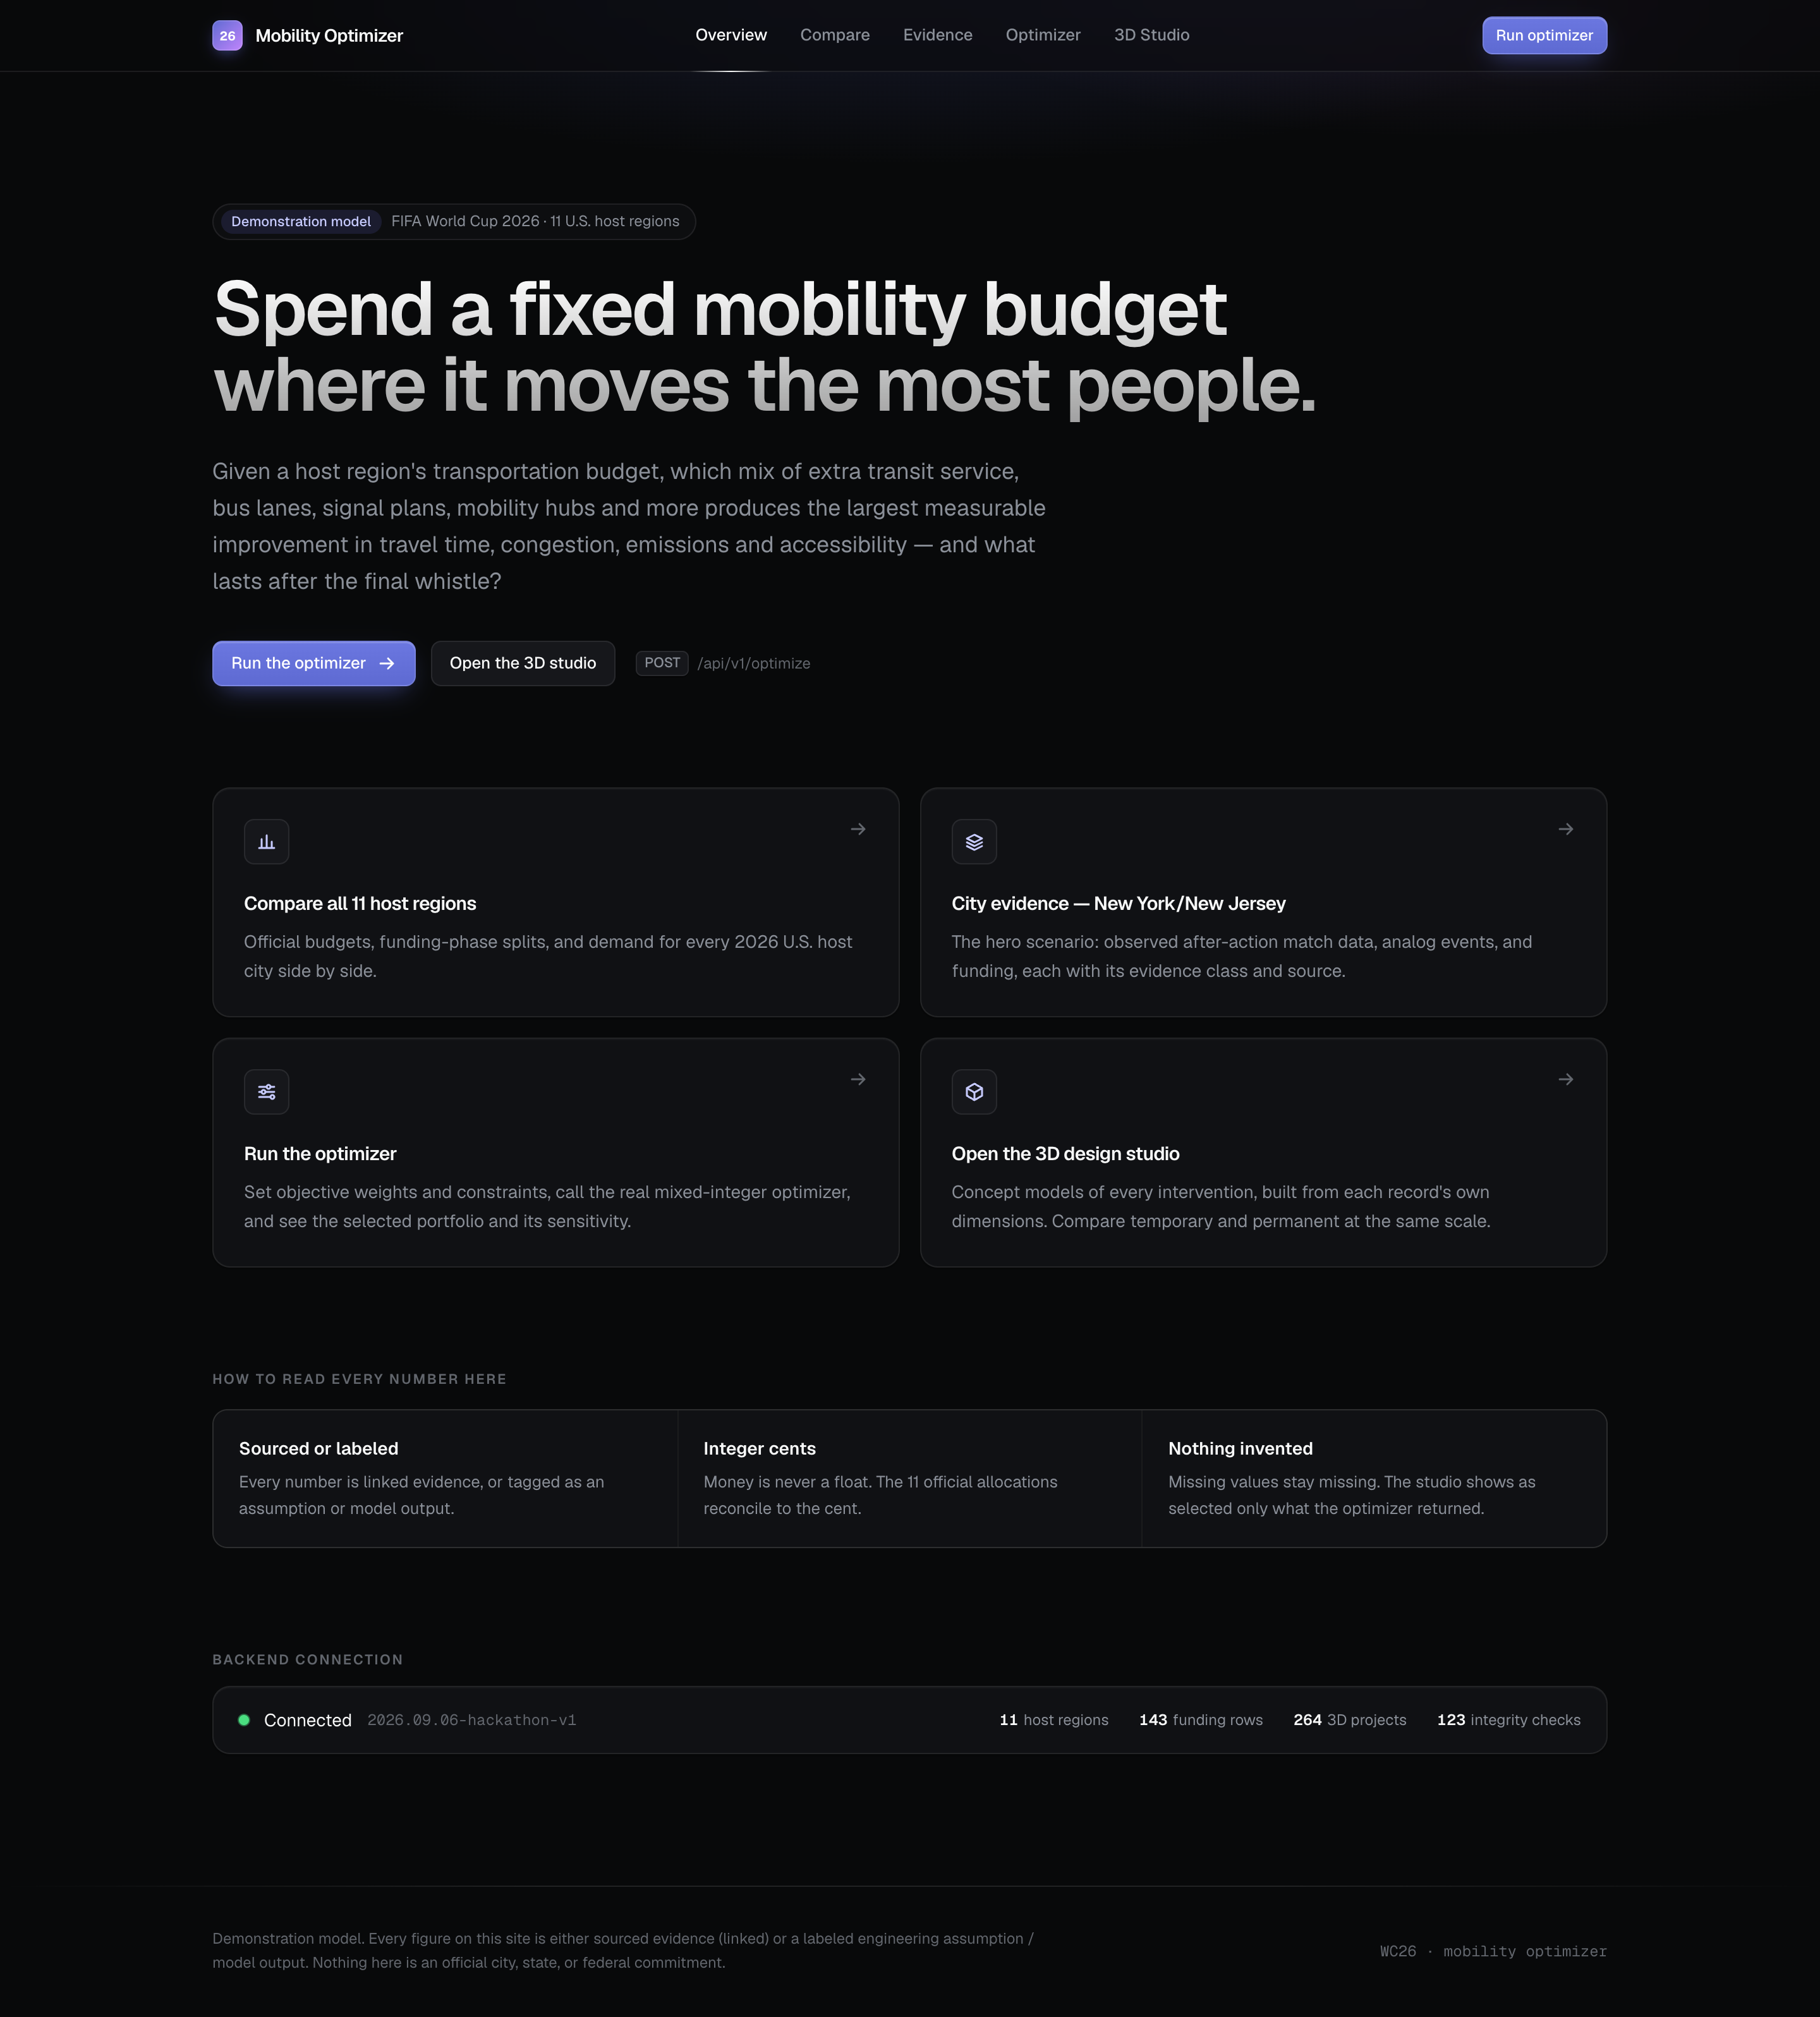
landing
-
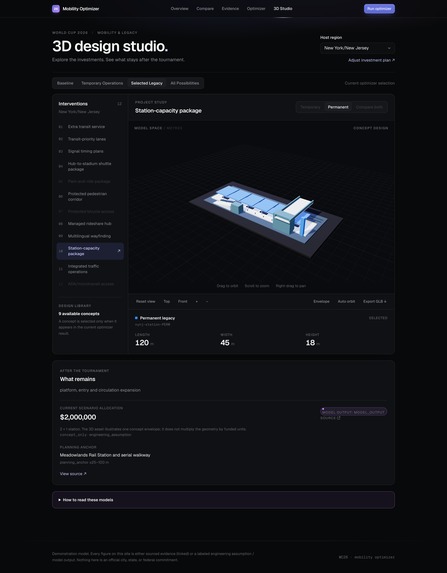
studio
-
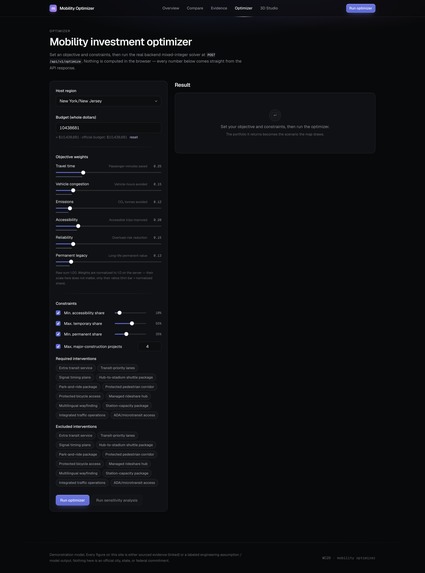
optimizer setup
CityStride: Event Mobility and Legacy Planning
Sarvesh Prabhu and Adityaa Bandaru
Inspiration
Growing up in Atlanta, I have seen how important MARTA is for reaching downtown. On my way to Mercedes-Benz Stadium for the World Cup semifinal, a delayed bus left me wondering whether I would get to the match on time. As the people around me looked confused, I kept asking: Why could not the MARTA app tell me what to do next?
That experience inspired Adityaa and me to think beyond one journey. Better transportation requires intelligent planning and interfaces that help people understand the decisions that affect them.
We built CityStride to explore a broader question: how should a city allocate a limited transportation budget to improve event-day mobility while creating lasting benefits for residents?
What it does
CityStride supports Track 1: Transportation & Access through an interactive planning platform covering 11 U.S. host regions and 12 intervention categories.
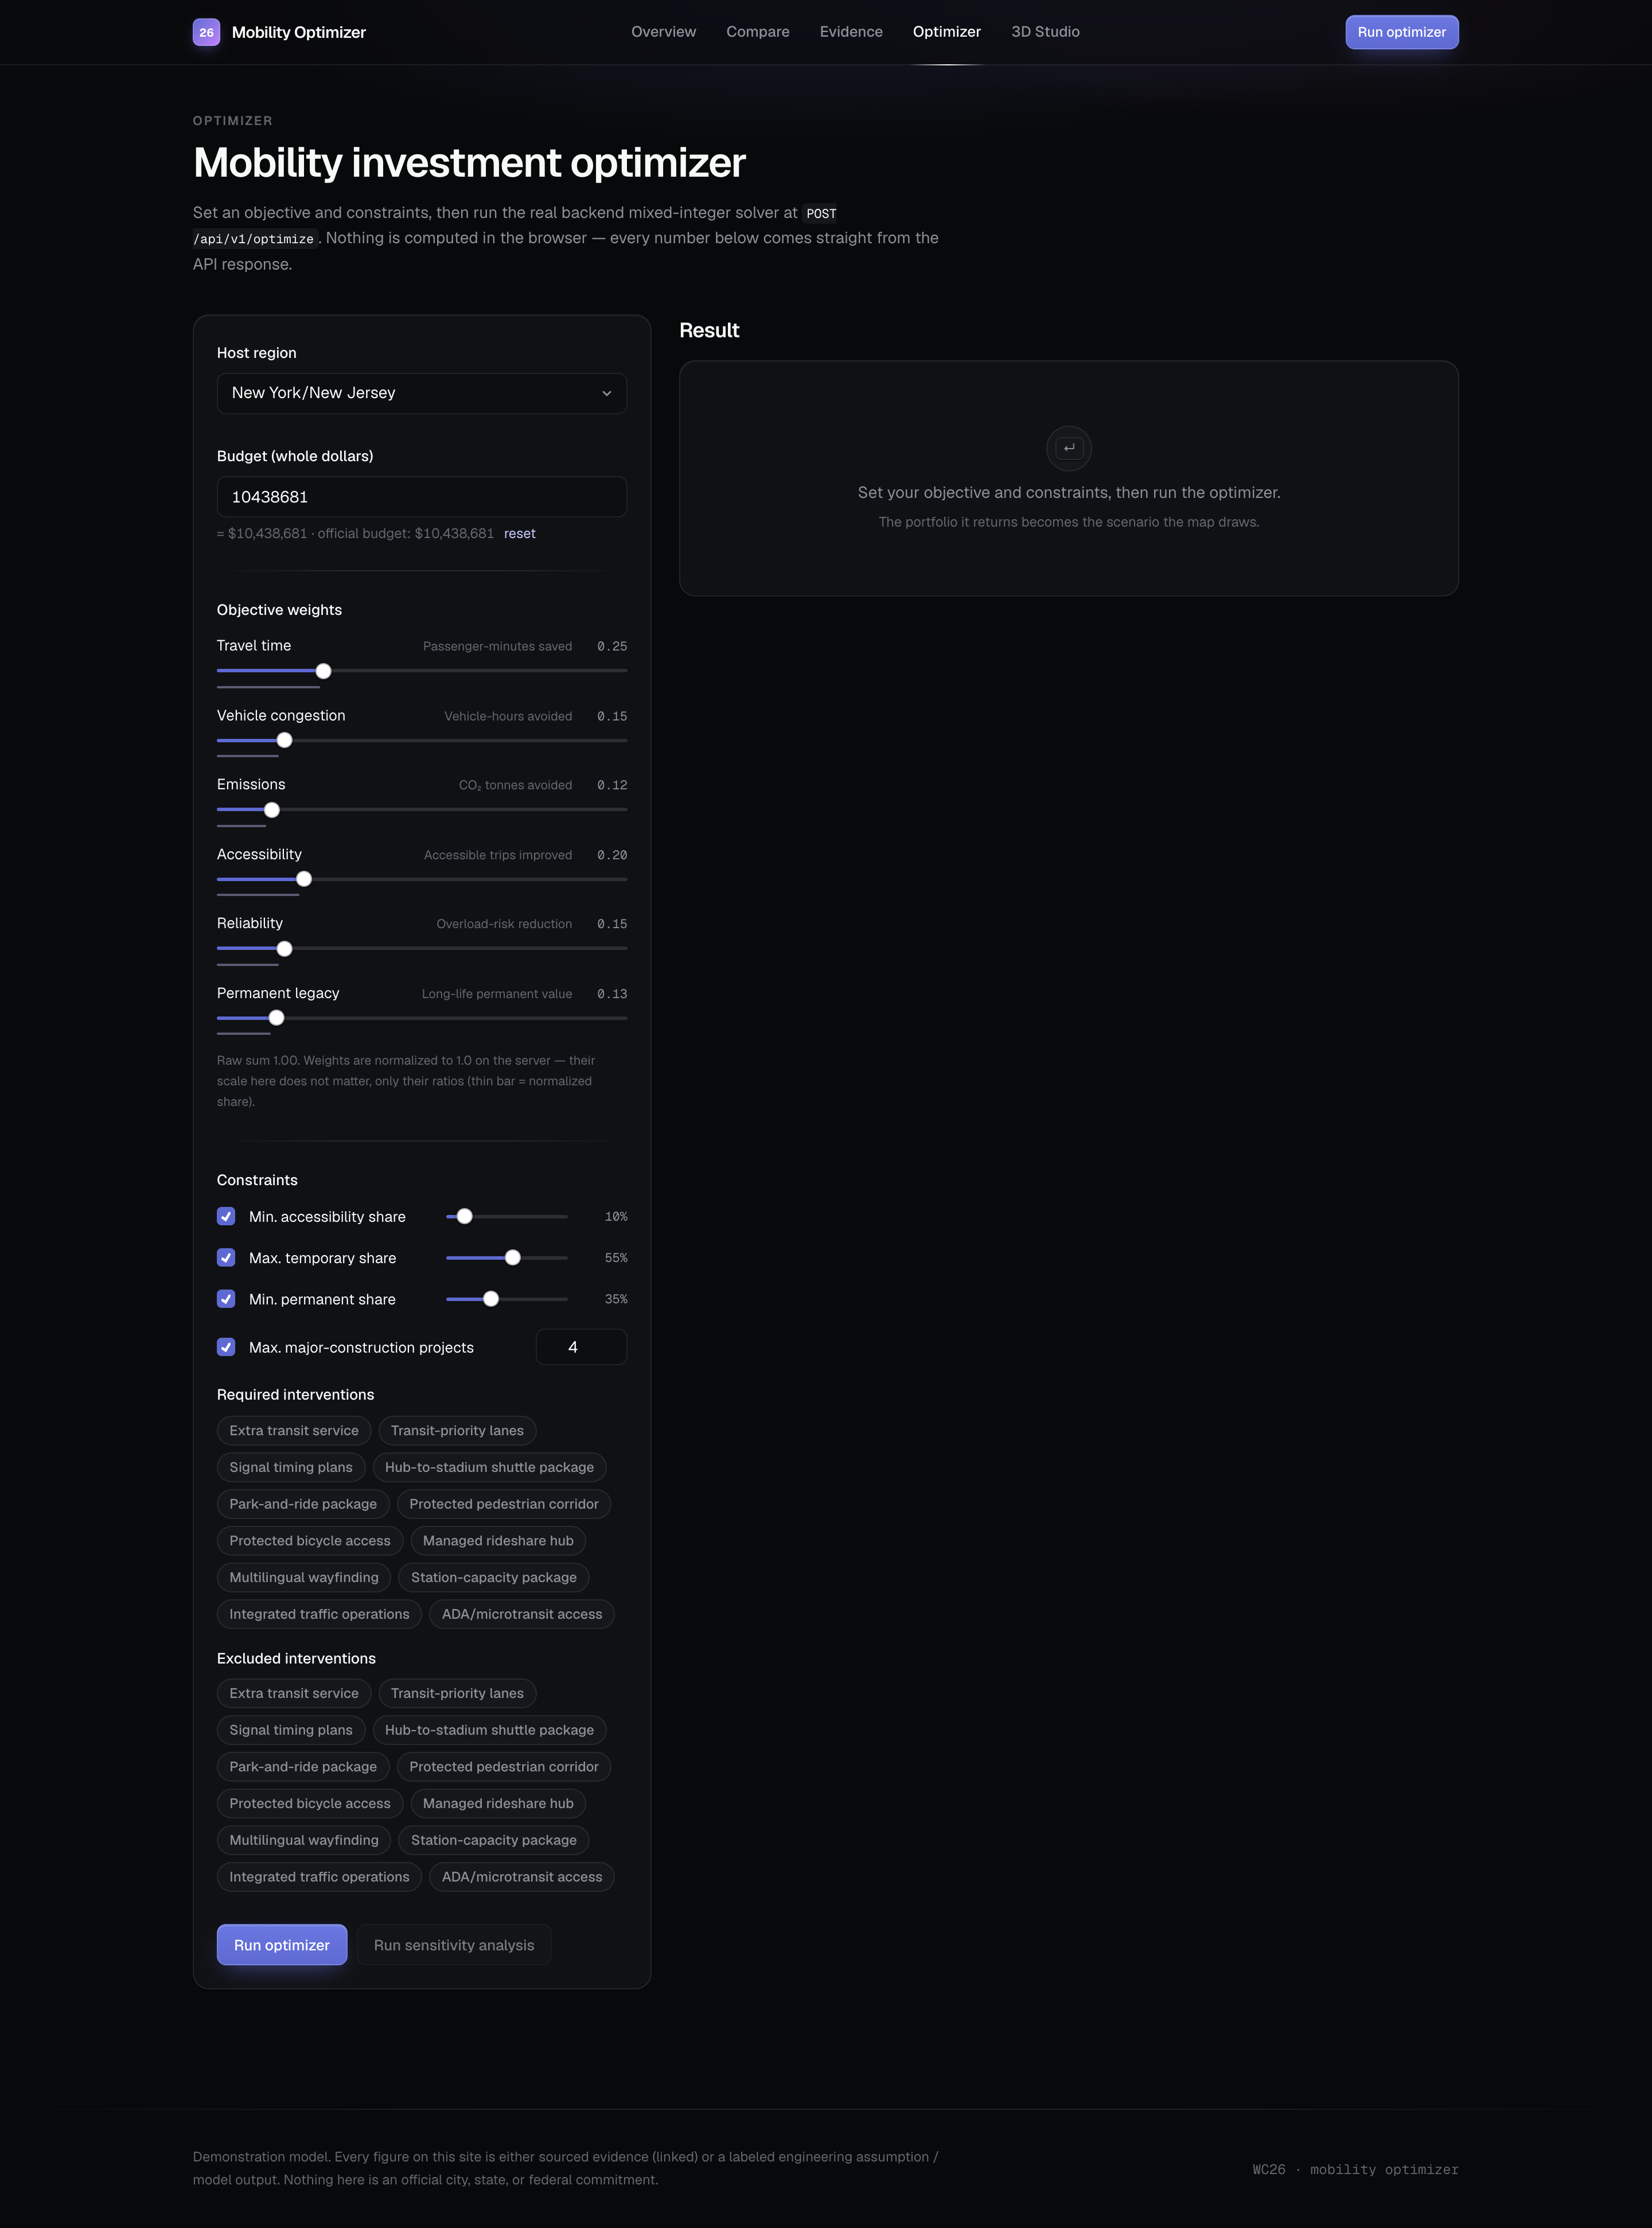
Planners can compare regional evidence, set a budget, and prioritize travel time, congestion, emissions, accessibility, reliability, and permanent infrastructure benefits. The system recommends an investment portfolio and connects the selected projects to maps and three-dimensional concepts.
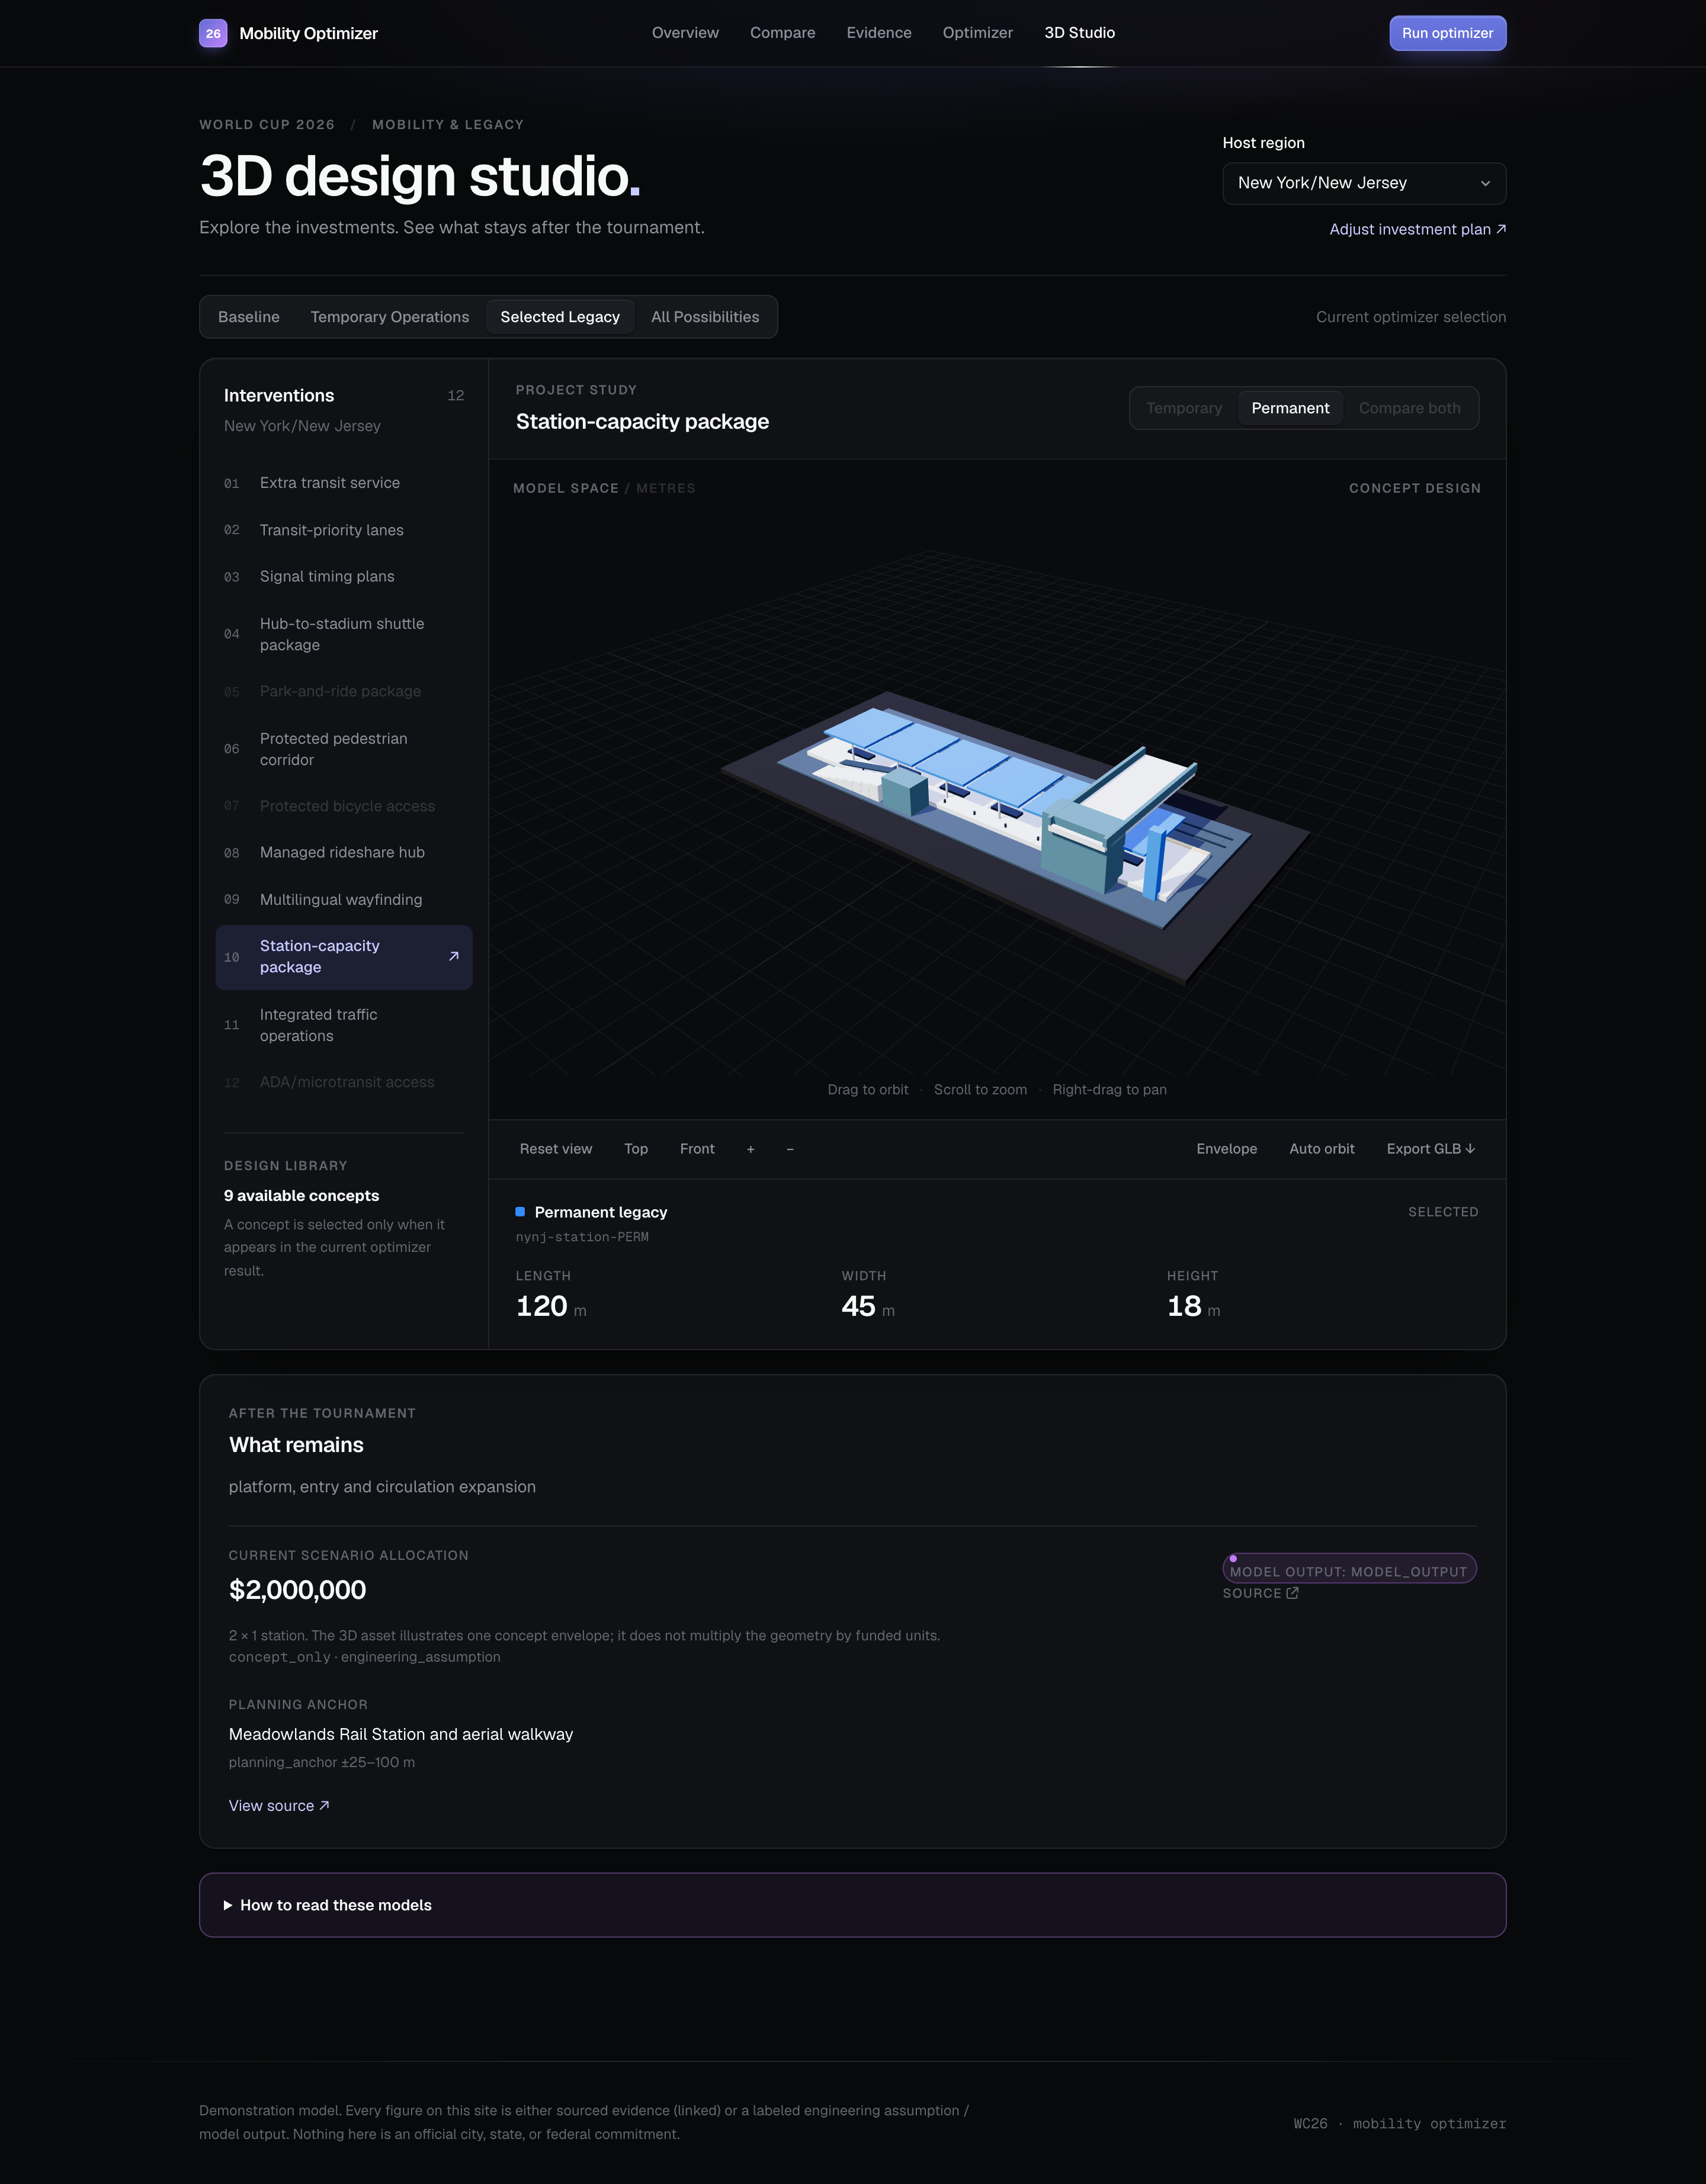
Users can compare temporary and permanent designs on the same scale, making the physical implications of a funding decision easier to discuss. Sensitivity analysis shows how recommendations respond to changing assumptions.
How we built it
Application architecture
Our frontend uses Next.js 16, React 19, TypeScript,
and Tailwind CSS 4. We use TanStack Query
through useQuery and useMutation to
coordinate data retrieval and optimizer requests.
Apache ECharts displays regional comparisons
and sensitivity results.
The backend uses Python, FastAPI, and Pydantic for API endpoints and request validation. NumPy constructs numerical benefit vectors and constraint coefficients.
The optimization engine uses
scipy.optimize.milp, backed by HiGHS,
with Bounds and LinearConstraint
to represent feasible investment decisions.
Mixed-integer portfolio optimization
For intervention category i and marginal unit k,
we define
$$x(i,k)\in{0,1}$$
where x(i,k) = 1 means that unit is funded.
The current formulation contains 37 marginal-unit decision variables and five additional binary variables for complementary intervention pairs.
Let b(i,d) denote the first-unit benefit of intervention
i in dimension d, after applying the model's regional
and demand adjustments. We normalize user priorities:
$$\widehat{w}(d)=\frac{w(d)}{\overset{6}{\underset{r=1}{\sum}}w(r)},\qquad w(d)\geq0,\qquad\overset{6}{\underset{r=1}{\sum}}w(r)>0$$
To represent diminishing returns, successive units receive the benefit factors
$$(\alpha(1),\alpha(2),\alpha(3),\alpha(4),\alpha(5))=(1.00,0.74,0.53,0.37,0.25)$$
Let P contain the complementary intervention
pairs, with pair indicator z(i,j) and complementarity
coefficient gamma(i,j). The objective is
$$\underset{x,z}{\max}\ \overset{6}{\underset{d=1}{\sum}}\frac{\widehat{w}(d)}{D(d)}\left[\overset{12}{\underset{i=1}{\sum}}\ \overset{K(i)}{\underset{k=1}{\sum}}\alpha(k)b(i,d)x(i,k)+\underset{(i,j)\in\mathcal{P}}{\sum}\gamma(i,j)\min(b(i,d),b(j,d))z(i,j)\right]$$
The normalization denominators used in the implementation are
$$D=(200{,}000,\ 8{,}000,\ 50,\ 10{,}000,\ 1.5,\ 3{,}000{,}000)$$
These correspond to passenger-minutes saved, vehicle-hours avoided, tonnes of carbon dioxide avoided, accessible trips improved, reliability-risk reduction in percentage points, and a permanent-legacy proxy. They are modeling choices that make the different benefit dimensions comparable.
Budget and policy constraints
For unit cost c(i) and available budget B, both
represented in cents, the model enforces
$$S=\underset{i,k}{\sum}c(i)x(i,k)\leq B$$
Marginal units must be selected in order:
$$x(i,k+1)\leq x(i,k)$$
Complementarity applies only when both categories receive funding:
$$z(i,j)\leq x(i,1),\qquad z(i,j)\leq x(j,1),\qquad z(i,j)\geq x(i,1)+x(j,1)-1$$
For example, the extra-transit-service and
transit-priority-lane pair uses gamma(i,j) = 0.22.
This is an engineering assumption,
not a measured 22% improvement.
Let p(i) and t(i) denote permanent and temporary spending
shares. Let a(i) indicate whether a category belongs
to the model's accessibility group. Optional policy
constraints include
$$\underset{i,k}{\sum}p(i)c(i)x(i,k)\geq\rho S$$
$$\underset{i,k}{\sum}t(i)c(i)x(i,k)\leq\tau S$$
$$\underset{i,k}{\sum}a(i)c(i)x(i,k)\geq\eta S$$
Here, rho is the minimum permanent share,
tau the maximum temporary share, and eta the
minimum accessibility share. These constrain the mix
of actual spending without requiring the entire budget
to be spent.
Three-dimensional visualization
We use Three.js with
WebGLRenderer and OrbitControls
to render and inspect intervention concepts.
GLTFExporter supports binary GLB exports.
The geometry uses dimensions from supplied project records. For example, the New York/New Jersey station concepts compare
$$120\times45\times6\ \mathrm{metres}\qquad\mathrm{and}\qquad120\times45\times18\ \mathrm{metres}$$
These are illustrative planning concepts rather than surveyed or approved architectural designs.
Challenges we ran into
One challenge was combining heterogeneous benefits without letting their numerical scales dominate the recommendation. We addressed this through explicit normalization and adjustable objective weights.
Another was representing long-term value without claiming a fully validated lifecycle forecast. Our legacy dimension uses
$$b(i,\mathrm{legacy})=b(i,\mathrm{passenger\ minutes})\,p(i)\,L(i)$$
where L(i) is the intervention's assumed useful life.
This is a prioritization proxy, not a discounted
economic valuation.
We also needed consistent financial accounting. After solving, we recompute allocations from integer quantities and integer-cent costs:
$$C^{\mathrm{perm}}(i)=C^{\mathrm{total}}(i)-C^{\mathrm{temp}}(i)$$
Assigning the permanent allocation as the remainder preserves exact reconciliation after rounding.
Finally, we needed the interface to distinguish source evidence, engineering assumptions, and model outputs. The map's selected projects come from the optimizer response, keeping visual recommendations tied to the computed portfolio.
Accomplishments that we're proud of
We connected regional comparison, constrained optimization, sensitivity analysis, and interactive 3D visualization in one planning workflow.
In the default New York/New Jersey scenario, the model produces:
- Available budget: $10,438,681
- Allocated spending: $10,330,000
- Permanent allocation: $6,176,000
- Unspent balance: $108,681
The permanent share of allocated spending is
$$\frac{6{,}176{,}000}{10{,}330{,}000}\times100\approx59.8\%$$
The same scenario estimates approximately 6.35 minutes saved per attendee and 791.54 tonnes of carbon dioxide avoided. These are reproducible model outputs based on engineering assumptions, not measured field results.
The repository includes pytest backend tests and Vitest, React Testing Library, and Mock Service Worker (MSW) frontend tests covering API behavior, scenario handling, and interface states.
What we learned
We learned how binary integer programming, weighted multiobjective optimization, marginal returns, and sensitivity analysis translate a broad sustainability goal into explicit decisions.
Our sensitivity analysis changes one assumption axis at a time. It tests attendance at ±20%, budget at ±25%, intervention costs at ±20%, and alternative transit-capacity and visitor-usage assumptions.
Across 15 evaluated points, including a baseline point on each of the five axes, eight changed the recommended portfolio in the default New York/New Jersey scenario.
We also learned to recognize the model's limits. Attendance currently scales benefits uniformly, so changing it alone does not change the investment ranking. Transit capacity and visitor usage share a simplified productivity mechanism rather than a detailed network assignment model.
These findings reinforced the importance of making assumptions understandable alongside the recommendations.
What's next for CityStride
Our next step is to calibrate intervention costs and benefit coefficients with transportation agency data, then evaluate a pilot at one venue.
We want to develop more detailed visitor-movement modeling and identify gaps between transit stops and event destinations. Future work could incorporate network assignment and distinguish transportation supply from visitor demand more explicitly.
Beyond the World Cup, we hope to adapt CityStride for concerts, other sporting events, and recurring infrastructure decisions. The goal is to turn the frustration of one delayed bus into better everyday mobility for cities like Atlanta.
Built With
- echarts
- eslint
- fastapi
- highs
- javascript
- msw
- next.js
- node.js
- numpy
- pydantic
- pytest
- python
- react
- scipy
- tailwind-css
- tanstack-query
- testing-library
- three.js
- typescript
- uvicorn
- vitest


Log in or sign up for Devpost to join the conversation.