-

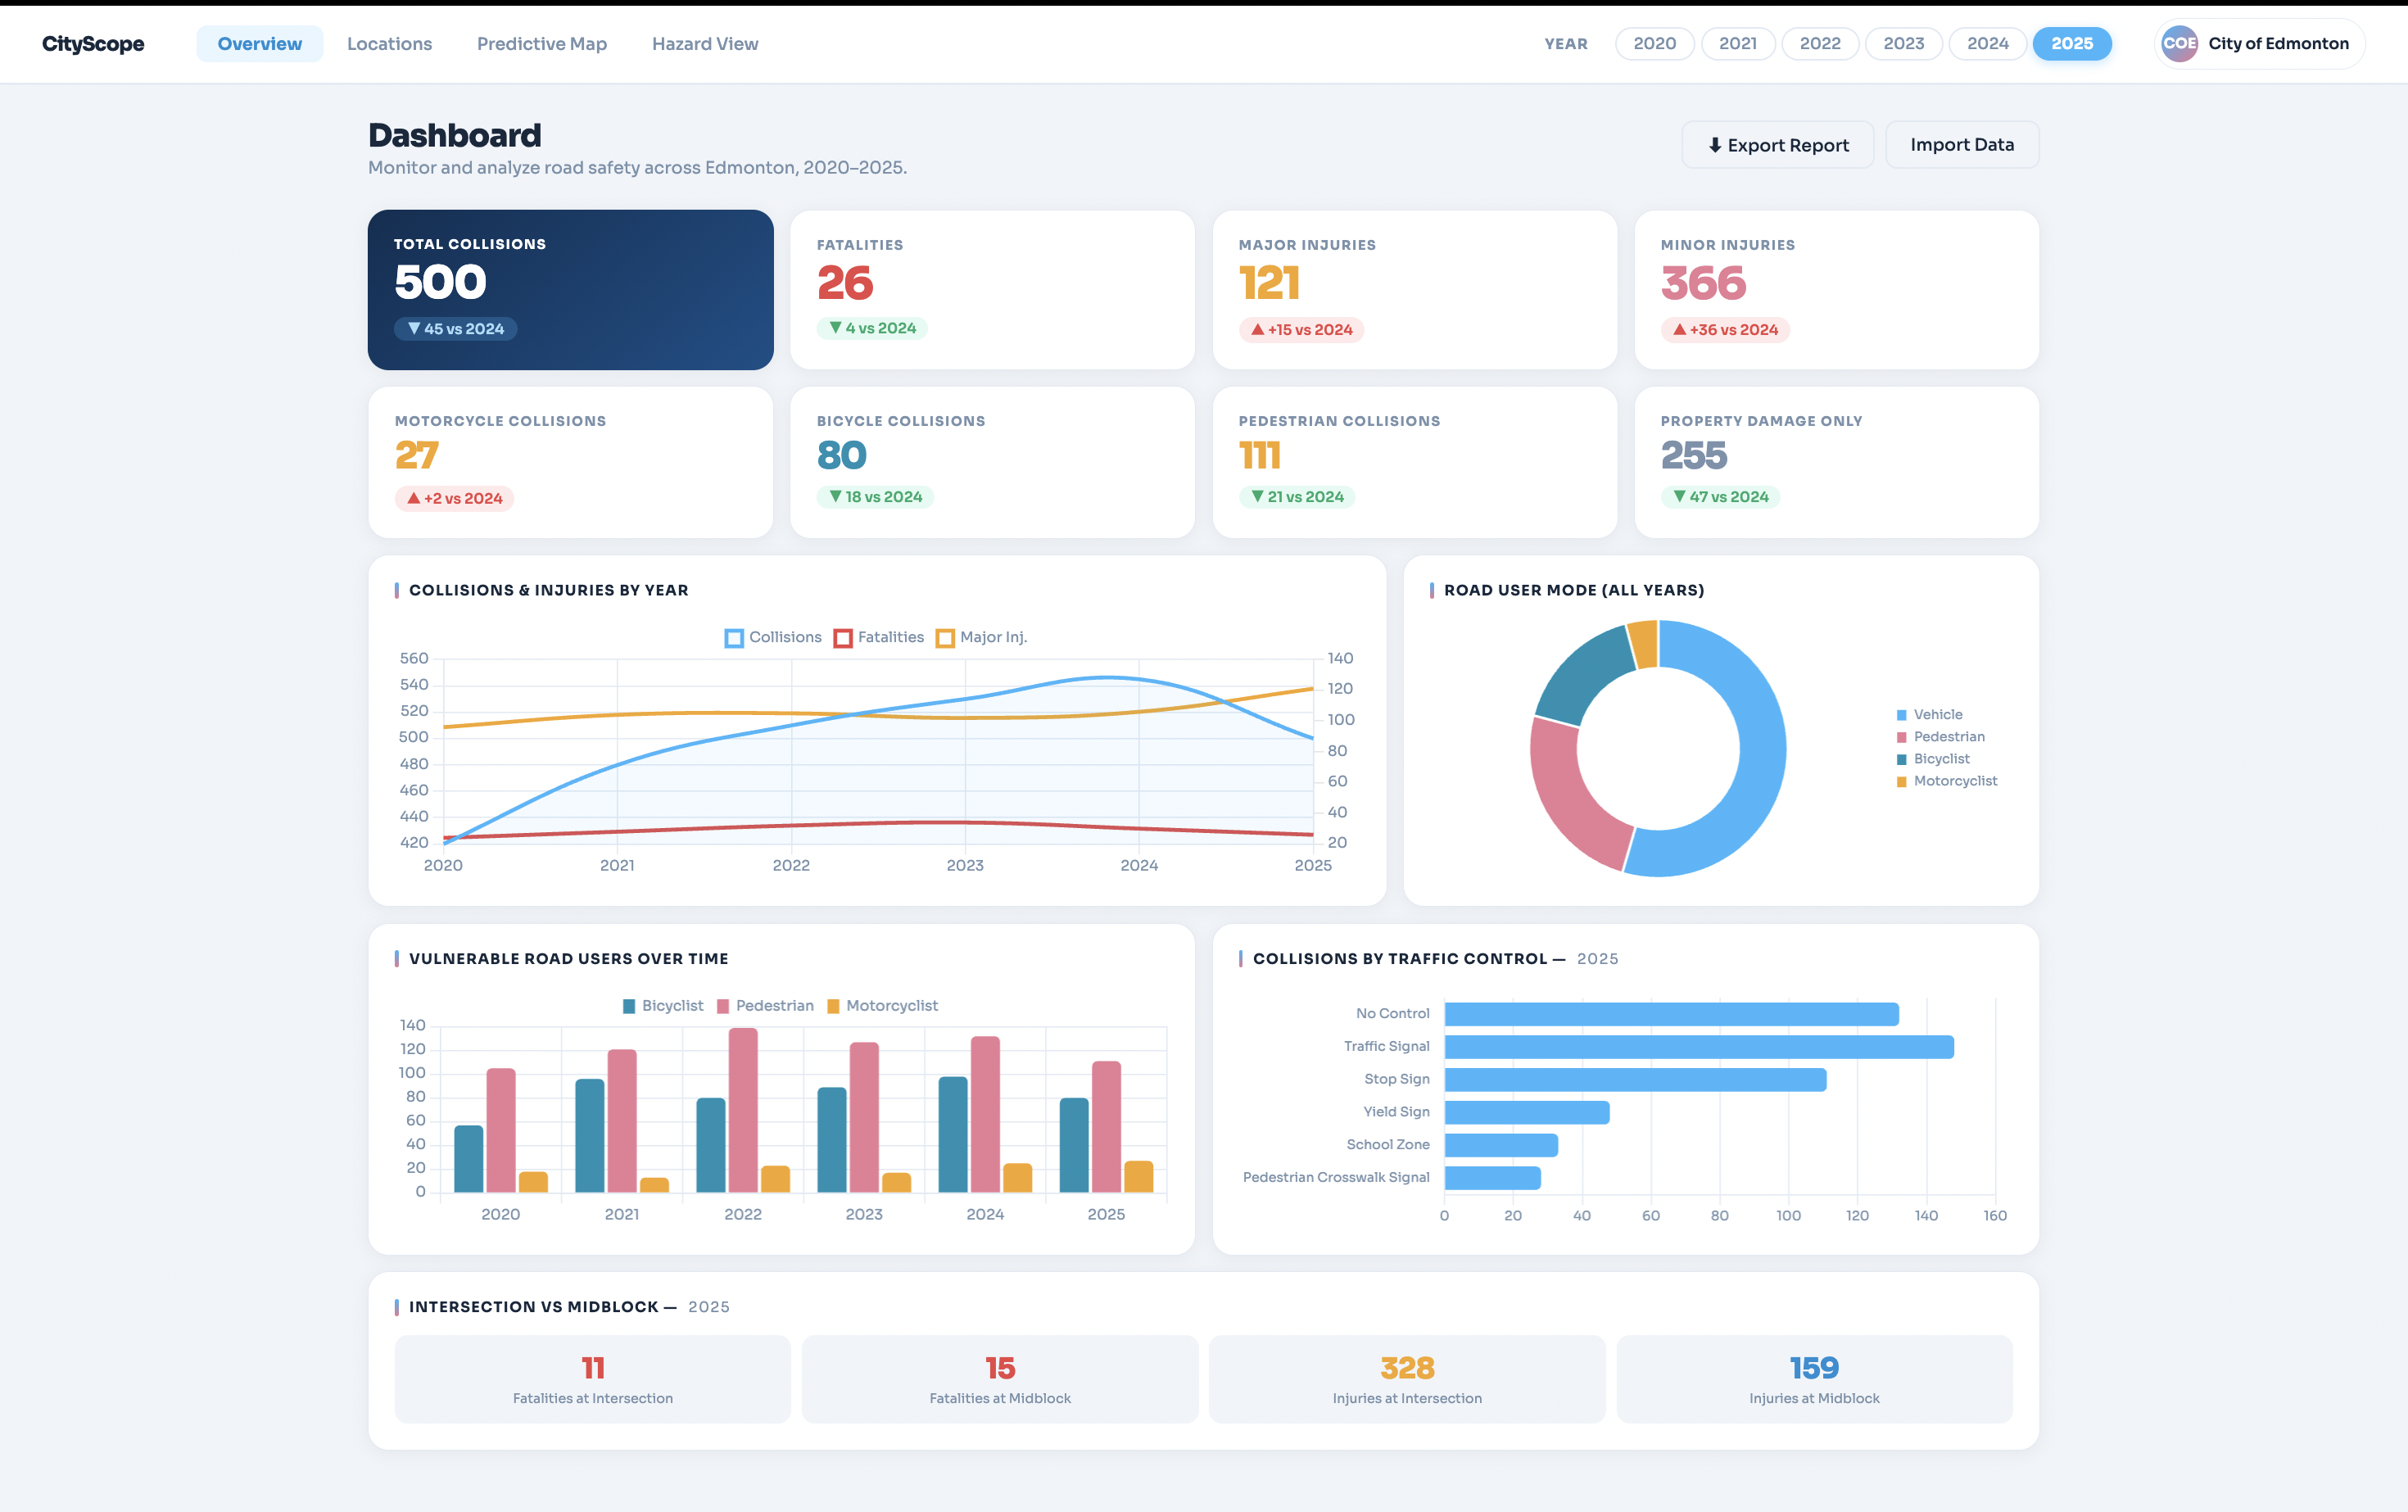
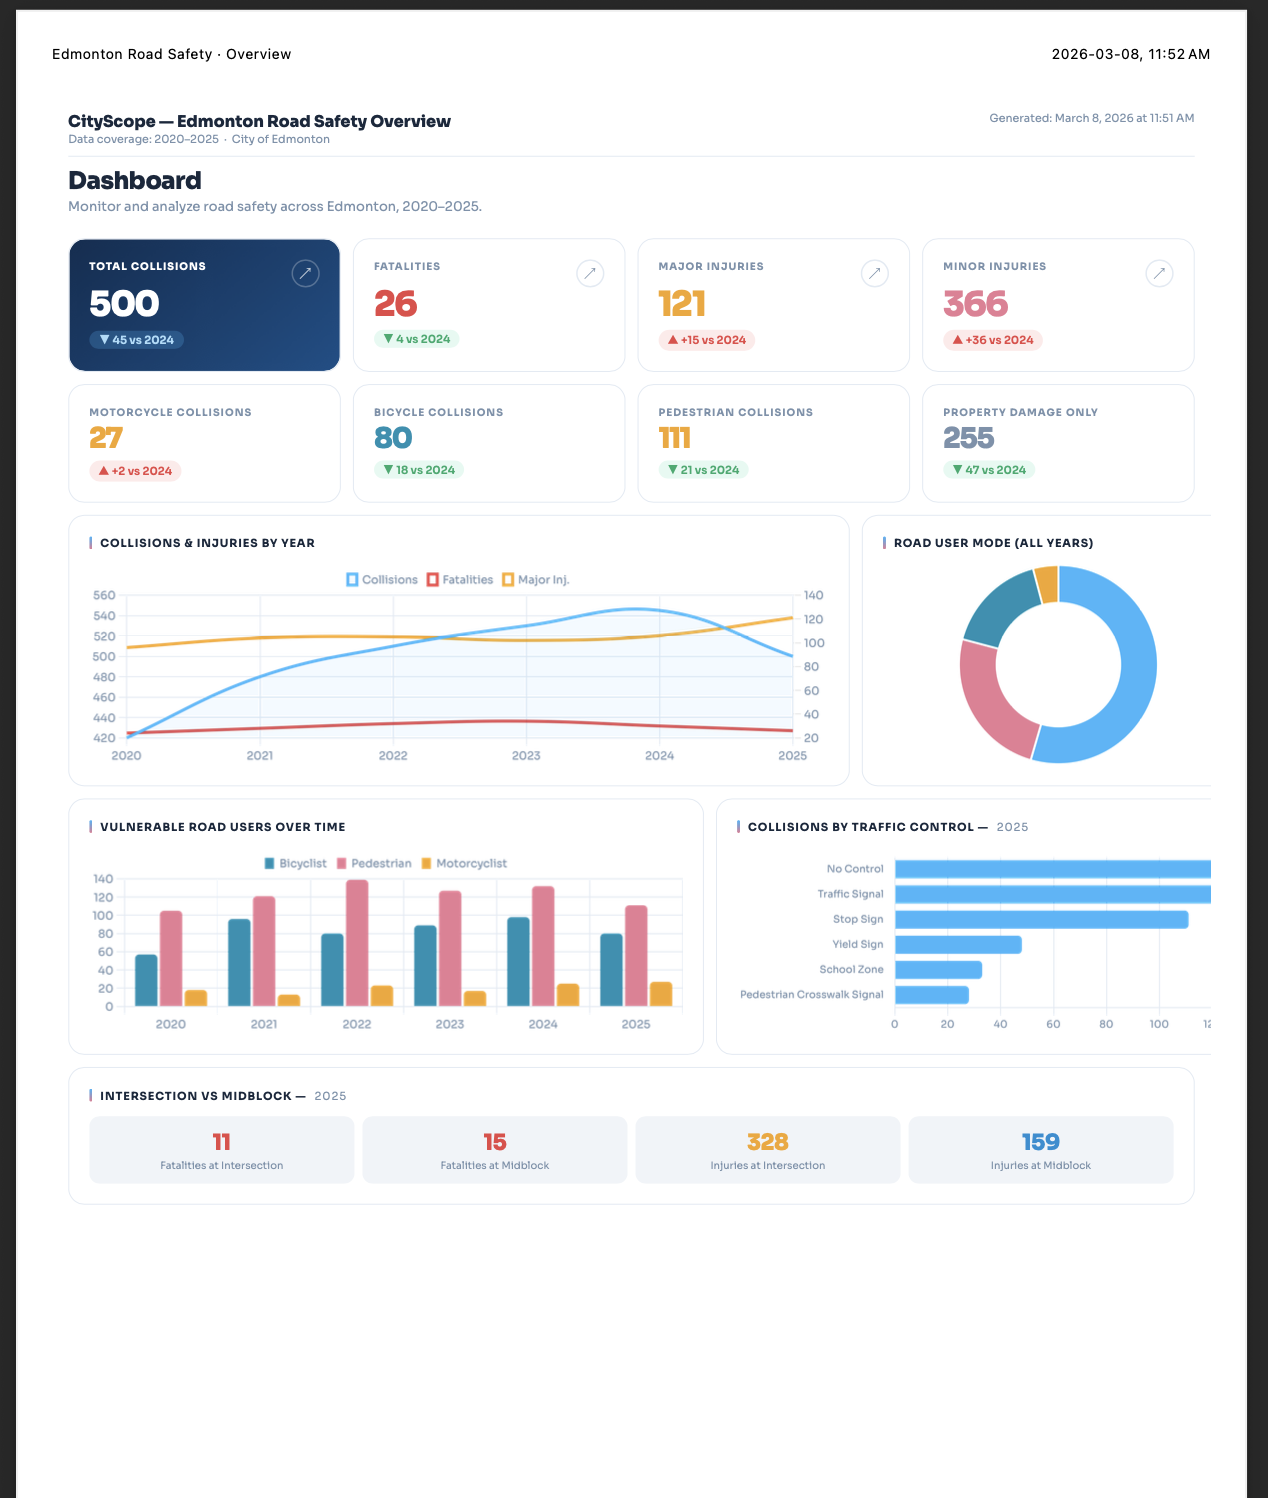
Dashboard/Overview
-
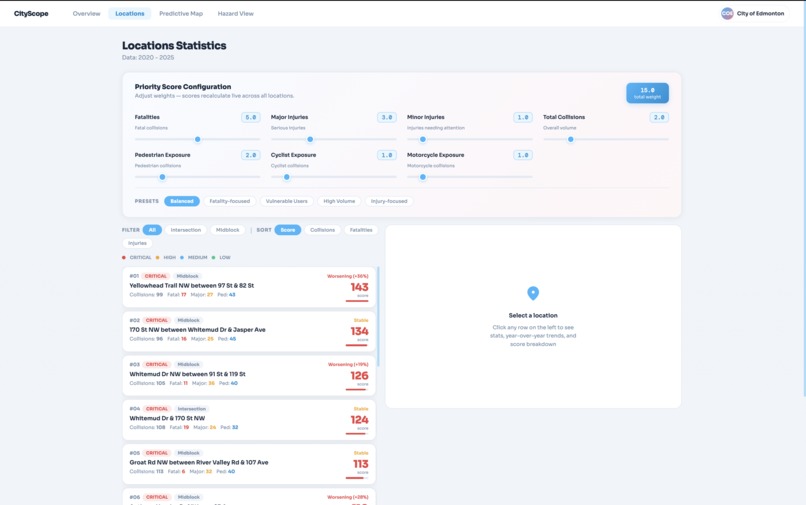
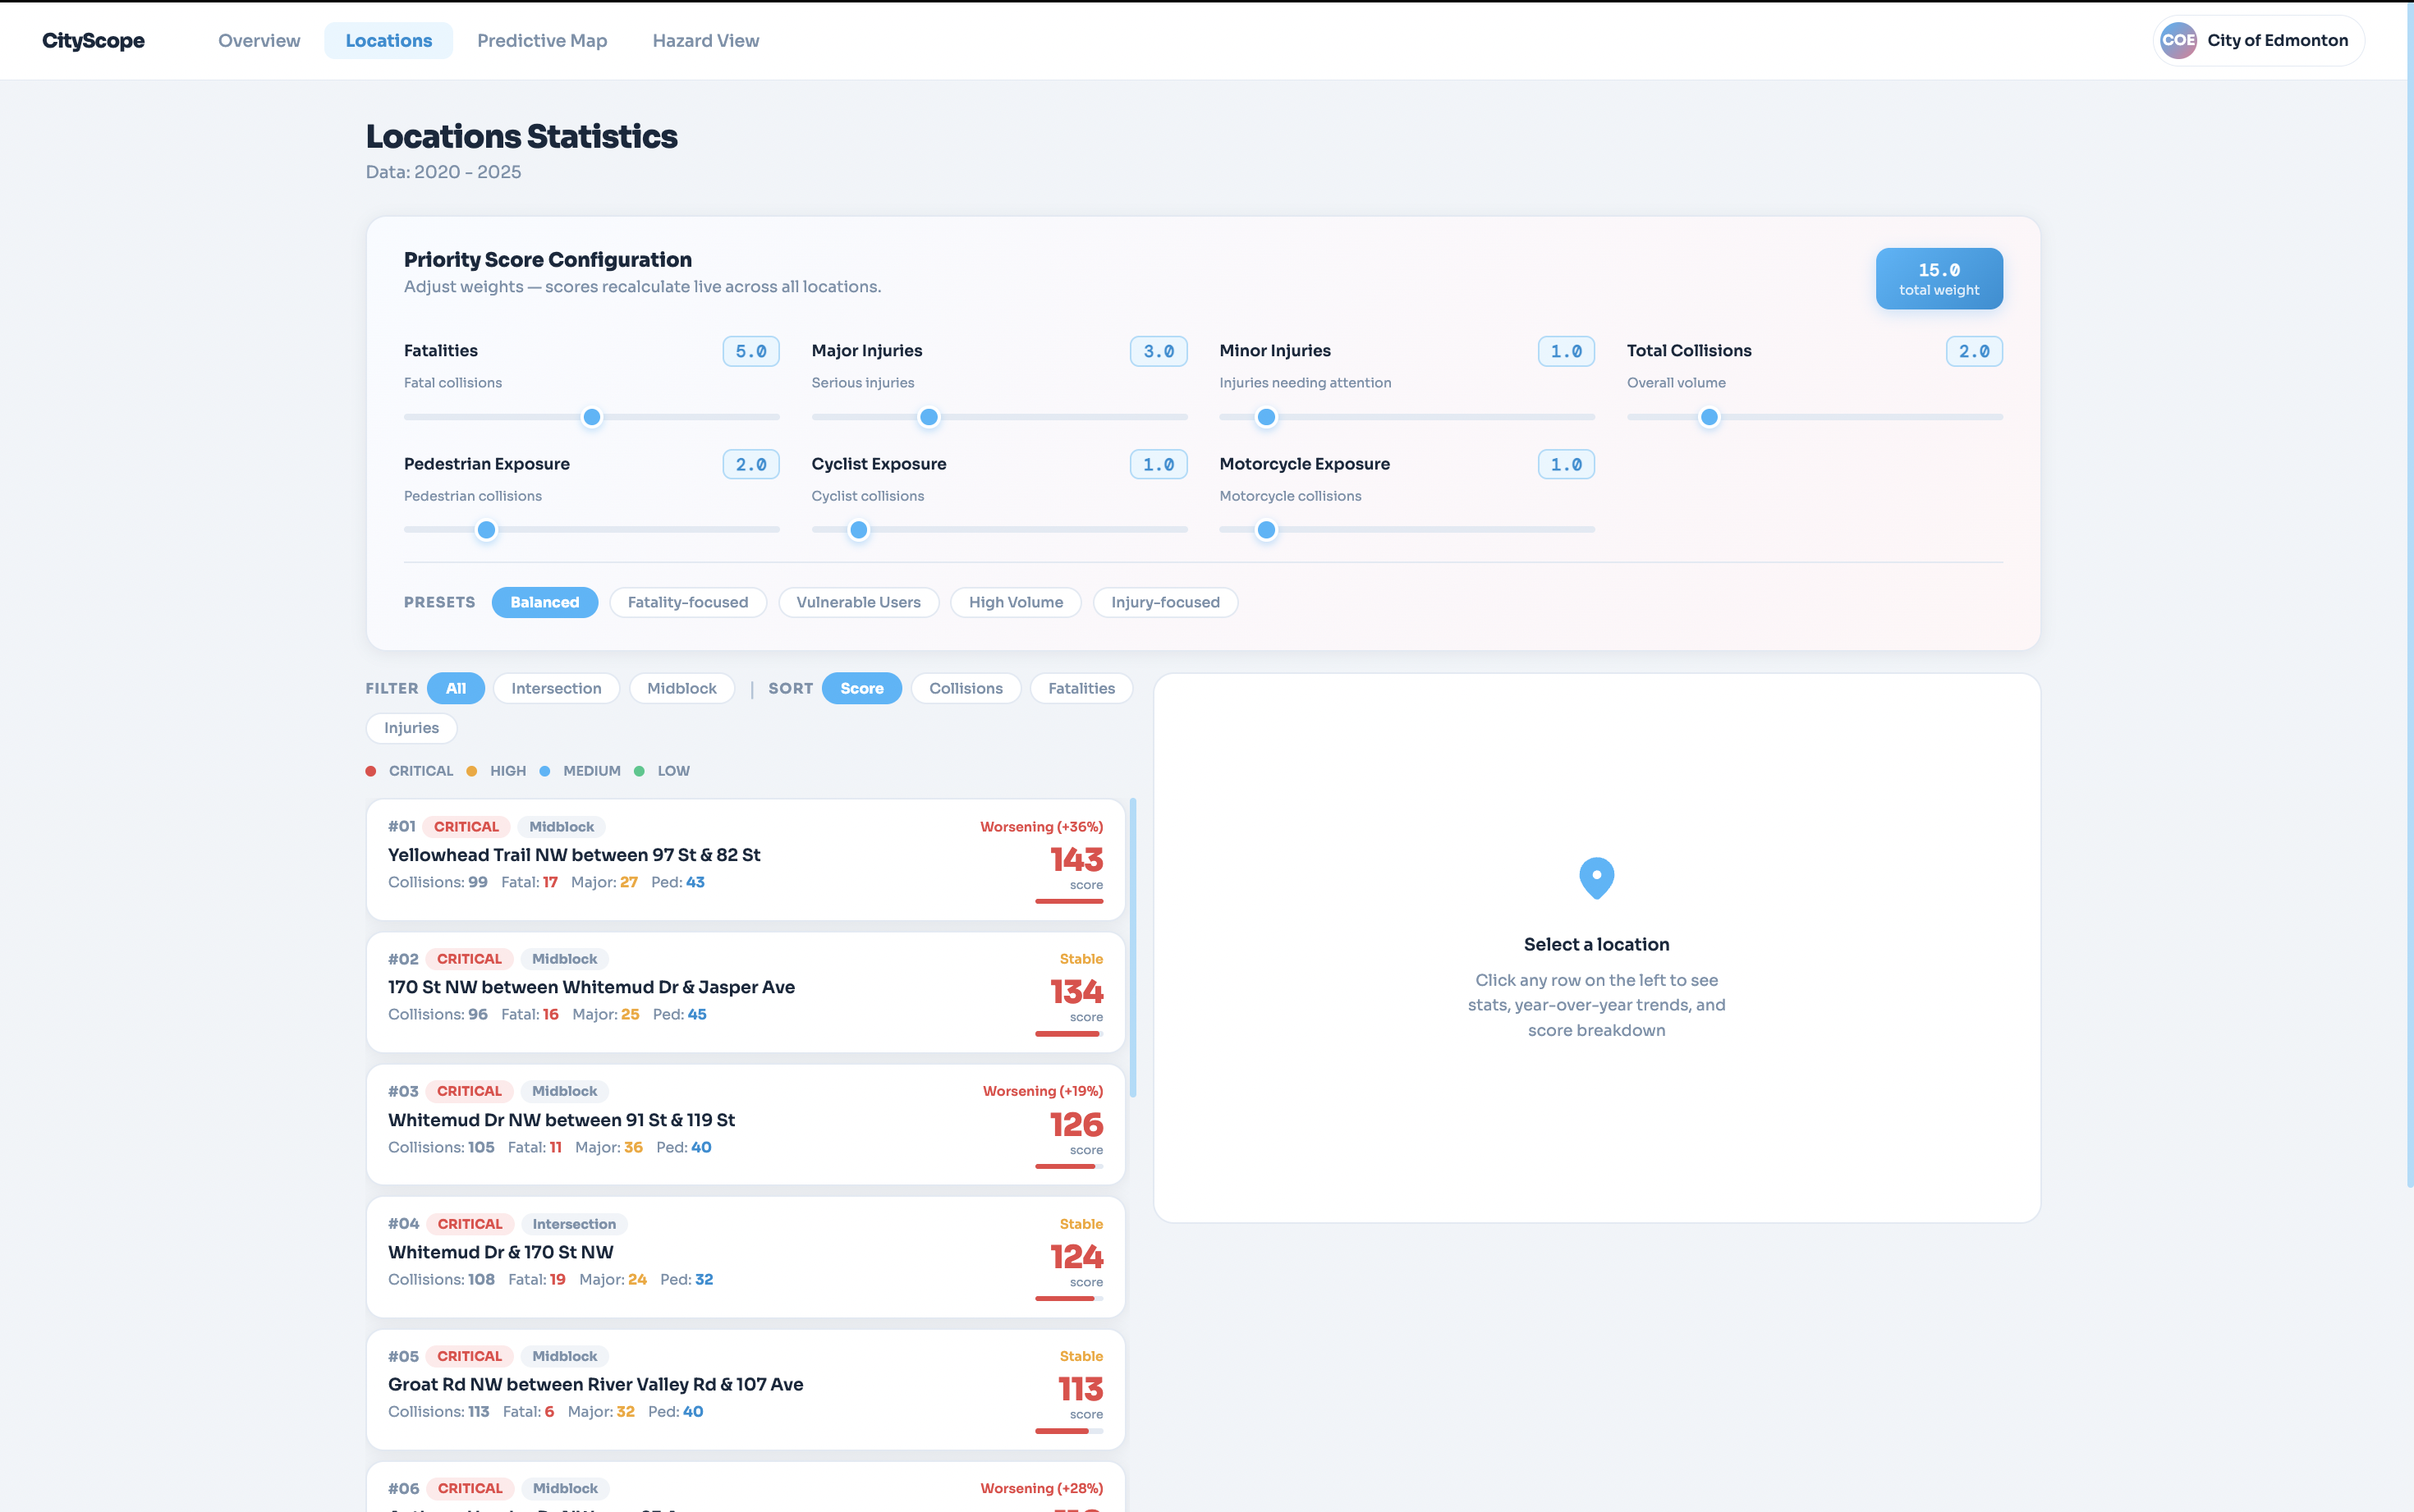
Location-wise Statistics
-
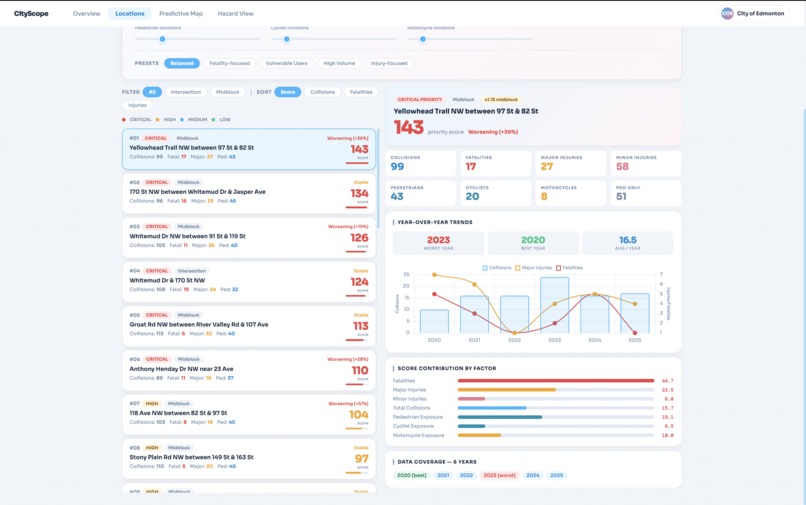
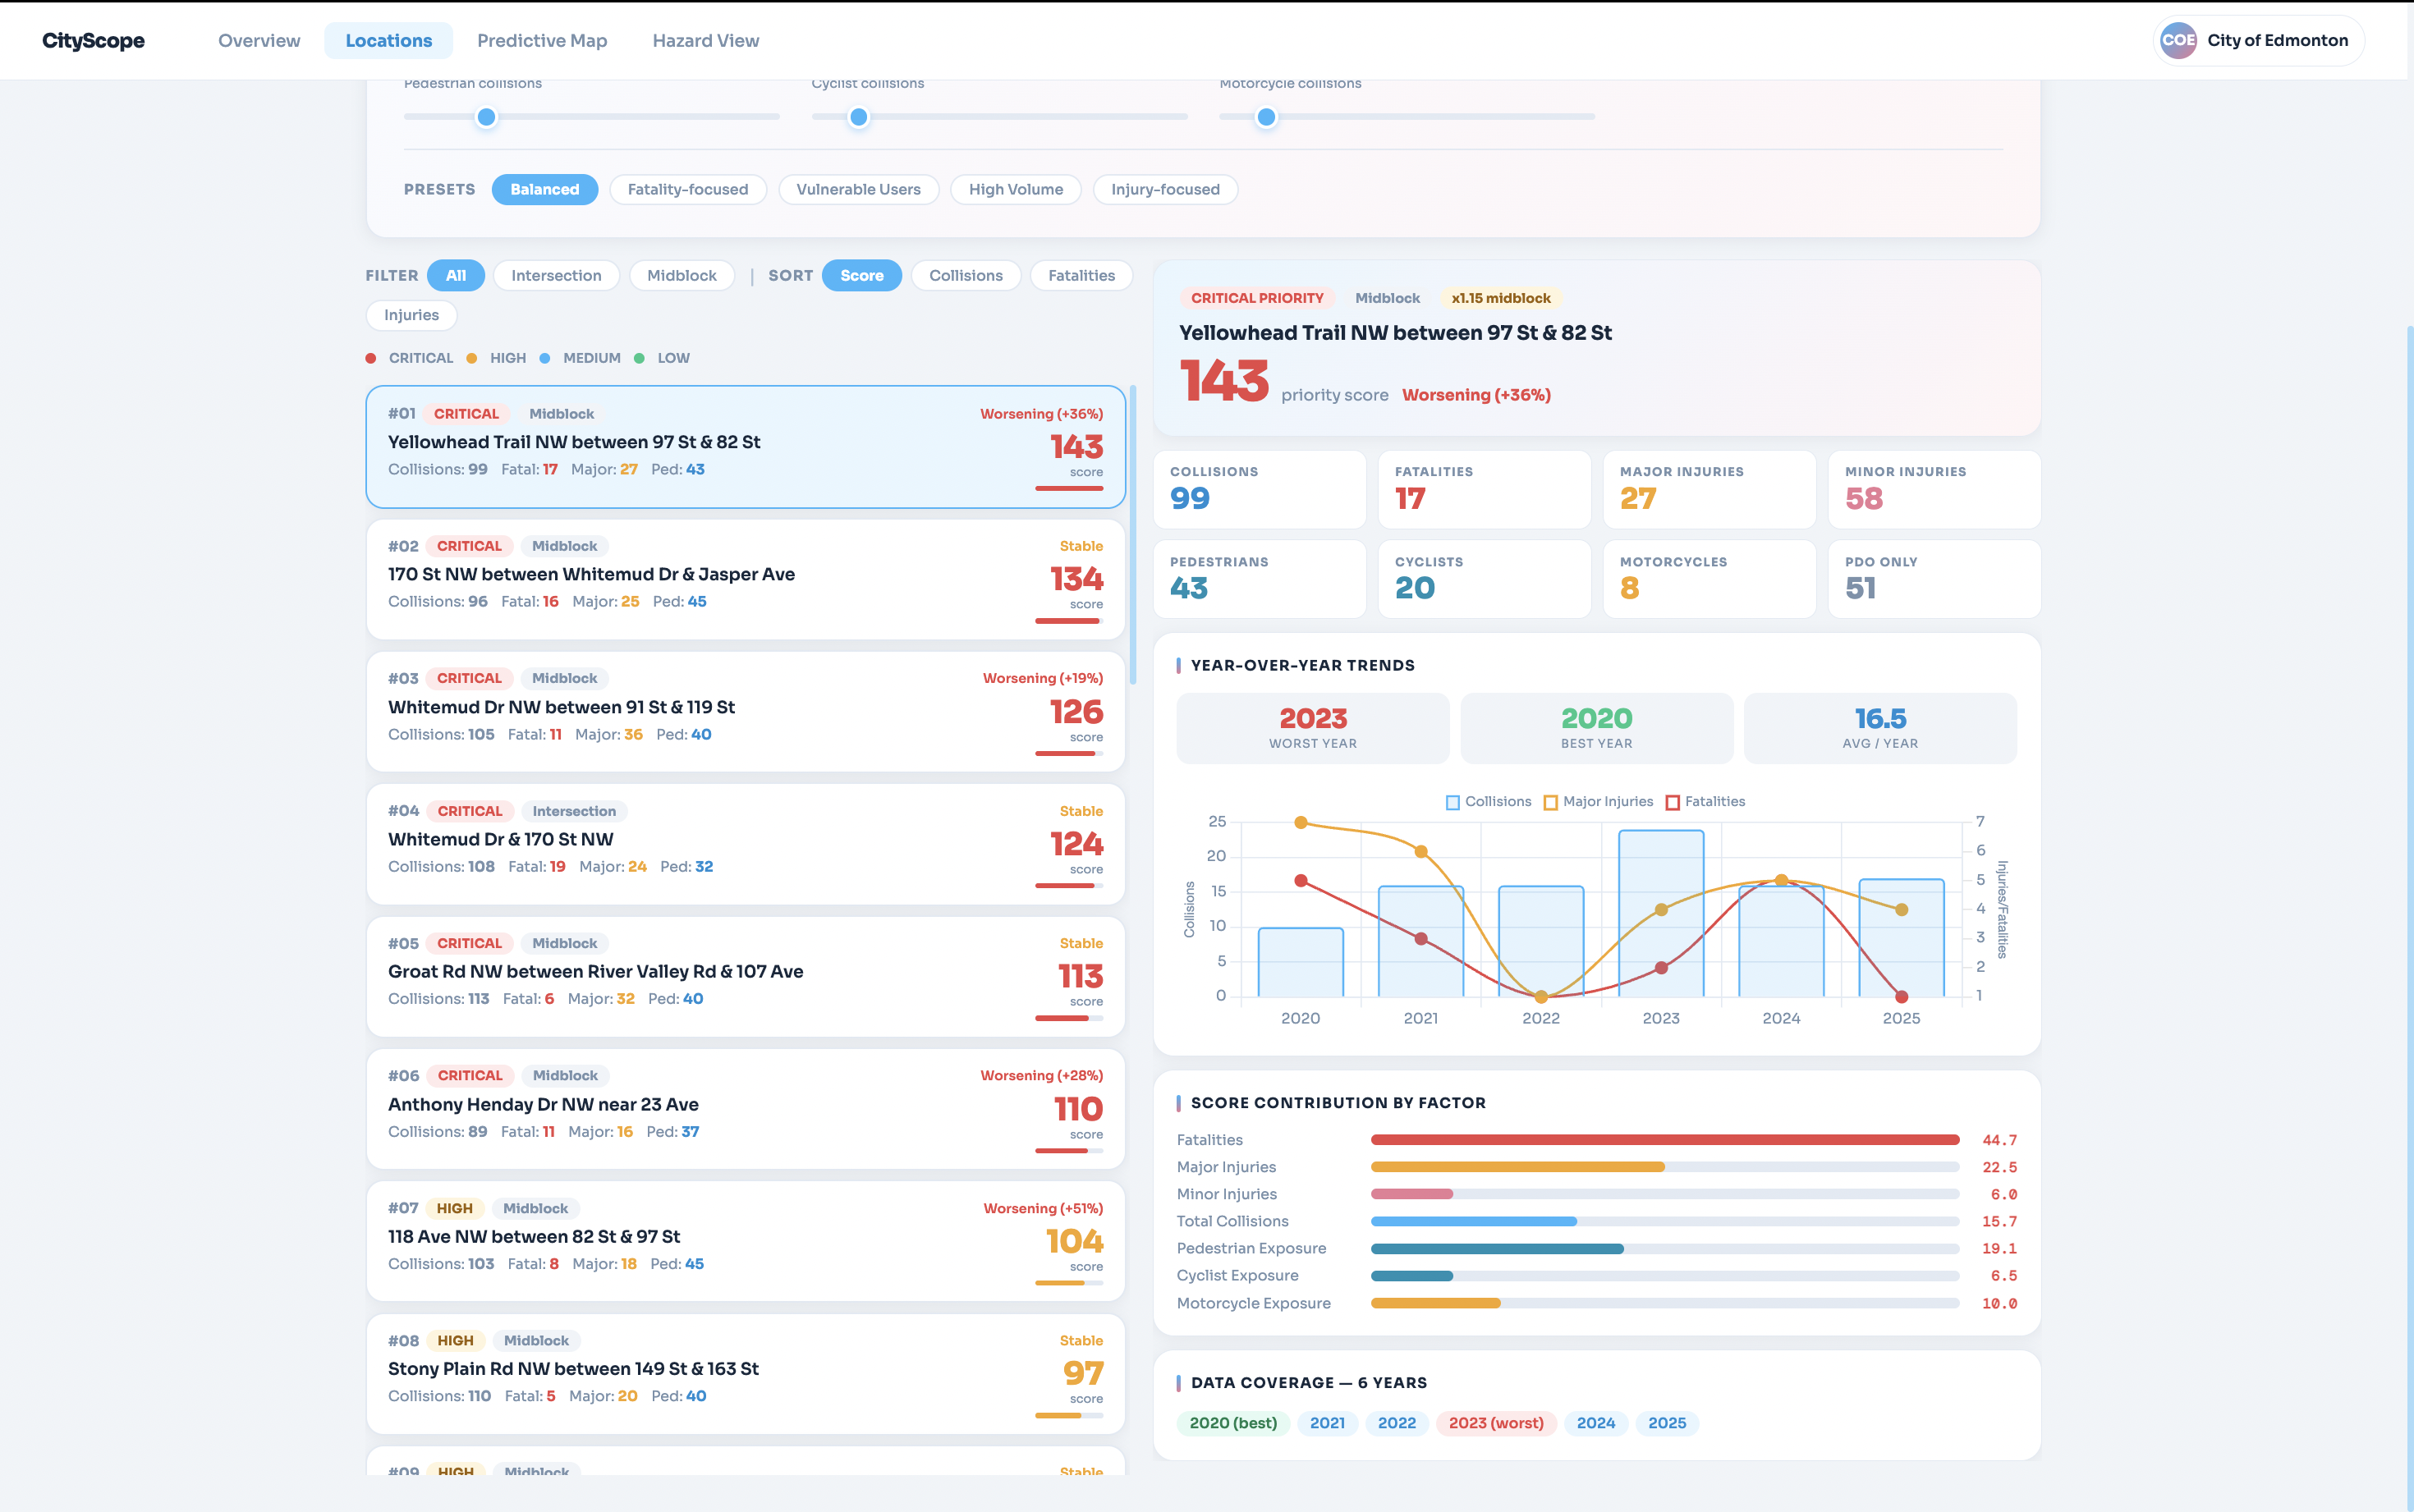
Location-specific Statistics
-
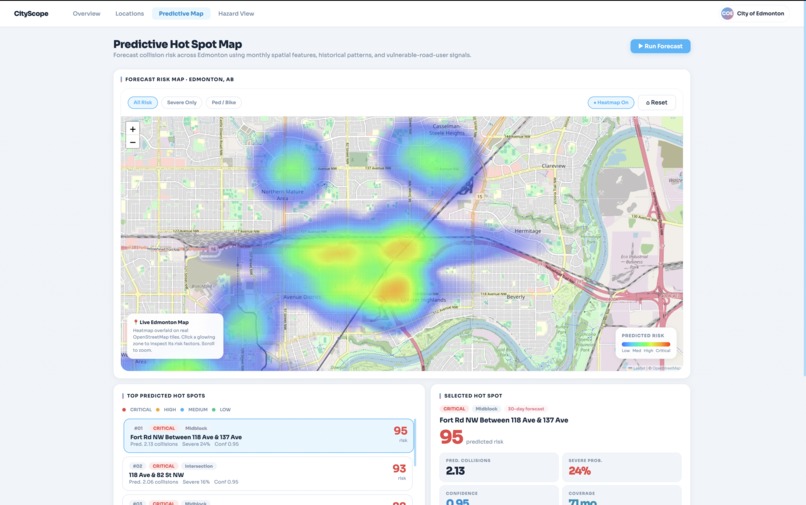
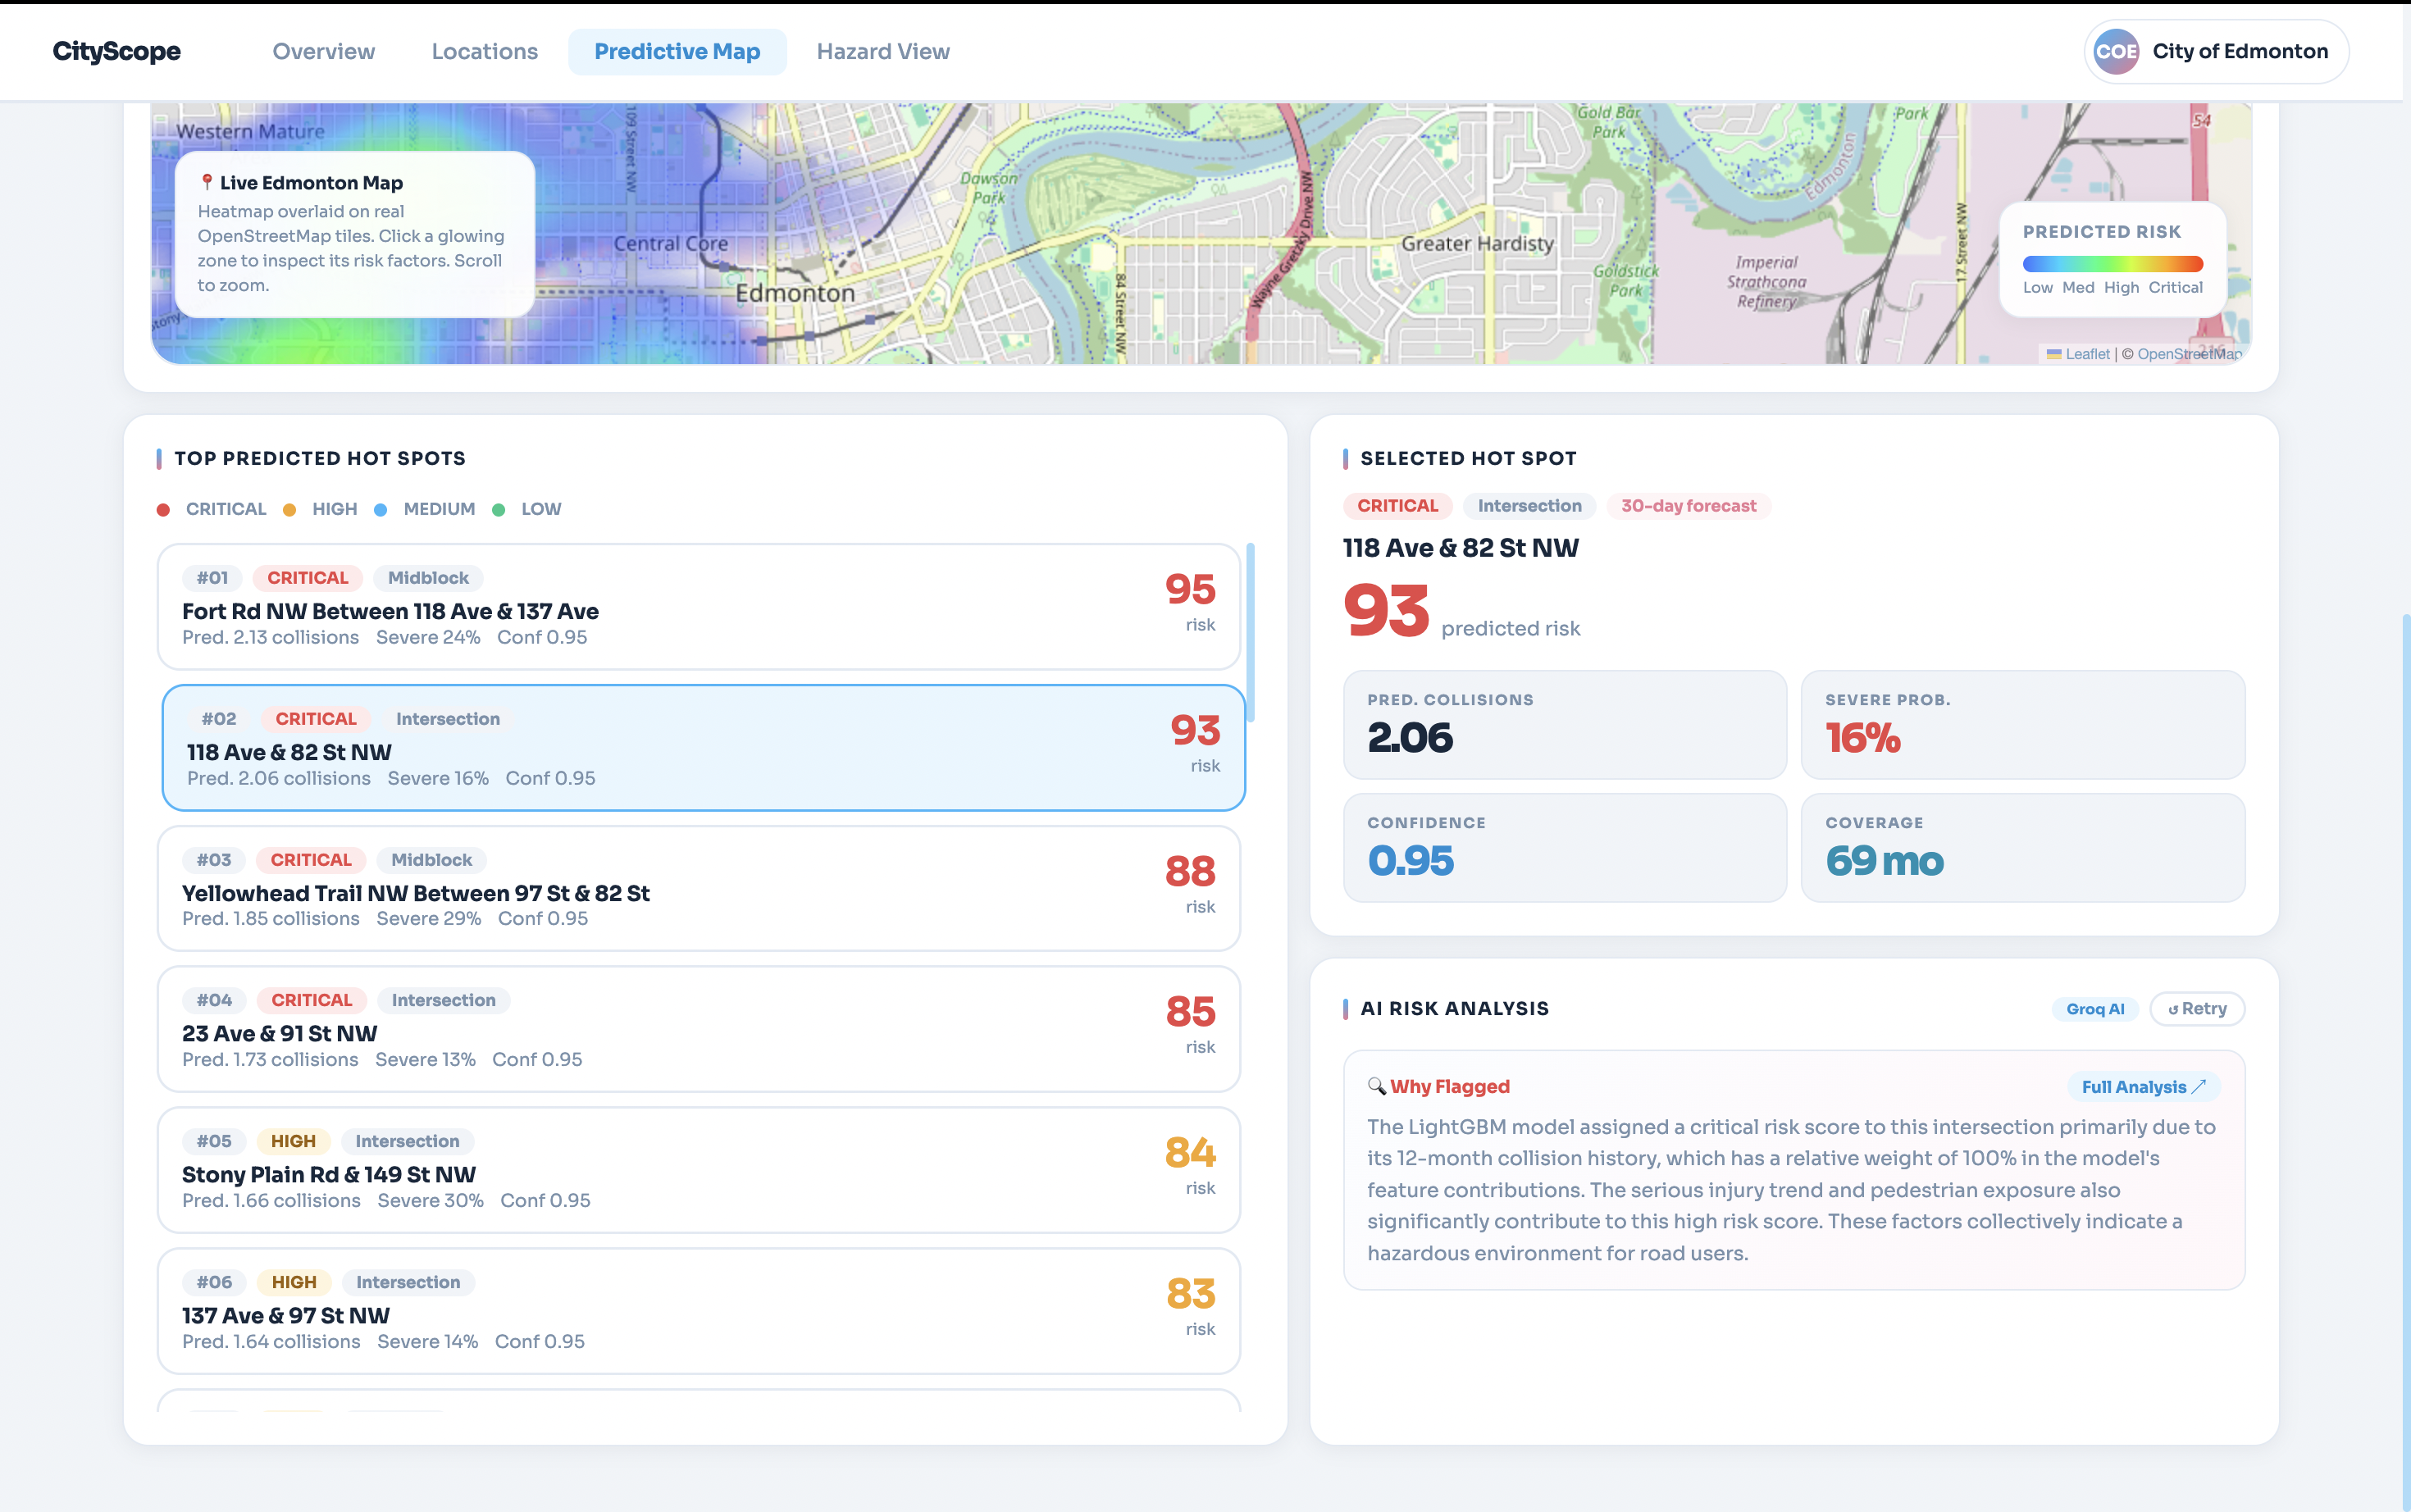
Predictive Hot Spot Map
-
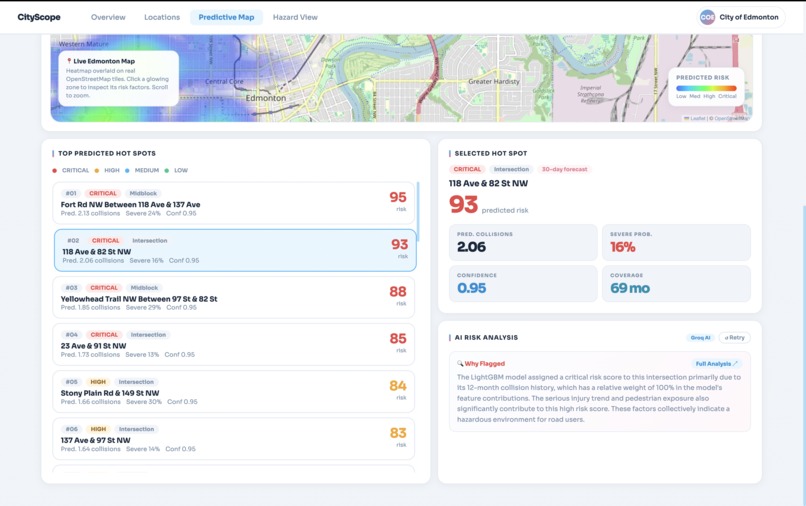
Statistics based on Predicted Hot Spots
-

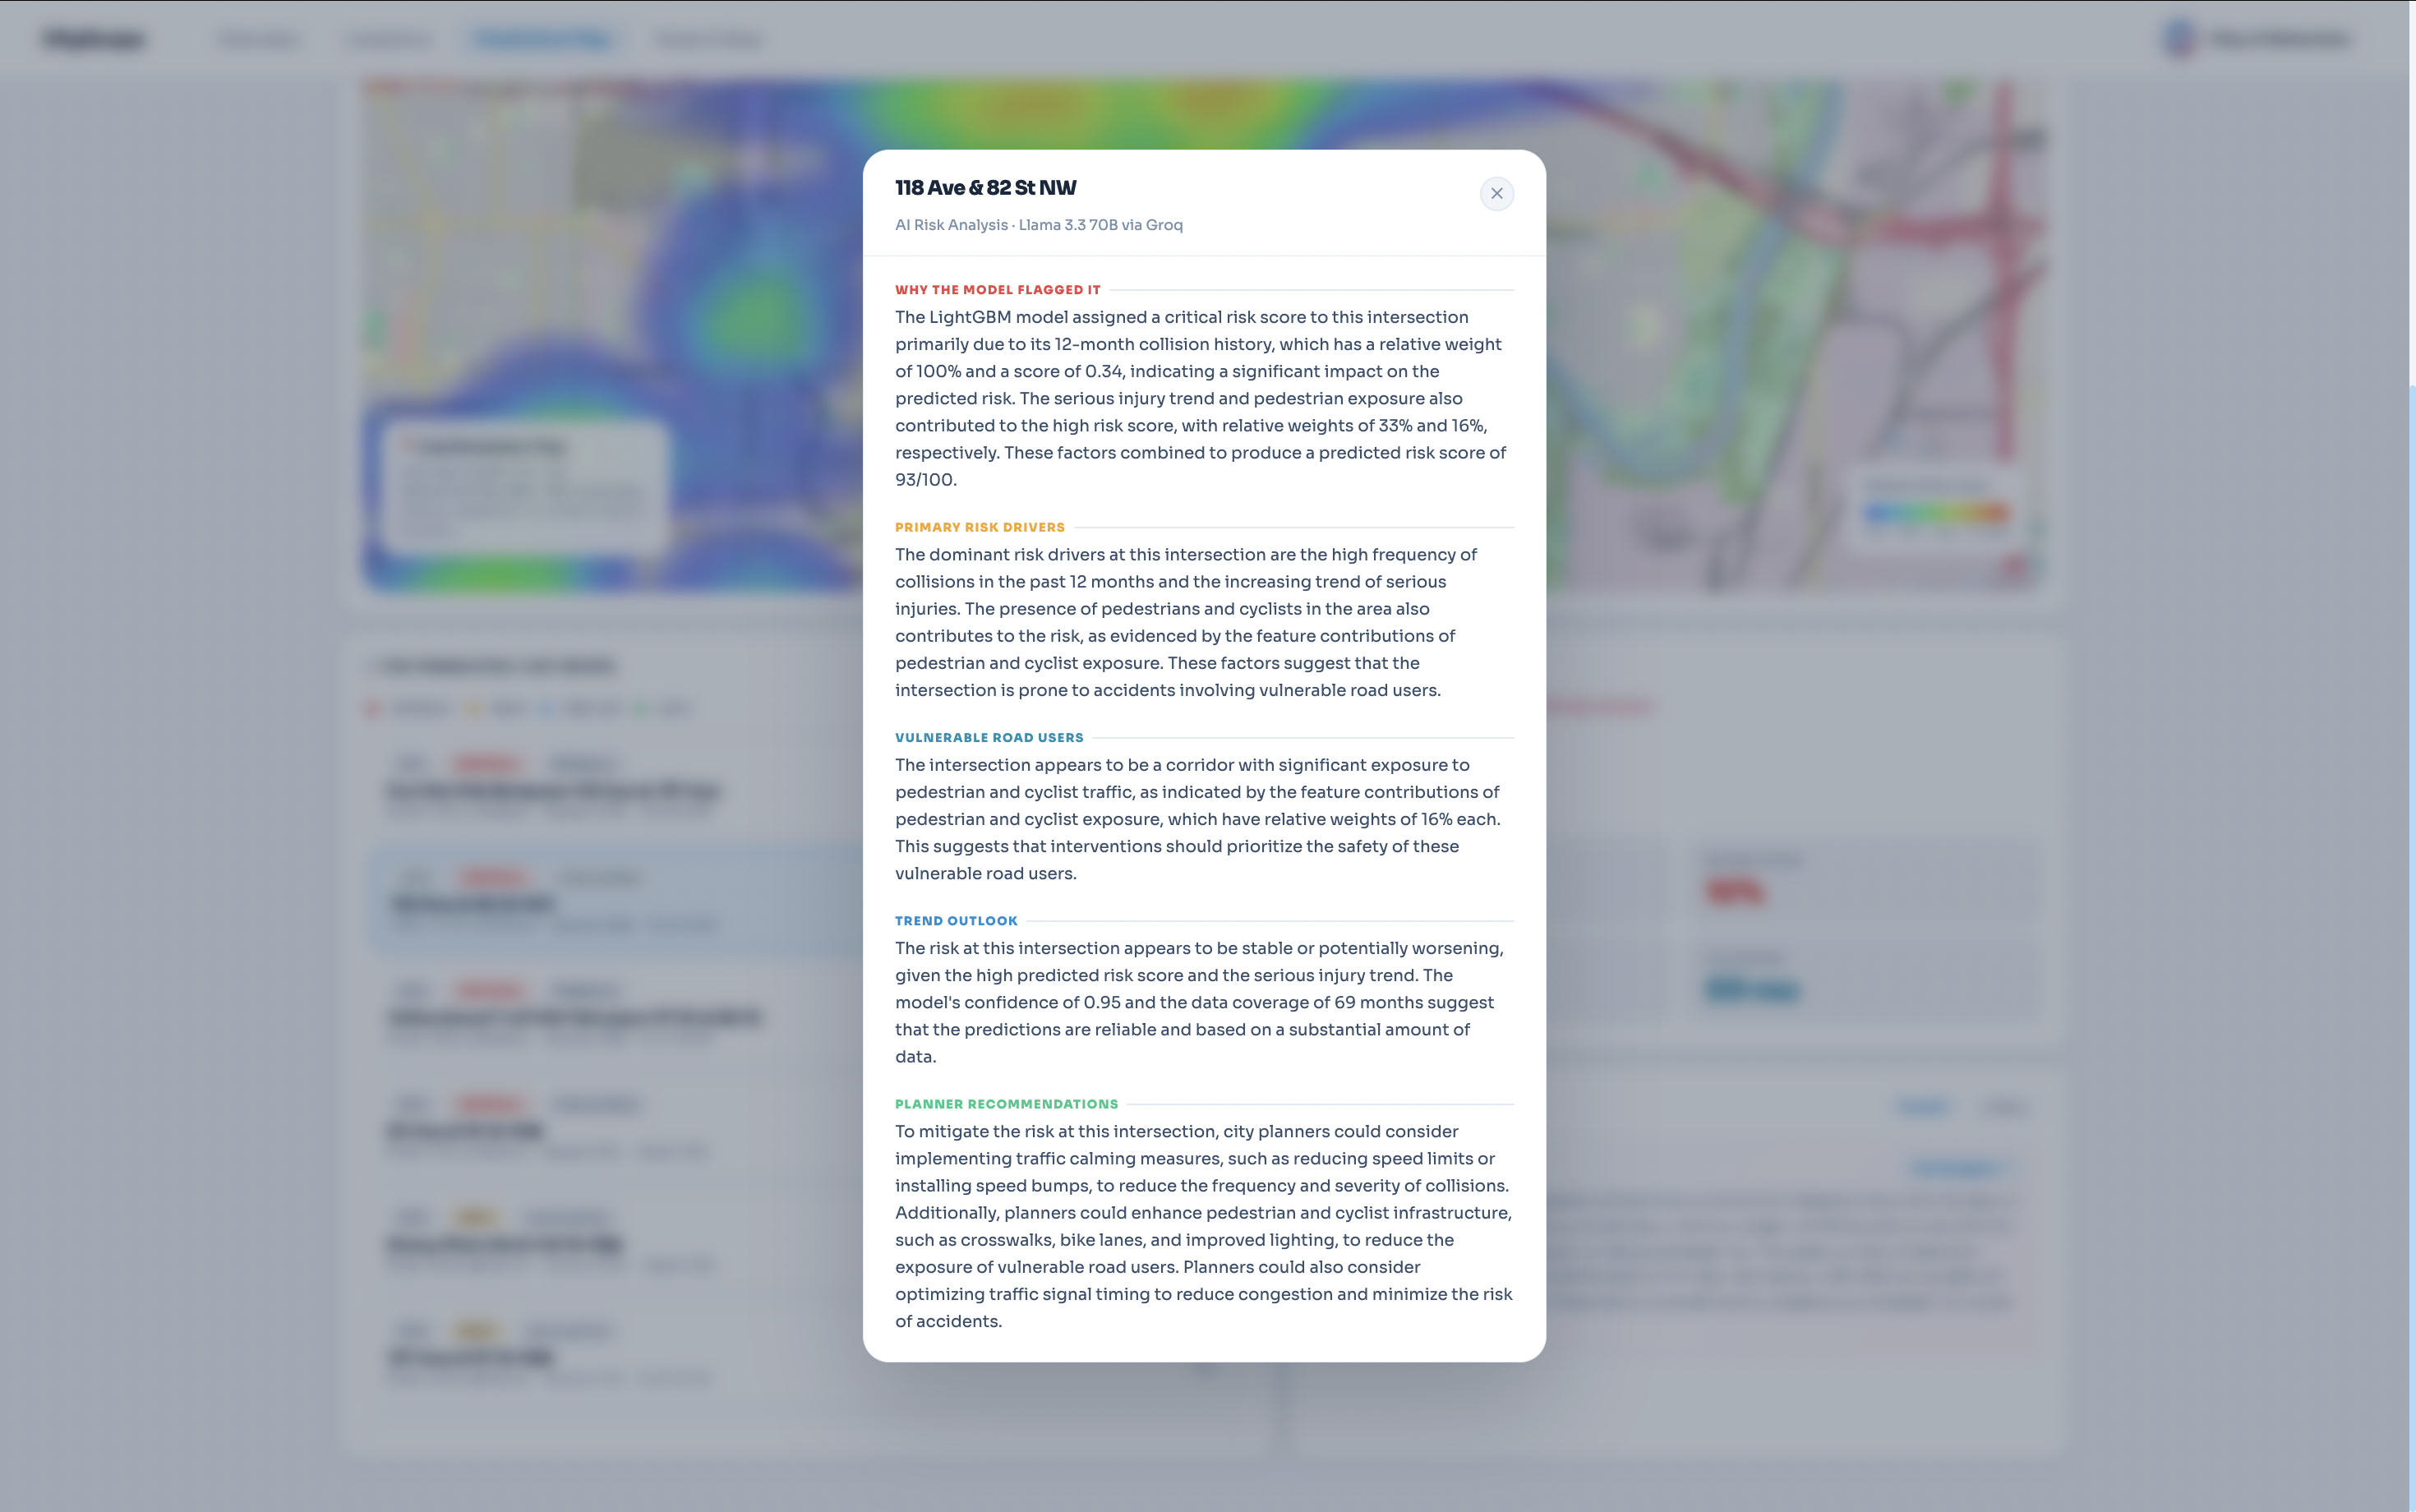
AI Risk Analysis
-
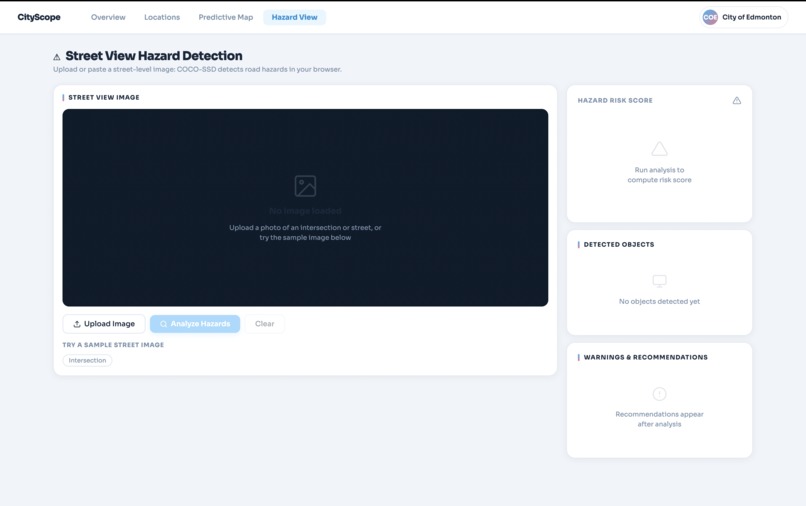
Street View Hazard Detection (Without Image)
-

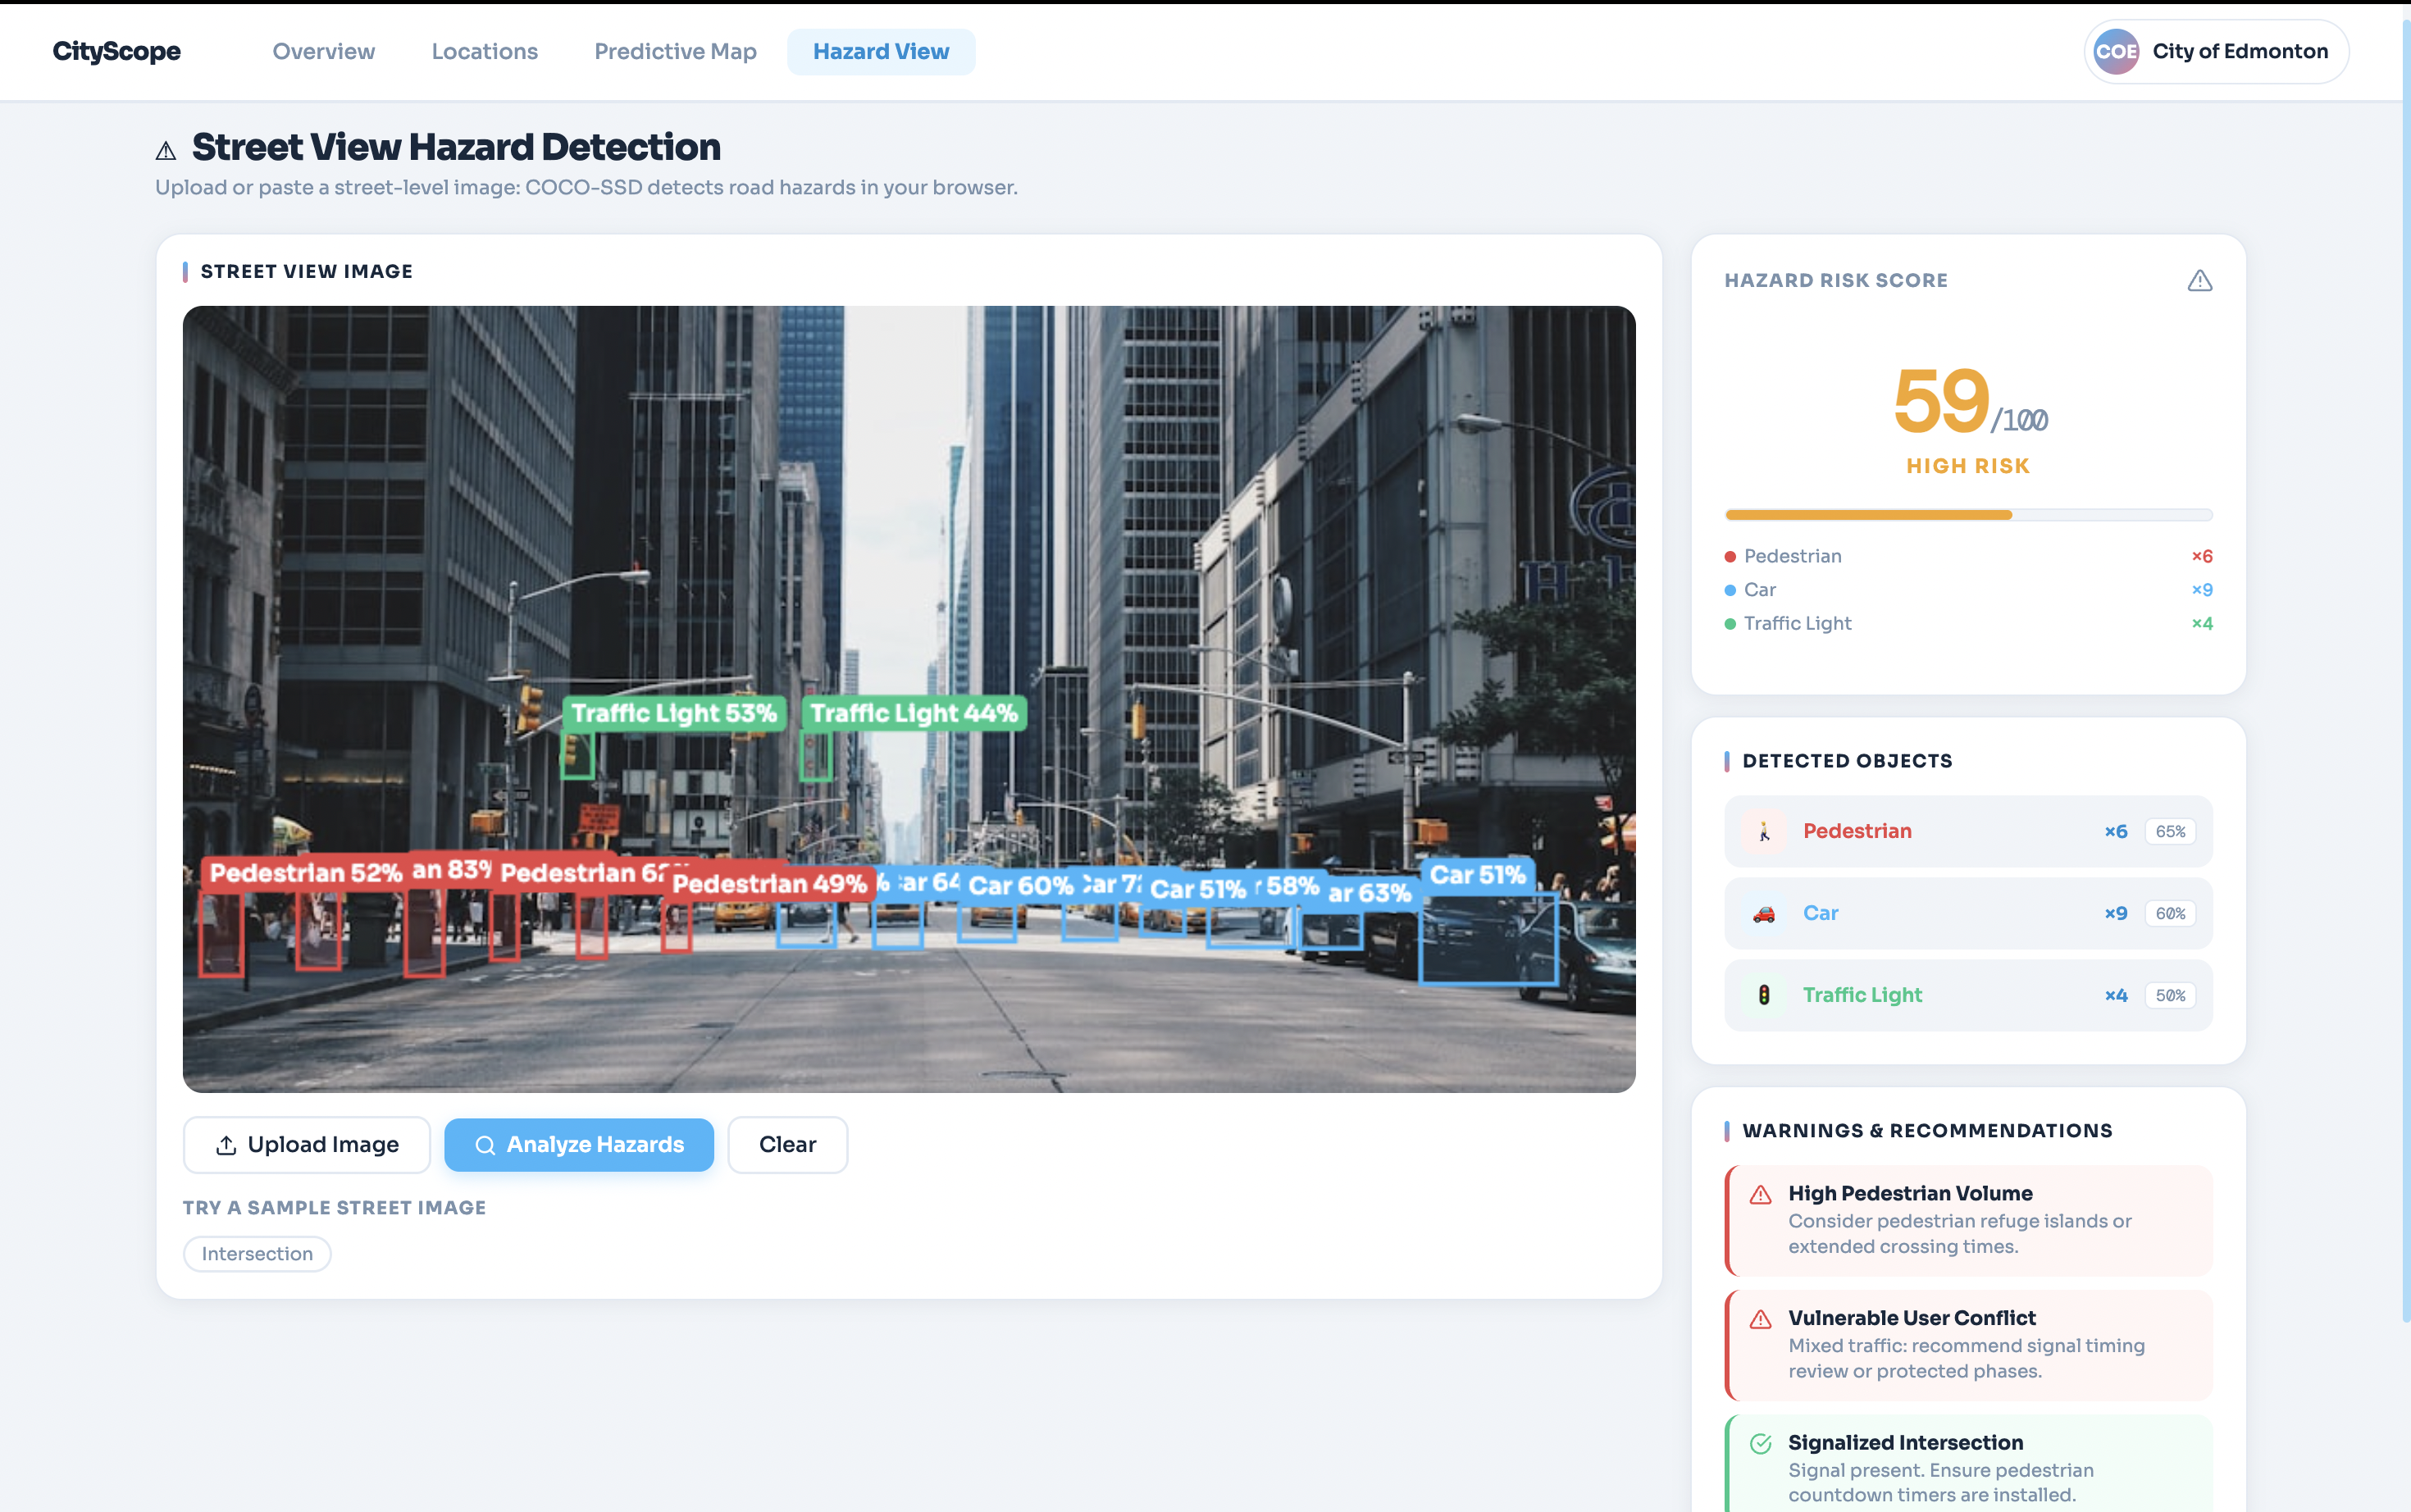
Street View Hazard Detection (With Image and Statistics)
-

Export Report PDF Feature


CityScope
Road Safety Intelligence, for any city, any dataset. Upload your city's collision CSV. Instantly get an overview, statistics on locations, predictive heatmaps, ranked hazard locations, AI-powered risk analysis, and street-level hazard detection.
Inspiration
Often, we see stories online about lives lost or changed by road collisions, another tragedy, another voice. In the comments, multiple people share their own experiences at the same locations, revealing risks that often go unnoticed or unaddressed.
This inspired us to create a tool that turns raw data into actionable insights. By highlighting locations with high numbers of collisions, fatalities, or injuries, city officials can quickly see where attention is needed most, saving time for deeper investigation and supporting safer streets through data-driven decisions.
What it does
CityScope is a three-panel road safety dashboard. Upload any city's collision CSV and immediately get:
- Overview: city-wide collision stats, trends over time, and severity breakdowns
- Location Intelligence: ranked hazard locations with CRITICAL/HIGH/MEDIUM/LOW risk bands, historical collision patterns, and vulnerable road user exposure
- Predictive Heatmap: a LightGBM model forecasts future collision hotspots overlaid on an interactive map, with filters for severity and collision type
- AI Risk Analysis: click any hotspot to get a full Groq-powered (Llama 3.3 70B) breakdown: why the model flagged it, primary risk drivers, vulnerable user exposure, trend outlook, and planner recommendations
- Street-Level Hazard Detection: upload a street photo and our TensorFlow COCO-SSD object detection model identifies road users, vehicles, and infrastructure hazards, generating an instant risk score
- Community Equity View: drill into specific neighbourhoods to surface risk disparities in low-income and marginalised communities, and track risk trends year-over-year
How we built it
- Frontend: HTML, CSS, JavaScript
- CSV Parsing: Python, PapaParse
- Map Simulation: Leaflet.js, OpenStreetMap, LightGBM model
- AI Risk Analysis: llama 3.3 70B
- Hazard Detection: Tensorflow.js, COCO-SSD model, COCO dataset
Challenges we ran into
Getting the LightGBM model to generalize across sparse location data was harder than expected as many intersections had very few historical collisions, making confident predictions difficult. We had to carefully engineer features like relative exposure weights rather than raw counts. Data availability was another major hurdle: key columns we needed were split across the 2023 and 2024 Edmonton datasets, so we had to generate a realistic synthetic dataset by combining and extrapolating from both. On the AI side, we had to set up a Flask proxy server deployed on Render to securely handle API calls to Groq without exposing keys on the frontend. Cleaning and normalizing the collision CSV was tedious and time-consuming, and getting it into a shape that would work across different city datasets took way longer than we expected. COCO-SSD was trained on ground-level photographs. When we tested it on overhead intersection imagery, detection quality dropped significantly, cars from above look nothing like cars from the side. We documented this limitation honestly and oriented the feature around street-level photos where the model performs as intended.
Accomplishments that we're proud of
We built a full-stack data product with zero backend infrastructure. Every feature, from CSV parsing, aggregation, scoring, to mapping, prediction serving, and real-time AI inference runs entirely in the browser as a static site.
What we learned
We learned that civic open data is messier than it looks. Cleaning and normalizing Edmonton's collision dataset alone took hours. We also learned a lot about deploying ML models for browser-based inference with COCO-SSD model, and how to structure a Flask proxy to keep secrets off the frontend.
What's next for CityScope
- Real-time collision feed: Automatically ingest live traffic incident data so the heatmap updates without needing a new CSV upload
- Risk score per neighbourhood: An automated report that flags communities with high risk scores and historically low infrastructure investment
- Multi-year forecasting: project risk 3-5 years out to help cities plan infrastructure budgets proactively rather than reactively
- Better Performing Models: Improving the models by using a higher confidence score and to train a specific set of images related to the view more often will help with our accuracy rate.
Built With
- coco-ssd
- css3
- html5
- javascript
- lightgbm
- llama-3.3-70b
- object-detection
- python
- render.com
- tensorflow


Log in or sign up for Devpost to join the conversation.