Inspiration
Local governments process thousands of citizen inquiries each month, yet traditional communication relies on legacy phone systems where citizens spend significant time on hold. This creates friction, degrades public trust, and hides operational bottlenecks from municipal leaders. The idea for Quick Report (CityReport) came from a simple observation: public issues like pothole repairs, street light outages, and water pipe leaks are inherently visual and location-based, making them far better suited for modern digital reporting than verbal descriptions over a phone call.
What it does
CityReport digitizes civic reporting by replacing long phone queues with a direct mobile intake and routing workflow:
- Snap & Pin: Citizens take a photo of an issue, pin its exact GPS location on an interactive map, and add a brief description.
- Auto-Route: The system automatically maps GPS coordinates to the correct municipal ward or district boundary and dispatches work tickets directly to the appropriate city department.
- Smart Prioritization: An automated queue engine calculates report priority based on issue category, time waiting, and duplicate density.
- Track Progress: Citizens receive real-time updates as their report moves from Received to Assigned, In Progress, and Resolved.
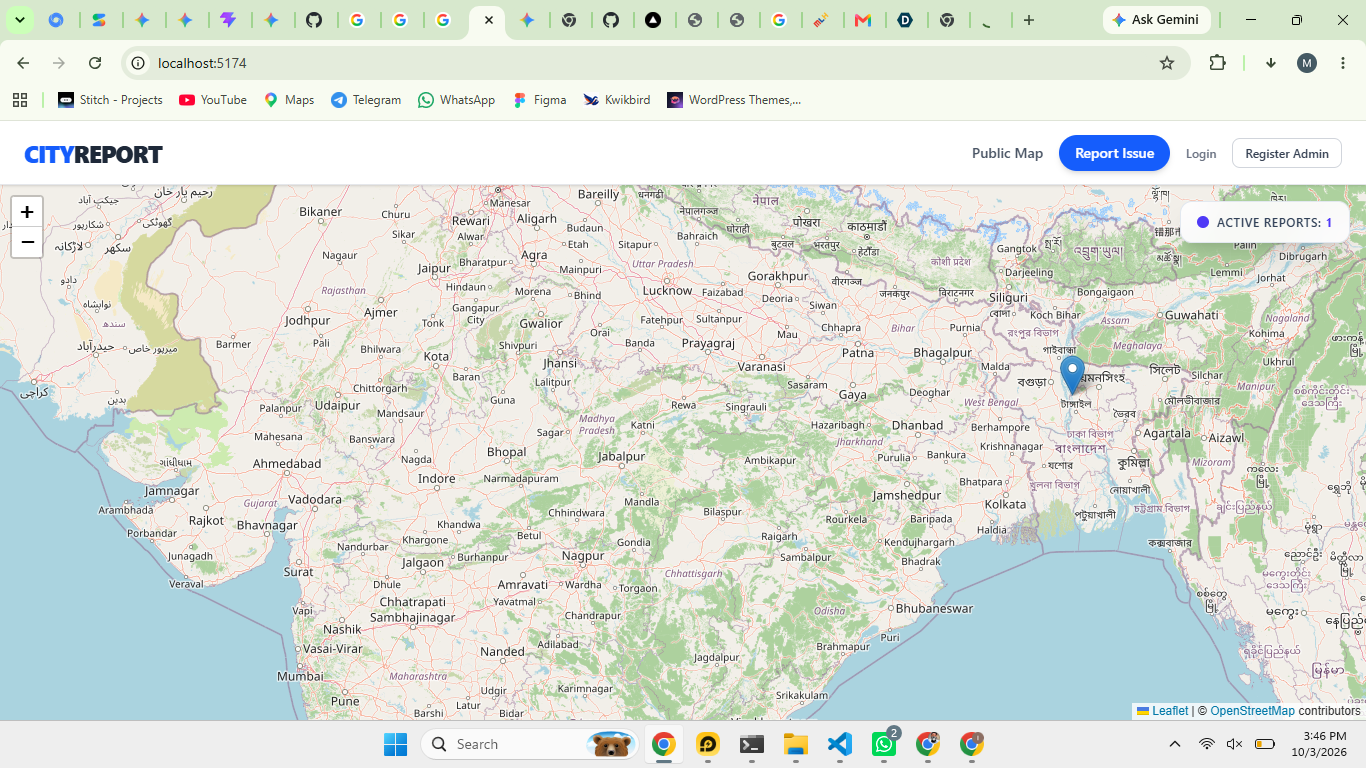
- Public Transparency Dashboard: An interactive map displays open and fixed issues across the city, giving citizens full visibility into municipal response times.
How I built it
CityReport is built as a lightweight, cross-platform progressive web application (PWA) with a modular microservices backend to handle intake, classification, and municipal dispatch:
- Frontend: Built with React and Tailwind CSS, optimized for mobile responsiveness and offline-first queue management so citizens can file reports even with spotty connectivity.
- Backend API: Powered by Node.js and Express, orchestrating asynchronous report ingestion and real-time status webhooks.
- Database & Geospatial Indexing: Uses PostgreSQL with PostGIS extension to store spatial coordinates and automatically route reports to the correct municipal ward boundary.
- Storage & Media Handling: AWS S3 for secure photo uploads, automatically stripping sensitive metadata while retaining GPS tags for maintenance crews.
To optimize the triage queue for city administrators, reports are prioritized using a weighted urgency function:
$$P(r) = w_1 \cdot U_r + w_2 \cdot \log(1 + T_r) + w_3 \cdot D_r$$
Where:
- $U_r \in [1, 5]$ is the citizen-reported or estimated urgency level.
- $T_r$ is the elapsed time in hours since submission.
- $D_r$ represents duplicate density (clustering of multiple reports in the same geographic radius).
- $w_1, w_2, w_3$ are dynamically tuned system weights.
Challenges I ran into
- Spatial Deduplication at Scale: When a major issue occurs—like a downed tree or main water line leak—dozens of citizens submit reports simultaneously. Building a spatial-temporal clustering algorithm using PostGIS to automatically group reports within a $50\text{m}$ radius and $24\text{h}$ window without merging distinct nearby issues required extensive tuning.
- Legacy Municipal System Integration: Local government backends rarely feature modern REST or GraphQL APIs. Designing flexible webhook adapters to transform our structured JSON payloads into formats compatible with legacy work-order software proved to be a major integration hurdle.
- Privacy & PII Protection in Real Time: Maintaining a public transparency dashboard meant ensuring zero personally identifiable information (PII) reached public view. I built an automated pipeline to strip EXIF metadata from uploaded images and process faces and license plates through edge blur filters before publishing media.
Accomplishments that I'm proud of
- Sub-Second Ticket Routing: Reduced the time it takes for a citizen report to be geofenced, categorized, and routed to the correct department team from days to under 300 milliseconds.
- Zero-Wait Civic Engagement: Replaced a process that previously averaged 15–30 minutes of citizen hold time on government phone lines with a streamlined 15-second report submission process.
- Transparent Lifecycle Tracking: Successfully implemented an end-to-end status pipeline that automatically alerts citizens at key milestones (Received $\rightarrow$ Triaged $\rightarrow$ Scheduled $\rightarrow$ Resolved), complete with "after" photos uploaded by field staff.
What I learned
- Feedback Loops Drive Civic Trust: Citizens don't expect municipal problems to be fixed instantly, but they do expect visibility. Providing automated milestone updates almost entirely eliminates duplicate follow-up inquiries.
- Geospatial Indexing is Essential Early: Efficient spatial indexing using spatial bounding boxes and PostGIS
ST_DWithinqueries is critical for preventing database latency as report volumes scale. - Simplicity Drives Adoption: Field workers and municipal staff need ultra-clean interfaces. Designing a minimal mobile dispatch view for city crews drastically reduced onboarding time compared to complex enterprise management software.
What's next for CityReport
- Computer Vision Auto-Categorization: Integrating on-device image classification to automatically detect the issue type (e.g., graffiti, pothole, street light outage) and estimate severity before submission.
- Predictive Maintenance Analytics: Aggregating historical report data into heatmap models to help municipal planners predict infrastructure failures before they happen.
- Multi-Language & Offline First Sync: Expanding localized language support and robust offline queueing so citizens in areas with spotty cellular coverage can draft reports that auto-sync once reconnected.
Built With
- express.js
- node.js
- react
- tailwind

Log in or sign up for Devpost to join the conversation.