-
-

Logo
-
Landing Page
-


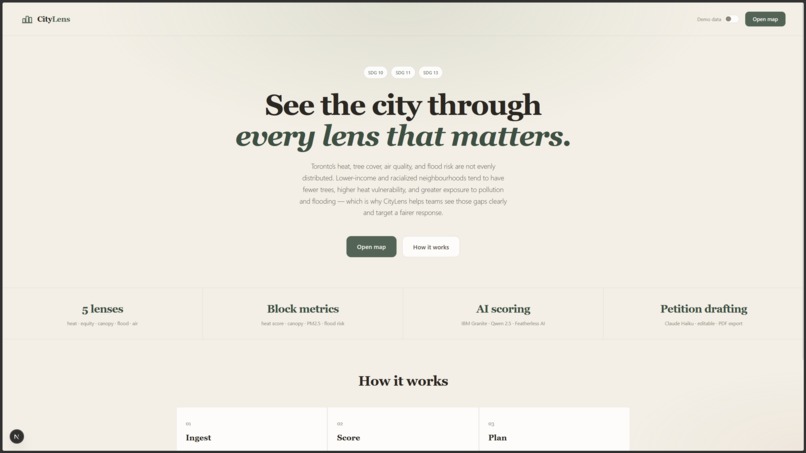
CityLens: Visualizing Environmental Equity in Toronto
Inspiration
Urban heat islands, flooding, and poor air quality do not fall evenly across a city. They often align with income and historic investment patterns, which makes “average city” statistics misleading for planning and advocacy. CityLens exists so planners, researchers, and residents can see who bears environmental burden and where targeted green infrastructure or cooling measures might matter most, starting with Toronto at the city-block level.
What it does
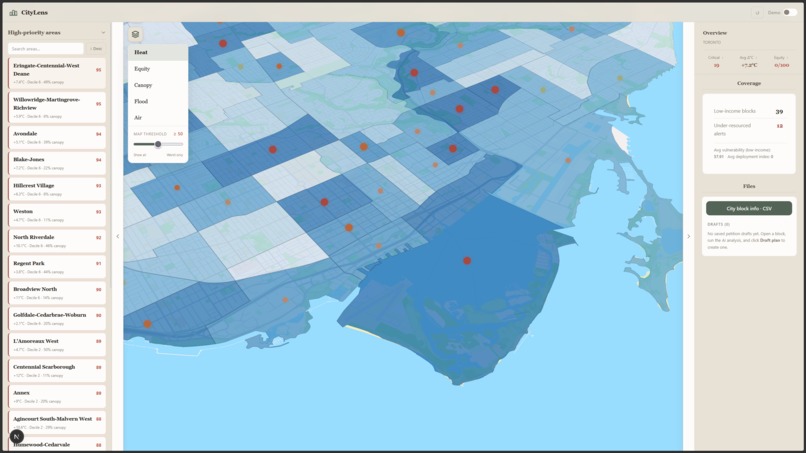
- 3D Urban Visualization: Fullscreen Mapbox map with Mapbox Standard (3D buildings, pitched view) centered on Toronto.
- Vulnerability Choropleth: Dynamic scoring on census blocks using a composite index of Land Surface Temperature (LST), tree canopy density, and PM2.5 air quality.
- Contextual Overlays: Toggleable layers for zoning, flood-risk, OpenAQ air quality stations, and live NASA FIRMS fire/smoke hotspots.
- Equity Dashboard: A specialized view summarizing resource distribution among low-income neighborhoods, highlighting under-resourced high-vulnerability blocks with CSV export capabilities.
- AI-Powered Urban Planning: Per-block detail pages featuring generative AI insights from Featherless AI. Using a high-speed Qwen 2.5 7B model, the app generates custom heat-risk narratives and ranked intervention strategies (e.g., permeable pavement vs. cool roofs) with projected ROI.
- Scalable Architecture: A robust FastAPI/PostGIS backend designed for multi-city expansion using city-scoped endpoints.
How we built it
Frontend
- Framework: Next.js 16, React 19, and Tailwind CSS v4.
- UI System: shadcn/ui (base-ui) and lucide-react for a premium, sleek aesthetic.
- Mapping: Mapbox GL JS 3.x with custom layer slots to ensure 3D buildings remain visible beneath environmental overlays.
- Performance: Implemented collapsible side panels that avoid map resizing, ensuring a stable 60fps canvas.
Backend
- Core: FastAPI, asyncpg, and PostgreSQL + PostGIS for lightning-fast spatial queries.
- Logic: Custom scoring engine for vulnerability and intervention ROI based on real-world cost-to-benefit ratios.
- AI Integration: Integrated Featherless AI using the non-gated Qwen 2.5 7B Instruct model. We optimized this for sub-5-second response times, bypassing the latency and permission hurdles of larger models.
- IBM Cloud / watsonx: Provisioned watsonx.ai Runtime (WML) and a watsonx project, configured service/IAM API keys and region-correct ML URLs. Implemented Granite-based scoring and related utilities in the backend; ingest can archive to IBM COS for exports and longer ML workflows.
Data & Integrations
- Spatial Data: Toronto census block geometries seeded into PostGIS.
- Live Feeds: OpenAQ for air quality, NASA FIRMS for thermal hotspots, and Sentinel Hub for satellite-derived heat maps.
Challenges we ran into
- The "Gated" Model Barrier: We initially hit brick walls with gated Llama 3 models that required manual approval on Hugging Face, causing
403 Forbiddenerrors. We solved this by pivoting to Qwen 2.5 7B, which provided the perfect balance of open access and instruction-following quality. - Geo-Data Alignment: Aligning high-resolution Sentinel-2 LST data with legacy Toronto zoning shapefiles was a nightmare. We had to write custom PostGIS normalization scripts to ensure the environmental burden was correctly attributed to the exact block geometry.
- LLM Latency & Timeouts: Larger AI models were taking 30+ seconds to respond, causing UI timeouts. We optimized our Featherless AI integration by moving to a smaller 7B model and increasing our API timeout to 60s to handle "cold starts" gracefully.
Accomplishments that we're proud of
- End-to-End Geo Stack: Successfully building the full pipeline from raw PostGIS data to a styled 3D choropleth with interactive popups.
- The "Equity Lens": Moving beyond simple "heat maps" to a dashboard that specifically compares environmental burden against socioeconomic data—answering the "who" and not just the "where."
- Instant AI Narratives: Implementing a system where a user can click a block and receive a technically accurate, AI-generated urban planning summary in seconds.
What we learned
- Spatial SQL is King: We learned that performing complex spatial joins in PostGIS is vastly more performant than trying to handle geo-logic in the application layer.
- The Power of 7B Models: We discovered that for structured tasks like generating urban planning JSON, a highly-optimized 7B model is often superior to a 70B model because the speed gain significantly improves the user experience.
- Zoning is Destined: Analyzing the data showed us just how clearly environmental burden (lack of trees, higher heat) follows historical industrial zoning and redlining boundaries.
What's next for CityLens
- Multi-City Expansion: Rolling out CityLens to other major Canadian hubs like Vancouver and Montreal.
- Predictive Modeling: Using historical data to predict how future zoning changes might impact a block's vulnerability score.
- Community Policy Export: Allowing users to generate AI-authored "Policy Briefs" that they can send directly to city council representatives.
Check it out
Repository: https://github.com/eszain/CityLens
Built With
- docker
- fastapi
- mapbox
- mapbox-gl
- nasa-firms
- next.js
- openaq
- postgis
- postgresql
- python
- react
- sentinel-hub
- tailwind-css
- typescript


Log in or sign up for Devpost to join the conversation.