-
-
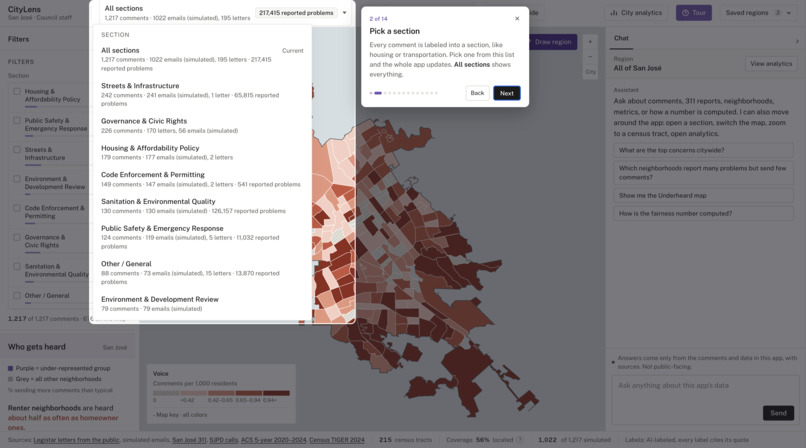
Tutorial page for the 8 categories
-
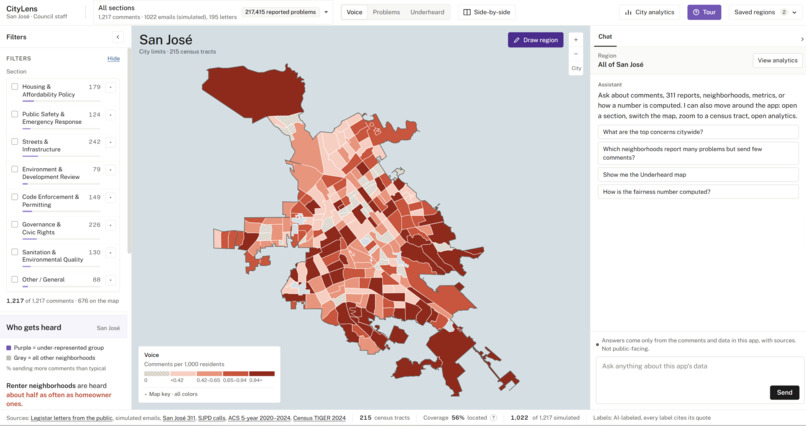
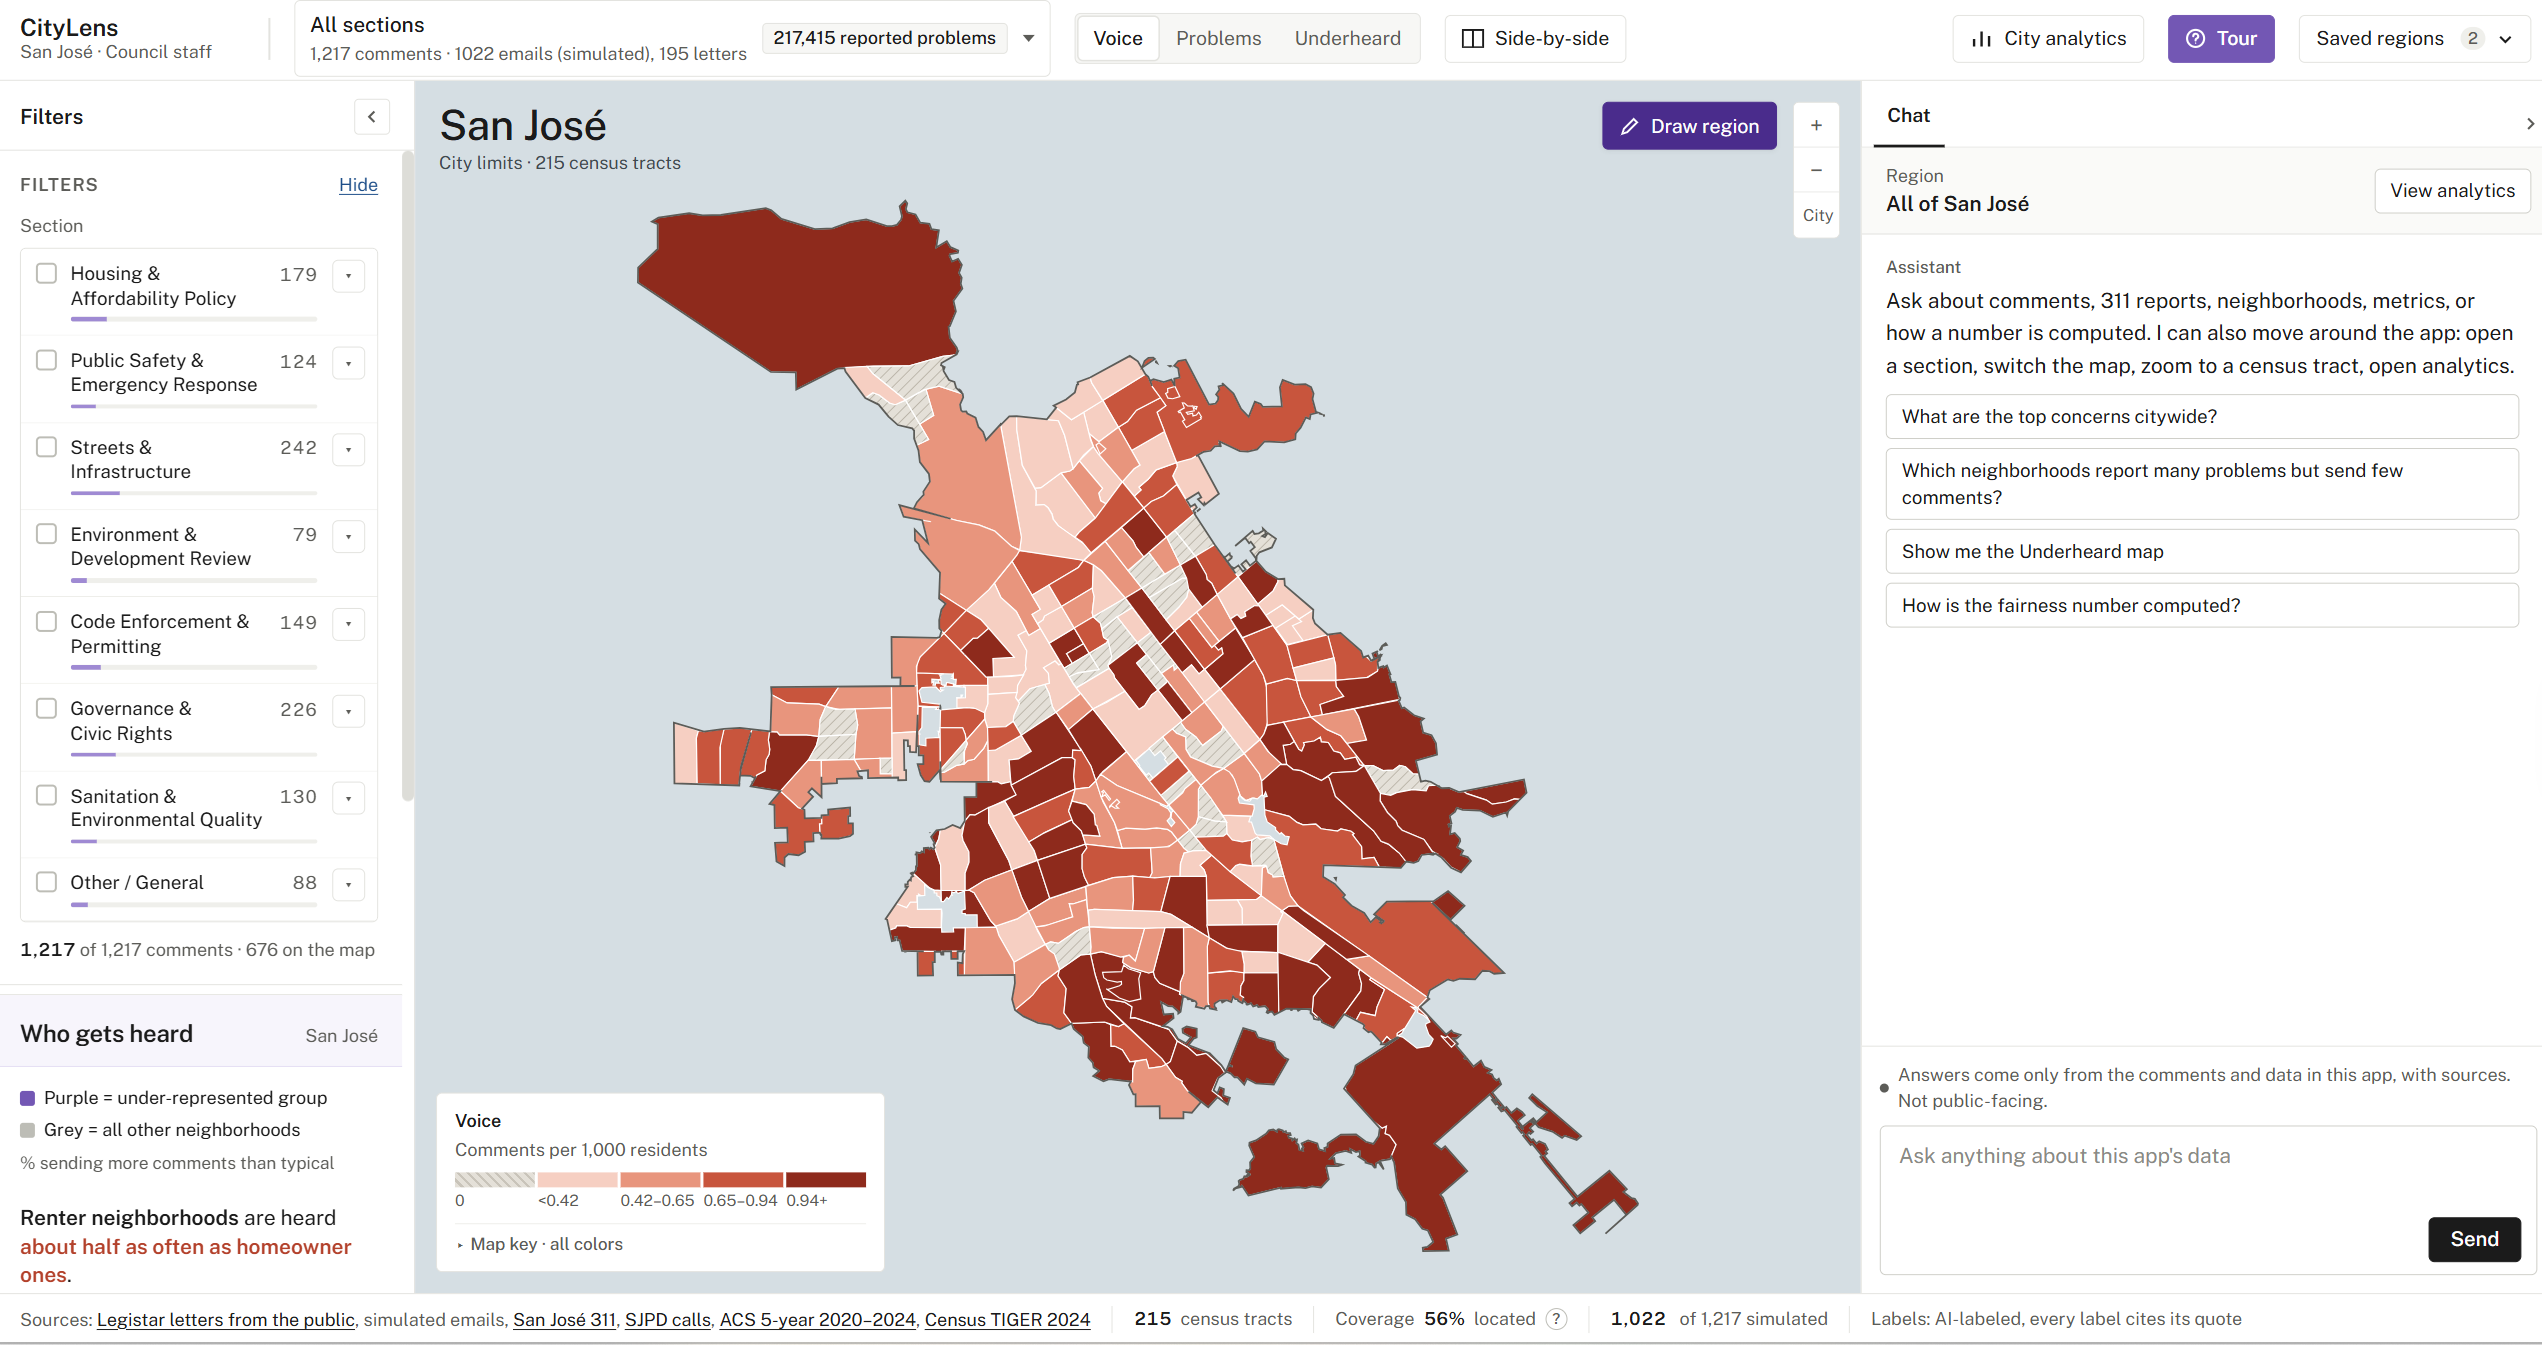
Homepage of website
-
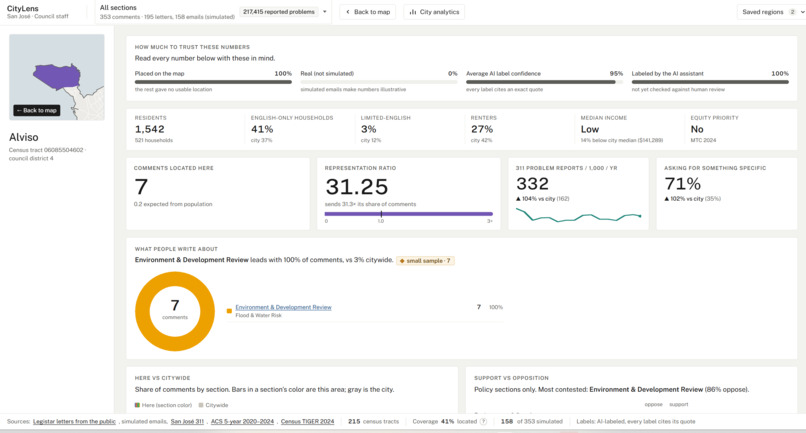
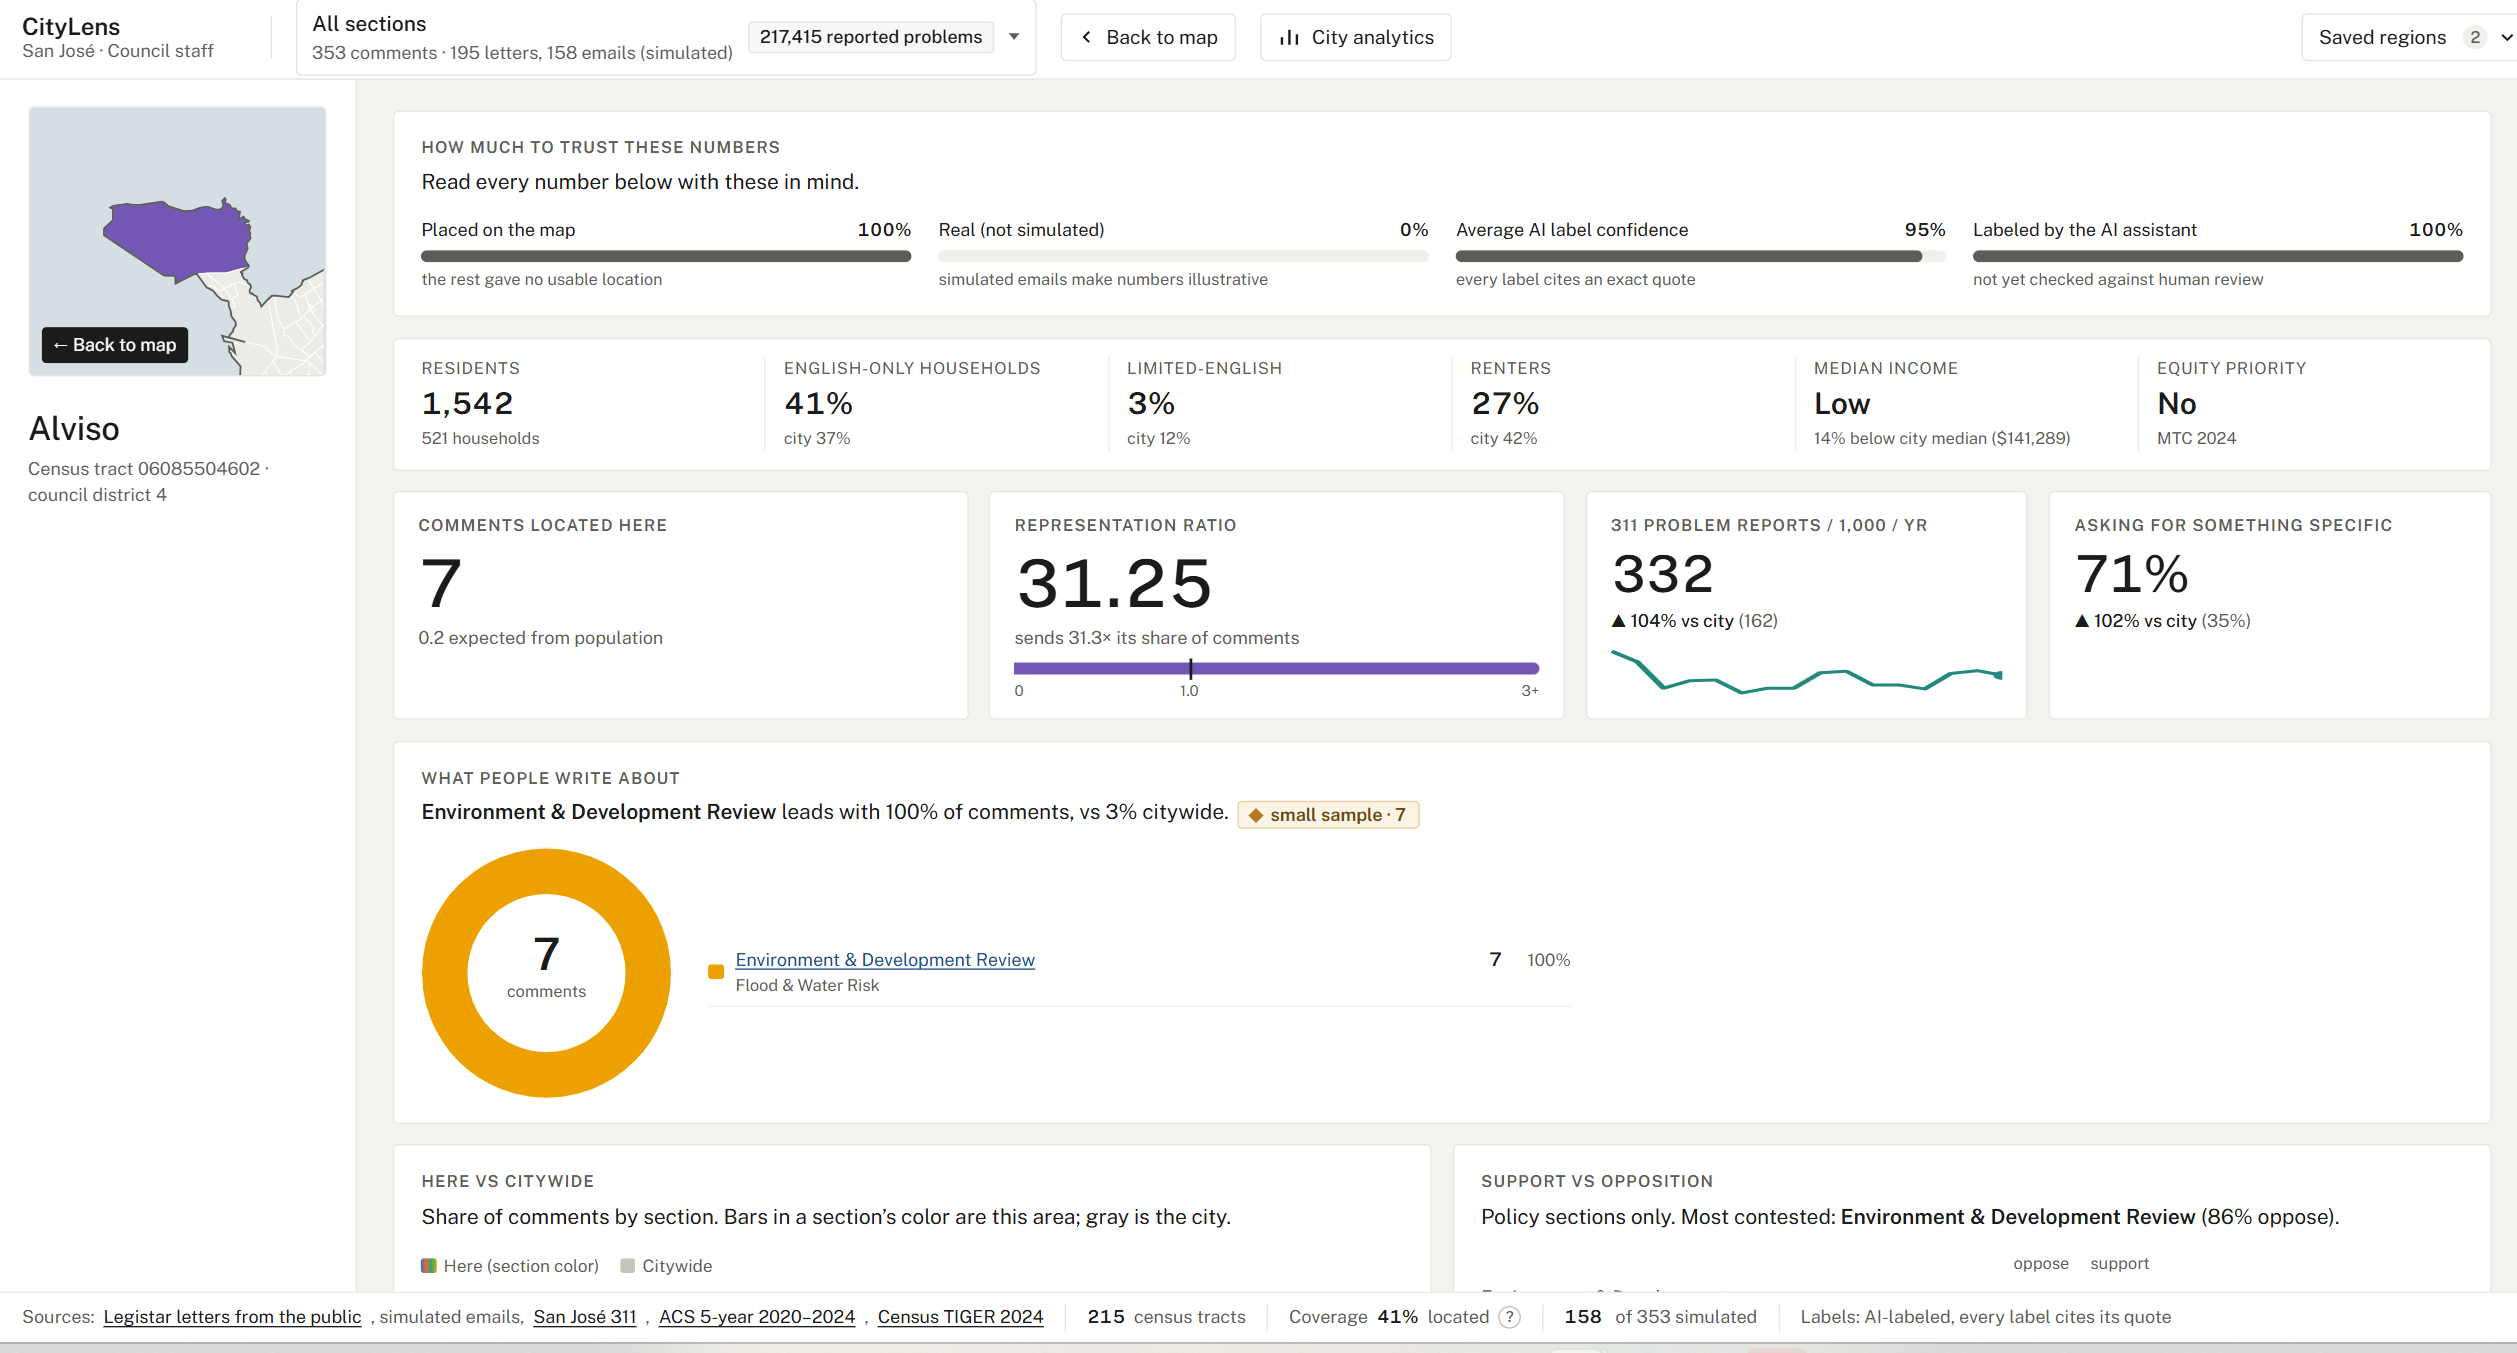
Analytics page based on region
CityLens
- Team: Civics · [FILL: Aaminah Mohammad, Iniyan Kannappan, Jannah Hussaini, Sri Vatsa Vuddanti]
- Live app: city-lens-livid.vercel.app
- Code: github.com/33k0/CityLens
- Demo video: [FILL]
CityLens shows San José council staff and public officials who they are hearing from and, more importantly, who they are not. It maps public comments, 311 reports and police calls by census tract (San José has 215) and compares them with data on who lives there. This can help power decisions on assistance and policy, and an IBM Bob assistant answers questions about the data with cited sources.
Inspiration
San José's City Council receives hundreds of letters and emails on its agenda items, but the people who write in are not a random sample of the city. A 2024 study of more than 40,000 comments to the San Francisco Planning Commission found that commenters over-represent white residents and older homeowners, under-represent renters, younger people and people of color, and that this skewed input still shapes policy outcomes (Sahn, 2024).
In one of our ethnic studies classes, classmates who grew up in impacted neighborhoods described issues like school funding, poor infrastructure and safety going unheard for years. We wanted to give city staff a way to see not just what people are saying, but who they aren't hearing from. New York has shown how much a city can do when leaders know what problems people face and where. We want to help every city get there, including cities where residents are less vocal.
The problem
Staff can count comments, but they cannot see:
- where the comments come from
- which neighborhoods are silent on an issue that affects them
- whether that silence means "no problem" or "not being heard"
Who experiences it:
- City officials and council staff: They make decisions on what they see and the issues they know about.
- Residents in underheard neighborhoods: Often renters, lower-income and limited-English households in Equity Priority Communities. Their needs show up in 311 reports and police calls but rarely in written comment.
The research behind CityLens
Research from 2017 to 2026 points the same way: city feedback systems hear mostly from older, wealthier, English-speaking homeowners, and AI summaries can make the gap worse. Each finding below is tied to a feature.
1. Underserved areas report less, even when problems are worse.
A 2025 study in the Annals of Applied Statistics found that resident-reported city data carries reporting bias: using New York City 311 heating complaints, the authors identified neighborhood traits that predict under-reporting (Boxer et al., 2025). Lower-income and minority neighborhoods tend to under-report problems to 311 even when need is greater (Kontokosta & Hong, 2021; Kontokosta, Hong & Korsberg, 2017). And reporting a problem to 311 is a different act from weighing in on policy (White & Trump, 2018).
→ Why CityLens maps per-resident rates and compares voice with problems instead of trusting raw comment counts.
2. Public commenters do not represent the city.
Sahn's 2024 study of San Francisco Planning Commission comments found commenters skew white, older and toward homeowners, and that this input still shapes outcomes (Sahn, 2024). Meeting participants are more likely to be homeowners and older (Governing, 2025), and engagement guidance for local housing strategies describes the gap as a barrier problem in government processes rather than a lack of interest (Housing Solutions Lab, 2026).
→ Why CityLens has a "Who gets heard" panel and a "Who we are not hearing from" table.
3. Immigrant and limited-English residents face real barriers.
A Long Beach study of Cambodian, Filipino and Latinx residents found three barriers: intimidation and distrust, gaps in knowing what services exist, and practical limits like language and transportation; heightened immigration enforcement discourages participation even among U.S. citizens (UC Irvine, 2025). A 2026 Rice University study of Houston's Asian residents found language barriers, unfamiliarity with U.S. political processes, experiences with governments abroad and competing priorities make participation harder (Rice University, 2026).
→ Why limited-English share is part of CityLens's underheard rule. San José has large Vietnamese, Chinese and Spanish-speaking communities.
4. AI summaries can make minority voices quieter.
A 2025 study of large-scale opinion aggregation found LLMs tend to underrepresent minority positions when summarizing public input (Zhu et al., 2025, Stanford Digital Economy Lab). A 2026 study of federal public comments found that the same comment, attributed to a different commenter, got a different summary ("All public voices are equal…", 2026). Federal agencies already use approved LLMs to analyze citizen input without fairness evaluation (NeurIPS, 2025).
→ Why every CityLens label must quote the resident's own words, and why fairness checks are built in.
What it does
CityLens is a map-first workspace for San José council staff, built on real city data.
- Places comments on the map: Each letter or email that includes location detail (an address, intersection, neighborhood or ZIP code) is placed in one of San José's 215 census tracts, and its map dot is randomly placed within that census tract, so the map never shows a location more exact than the census tract.
- Labels every comment: IBM Bob assigns each one a section, subsection and stance, backed by an exact quote from the original text, including comments in Spanish, Vietnamese, Chinese and Tagalog, labeled in their own language.
- Three map views:
- Voice: comments per 1,000 residents.
- Problems: 311 reports or police calls per 1,000 residents, filterable by report type.
- Underheard: many problems, few comments.
- Side-by-side can show a different place and map type on each map, zoomed together or separately.
- Who gets heard panel: IBM AI Fairness 360 results become plain sentences such as "Renter neighborhoods are heard about half as often as homeowner ones," with the data to back it up and the disparate-impact math one click away.
- Draw your own regions: Staff can draw one or more areas on the map (overlapping drawings merge), open any council district or neighborhood, or compare two places side by side, and see combined analytics.
- Analytics dashboard: For the city, a region or one census tract:
- a "How much to trust these numbers" card (share of comments placed on the map, share that are real rather than simulated, average AI label confidence, and share labeled by IBM Bob)
- population, renters, English-only households and income compared with the city
- what people write about, and support vs. opposition in policy sections
- 311 and police calls over time, to spot sustained rises or drops in an area (changes can reflect real conditions or changes in how people report), plus what people report to 311 and what police are called for
- languages people wrote in compared with languages spoken at home, who is writing (distinct writers, form-letter share, organizations), when comments arrived, and whether each topic is local or citywide
- a sortable "Who we are not hearing from" table of the underheard census tracts, comparing each one's voice with its 311 reports and limited-English share, colored from deep red (almost no voice for its problems) to yellow (city level), plus a full census tract table with expected vs. actual comments
- IBM Bob assistant: Staff ask questions like "Why isn't District 5 voicing their issues?" or "Compare downtown and Willow Glen." It can also open districts and neighborhoods, highlight places on the map, compare two places, set up side-by-side views and open a section's analytics. Each answer gives:
- the finding and what stands out
- likely reasons tied to measured correlations or labeled background
- caveats and a next step
- a clickable source for every claim, which opens the data behind it
Why silence plus 311 reports is a red flag
When an area generates many problem reports but has very few comments, letters or emails to officials, we treat it as worth checking, not as immediate proof of being unheard. 311 records where a problem is, not who reported it, so some reports may come from commuters or visitors. But research suggests renters, immigrants and limited-English households are under-represented among commenters (Sahn, 2024; Housing Solutions Lab, 2026), and lower-income and minority neighborhoods tend to under-report problems to 311 even when need is greater (Kontokosta & Hong, 2021). Reporting a problem to 311 is also a different act from weighing in on policy (White & Trump, 2018). A high 311 rate in a quiet neighborhood is therefore a strong signal of a gap in voice and worth checking, especially once we account for income and the share of homes with limited English.
The rule CityLens uses (in a team settings file, not decided by AI). A census tract is underheard when both are true:
- it sends fewer than half the comments its population predicts, and
- it reports 311 problems at or above the city rate, or has limited-English households at 1.5× the city share or more.
Few comments with few problems and normal factors is labeled quiet instead, so staff aren't sent chasing neighborhoods that are simply fine. Today 43 census tracts (about 167,000 residents, 17% of the city) meet the underheard rule.
What it finds today:
| Neighborhood type | Share sending more comments than typical | Other neighborhoods | Heard |
|---|---|---|---|
| Renter-majority | 28% | 62% (homeowner) | about half as often |
| Limited-English | 30% | 57% | about half as often |
| Lower-income | 37% | 62% | about 40% less often |
Yet these same neighborhoods are 1.7–2.1× as likely to have above-median 311 reporting (and file 1.4–1.5× as many 311 reports per resident), while less-impacted homeowner neighborhoods send 1.5× as many comments per resident. (Voice findings use mostly simulated comments and demonstrate the method; the 311 side is real data.)
Impact
We want our software to help politicians direct their objectives to areas that matter and fix issues that are actually affecting people in real time. The classmates we mentioned above are who we built this for: we hope CityLens helps officials find places that are truly unheard, learn their issues and solve them.
How CityLens compares
Cities already use tools that show 311 problems or measure who joins an engagement project. None we found asks whether the neighborhoods reporting problems are the same ones writing to council.
| Tool type | What it does well | What it doesn't do |
|---|---|---|
| 311 platforms and dashboards (CivicPlus SeeClickFix, Esri ArcGIS Dashboards, NYC BoardStat, Pittsburgh Dashburgh) | Collect service requests and show volumes, hotspots and response times by district | Treat report counts as need, with no check for neighborhoods that under-report |
| Community insight platforms (Zencity) | Combine social media, surveys and polling into sentiment dashboards, with population-weighted polling | Weighting covers survey sentiment, not council comments or issue reports |
| Engagement and survey platforms (Go Vocal, Polco) | Compare participants with Census demographics. Go Vocal scores representativeness and Polco auto-weights survey results | Measure only people who joined that survey or project, and don't connect silence to problems on the ground |
| Council comment tools (Granicus eComment) | Collect support and oppose positions on agenda items and send them to officials | No documented topic analysis, mapping or representativeness check, and San José's portal has barely been used since 2023 |
| Academic research (NYU Marron Institute, Cornell Tech) | Show that 311 under-reporting is real and estimate it statistically | Not a tool staff can use day to day. Cornell's method was trialed in NYC and Chicago |
What CityLens adds
- Both sides in one view: what residents wrote to council and what they reported to 311 and police, per resident and per census tract, never added together.
- Silence checked against need: a census tract is underheard only when it sends fewer than half its expected comments and has high 311 reporting or a large limited-English share. Engagement platforms measure who showed up. CityLens asks whether the people who didn't show up have problems.
- Language access built into the rule: survey weighting can't recover people who couldn't read the survey. CityLens counts limited-English share directly and labels comments in Spanish, Vietnamese, Chinese and Tagalog in their own language.
- The city's real comment record: CityLens reads the scanned "Letters from the Public" PDFs on Legistar, so residents don't need to learn a new system.
- Fairness shown, not assumed: IBM AI Fairness 360 metrics in plain language, and every AI label tied to an exact quote.
Try it
- Live app: city-lens-livid.vercel.app. Try the chat with:
Tell me what the community with the most voice and least voice is and then tell me reasons as to why this is
- Code and setup: github.com/33k0/CityLens. The README covers running it locally (
npm install,npm run dev), tests (npm test) and rebuilding the data. No keys are in the repository.
The metrics we derived
Every number is computed in code, never by an AI model. The unit is the census tract (San José has 215). Comments, 311 reports and police calls are kept separate and compared only through per-resident rates and rankings, never added together.
Rates
| Metric | How we get it |
|---|---|
| Comments per 1,000 residents (Voice map) | Comments in the census tract ÷ residents × 1,000 |
| 311 reports per 1,000 a year (Problems map) | 311 problem reports ÷ residents × 1,000, scaled to a year |
| Police calls per 1,000 a year | Same formula and same 16 months as 311 |
| Expected comments | The census tract's share of the population × all placed comments |
| Participation gap | (comments − expected) ÷ expected; −63% = 63% fewer than expected |
Repeat submissions are removed (RapidFuzz), and form-letter campaigns (MinHash) count once in the fairness checks. Billing and account requests are left out of 311. Police calls are calls, not crimes.
Scores: putting voice and problems on the same scale
San José has about 217,000 311 reports but only a few hundred real comments, so the raw counts can't be compared. Instead, each census tract gets two scores from 0 to 100:
- Voice score: line up all 215 census tracts from fewest to most comments per resident. The score is how far along the line a census tract sits. 10 means 90% of census tracts write in more than it does. 50 is the middle of the city; 90 is near the top.
- Problems score: the same line-up, using 311 reports per resident (or police calls, if selected). 90 means it reports more problems than 90% of census tracts.
Because both scores use the same 0–100 scale, they can be compared directly.
| Metric | What it means | How we get it |
|---|---|---|
| Underheard map score | How far problems outpace voice; the darker the purple, the bigger the gap | Problems score − voice score |
| Problems without voice | The starkest gaps, highlighted on the map | Problems score of 70 or more and voice score of 30 or less |
| Voice for its problems (the red-to-yellow column) | How much a place speaks up for each problem it reports, compared with the city | (comments per resident ÷ 311 reports per resident) ÷ the same ratio for the whole city. 1.0 = city level; 0.25 = a quarter of the city's voice per problem; 0 = no voice at all |
| Underheard census tract (the final label) | The places worth outreach | Sends under half the comments its population predicts, and either reports 311 problems at or above the city rate or has limited-English households at 1.5× the city share. Few comments with few problems is labeled quiet instead |
Fairness (IBM AI Fairness 360)
| Metric | How we get it |
|---|---|
| Heard | Comment rate above the citywide median |
| Share heard, by group | Share of renter-majority, limited-English, lower-income or majority non-white census tracts that are heard, vs. all others |
| Disparate impact | Group's share heard ÷ everyone else's; below 0.8 is the standard red flag |
| Statistical parity difference | Group's share heard − everyone else's; −0.34 = 34 points less |
| The 311 mirror | The same test on 311 reports: these groups are 1.7–2.1× as likely to be above the median |
"Limited-English" means the top quarter of census tracts (over 17.6% of households). Results are cross-checked with pandas, and the app recomputes them live for any section or drawn region.
Patterns and trust
| Metric | How we get it |
|---|---|
| Correlations | Spearman rank correlation between a neighborhood trait and an outcome; describes places, not cause |
| Support vs. opposition | (support − oppose) ÷ (support + oppose), policy sections only |
| Local or citywide | Share of a section's comments from its busiest census tract |
| Ask for a specific fix | Share of comments IBM Bob flagged as naming a concrete problem or action |
| How much to trust these numbers | Share placed on the map, share real vs. simulated, average label confidence, share labeled by IBM Bob |
How we built it
Data pipeline (Python): We pulled real "Letters from the Public" PDFs from San José's Legistar system, read scanned pages with pdfplumber and Tesseract OCR, split each PDF into individual letters, and removed personal information. We joined 311 service requests and SJPD calls for service to census tracts, and added ACS 2020–2024 demographics, TIGER 2024 tract boundaries and MTC Equity Priority Communities.
AI labeling (IBM Bob): Taxonomy, labels, and 311 and police call mapping; details below.
App: Vite with a framework-free JavaScript map UI, D3 for maps and charts, Turf for merging drawn regions, and TypeScript for the data loaders and family-separation rules (a small React view shows the raw data). Python and JavaScript share test cases so the two implementations of the core rules can't drift apart. It runs on Vercel, where a serverless function runs IBM Bob headless with custom CityLens skills (see Responsible AI and privacy for how its answers are checked).
How AI works inside CityLens
AI does the reading, sorting and explaining; code does all the counting.
- IBM Bob built the comment taxonomy from scratch: It read the letters and emails and proposed the eight sections and their 32 subsections, with nothing preset.
- IBM Bob labeled every comment: All 1,299 letters and emails got a section, subsection, stance and an exact evidence quote. If the evidence is not in the original text word for word, it is rejected. We are this strict because LLMs tend to flatten minority and informal voices when summarizing public input (Zhu et al., 2025). Repeat submissions are removed, and form-letter campaigns count once in the fairness checks.
- IBM Bob mapped the city's 311 service types and all 198 police call types: They map onto the same sections, so comments, 311 and police calls can be compared by topic and used to find who is unheard.
- IBM Bob is the in-app assistant: It runs headless with custom CityLens skills and repository rules. Each question carries a data brief computed by the app (city, district and place figures with pre-checked rankings, correlations, background notes). A typical answer takes about 10 seconds. The assistant can also read and cite the AI Fairness 360 results when it explains who is underheard.
- Fairness and statistics are deterministic: IBM AI Fairness 360, pandas and Spearman correlations compute every metric (see The metrics we derived).
Responsible AI and privacy
- Privacy by design: Names, emails and phone numbers are removed as soon as each comment is loaded, and nothing finer than a census tract is ever shown. Raw PDFs and source files never leave the team's machines.
- Every AI label is traceable: Each one quotes the resident's own words, and code rejects any quote that isn't word-for-word in the original.
- AI explains, code counts: Every count, rate, ranking and fairness metric is computed in code. The underheard rule lives in a team settings file, not in a model's judgment.
- The assistant's sources are checked: The server drops any citation that doesn't point to a real comment, metric or data file, rejects answers that make claims without one, and allows only map actions that match real districts, census tracts and sections. Every figure the assistant sees is computed in code beforehand, and each answer separates findings from background and caveats.
- Honest about uncertainty: Simulated data is labeled everywhere, every map shows how many comments could be placed, and correlations are described as patterns between places, never as traits of a group. Police calls are presented as calls, not crimes.
- Staff-only: The assistant is built for council staff and is not public-facing.
Built with
AI and analysis
- IBM Bob Shell 2.0.6: taxonomy, labeling, 311 and police call mapping, staff assistant
- IBM AI Fairness 360: disparate impact and statistical parity
- pandas, GeoPandas, Shapely, SciPy (Spearman associations)
- RapidFuzz and MinHash (datasketch): duplicate and campaign detection
- pdfplumber and Tesseract OCR: scanned council letters
- langdetect
App stack
- Vite, JavaScript and TypeScript
- D3 for maps and charts; Turf for region merging
- Vercel: static site plus a serverless function that runs IBM Bob
Real datasets
| Dataset | Period | Size and coverage |
|---|---|---|
| City Council "Letters from the Public" (Legistar) | 2025–2026 | 271 letters (195 after removing repeat submissions; 105 unique voices once each form-letter campaign counts once), OCR'd and de-identified at ingest |
| San José 311 Service Requests (Open Data, CC0) | July 2025 – October 2026 | 217,415 problem reports placed in census tracts, in 22 service types |
| San José Police Calls for Service (Open Data, CC0) | Same 16 months | 352,566 calls, 88% placed in census tracts using the city's street address ranges |
| U.S. Census ACS 5-year | 2020–2024 | Population, renters, income, race, household language (C16002) |
| Census TIGER | 2024 | 215 census tracts clipped to city limits |
| MTC Equity Priority Communities | 2024 | Equity flags |
| San José GIS | Current | Council districts, neighborhoods, street centerlines |
AI tools we used to build CityLens
We used several AI technologies, several from IBM:
- IBM Bob: [FILL: keep only what your team actually did]
- coding assistance (converting the Claude Design HTML to React and filling it with real data)
- auditing: useful under constrained prompts, it found a few logic bugs and dead code
- understanding issues and making core planning decisions (how to decide what is unheard and which metrics drive it)
- Custom IBM Bob skills we wrote: They make Bob an effective in-app assistant and comment classifier. Bob built the taxonomy and labeled every comment, every 311 service type and every police call type.
- IBM AI Fairness 360: Computes disparate impact, statistical parity and Reweighing weights that the assistant uses when explaining who is underheard and that officials can see for themselves.
- Claude Code: Coding assistance and implementation.
- Claude Design: The UI design.
- Claude: Generated the simulated constituent emails used to fill out every section and the whole city; they are labeled "simulated" throughout the app.
Every number in CityLens is computed by code, never by a model. The team reviewed and tested the work: 50 front-end and 138 Python tests.
Challenges we ran into
- The data source we planned on was nearly empty: We designed around Granicus eComments, then found San José's portal has barely been used since 2023. Real written comments now arrive as scanned PDF bundles on Legistar, so we built an OCR pipeline instead; 93% of the letters came from scans.
- Placing comments on the map: Most letters don't include an address so every map shows its coverage to avoid mistaking missing locations for silence. We also correct OCR-garbled street names against the city's street list before matching.
- Messy city data: About half of 311 requests have no coordinates, and police calls give only block ranges or intersections, so we matched them to the city's street address ranges.
- Comparing very different sources: 311 reports outnumber real comments by about a thousand to one, so we compare them through per-resident rankings and never add them together (see The metrics we derived).
- Keeping AI honest: Bob sometimes returned quotes that weren't exact or broke the JSON format. We added strict checks and retries instead of trusting the output. Form-letter copies reuse their original's label, with the quote re-matched to each copy's own OCR text (102 copies needed it).
- Form-letter campaigns: One agenda item had 188 letters, 167 of them copies of one campaign. Without deduplication, it would have looked like 188 independent opinions.
Accomplishments that we're proud of
- Real data at city scale: Built on real San José data: council letters, 217,415 located 311 reports and 352,566 police calls.
- Traceable AI: Every AI label is backed by an exact quote from the original comment.
- Fairness in plain language: Fairness metrics come from IBM AI Fairness 360 and are explained in sentences a council member can repeat.
- A checked assistant: Its citations and actions are verified by the server before staff see them.
- Strong privacy defaults: Names, emails and phone numbers are removed as soon as each comment is loaded, and nothing finer than a census tract is ever shown.
What we learned
- A map of who reports is not a map of where problems are: Research on 311 data shows lower-income and minority neighborhoods under-report even when need is greater (Kontokosta & Hong, 2021).
- Faster AI summaries are not automatically fairer: LLMs tend to flatten minority and informal voices (Zhu et al., 2025), which is why we tie every label to the resident's own words.
- Silence is a signal worth checking, not a conclusion: A quiet census tract with many 311 reports might be underheard, or the reports might come from commuters. Being transparent about that uncertainty matters as much as the metric.
- Most of the work is data, not models: OCR, location matching and deduplication took more effort than the AI itself.
Limitations
- Most comments are simulated for now: 1,022 of our 1,217 unique comments are AI-generated simulated emails, placed to follow known participation patterns, so comment patterns demonstrate the method rather than real findings. They are labeled "simulated" throughout the app.
- Not every comment has a location: By nature, not every comment contains location data; 56% of our comments (676 of 1,217) contain enough detail to be placed in a census tract. We can't fully fix this, so the app shows its coverage everywhere.
- 311 and police calls measure reporting, not need: Police calls are calls, not crimes; they include officer-initiated stops and follow where officers patrol.
- No access to the city's inbox yet: CityLens does not yet have access to the city's email inbox or more sources of public input.
- No resident-facing side yet: Residents can't submit comments directly.
- Correlations describe places, not people: They do not show cause.
What's next for CityLens
- Replace simulated data with real comments: Add all 405 "Letters from the Public" PDFs and, with the city's permission, the comments sent to its email inbox.
- Human review: Have city staff audit a sample of AI labels and publish the agreement rate.
- Resident-facing intake: Let residents submit comments directly, in their own language, including anonymously.
- More public input and safety data: Social media and crime-rate data, to make it a more comprehensive tool.
- Pilot with a council office: Then expand to other cities that publish council correspondence.
Sources
- Boxer, K. S., Hong, B., Kontokosta, C. E. & Neill, D. B. (2025). Estimating reporting bias in 311 complaint data. The Annals of Applied Statistics, 19(2). PDF · NSF record
- Kontokosta, C. E. & Hong, B. (2021). Bias in smart city governance: How socio-spatial disparities in 311 complaint behavior impact the fairness of data-driven decisions. Sustainable Cities and Society. Link
- Kontokosta, C. E., Hong, B. & Korsberg, K. (2017). Equity in 311 reporting: Understanding socio-spatial differentials in the propensity to complain. arXiv
- White, A. & Trump, K.-S. (2018). The promises and pitfalls of 311 data. Urban Affairs Review. Link
- Sahn, A. (2024). Public Comment and Public Policy (San Francisco Planning Commission comments). Summary
- Governing (2025). Housing and the pitfalls of public meetings. Link
- Housing Solutions Lab, NYU Furman Center (2026). Engaging the community in a local housing strategy. Link
- UC Irvine (2025). Long Beach immigrant civic engagement study. EurekAlert
- Rice University, Kinder Institute (2026). Houston's Asian population surges, but political representation lags. Link
- Zhu, S., Yang, S., Bakker, M. A., Pentland, A. & Pei, J. (2025). Can AI truly represent your voice in deliberations? A comprehensive study of large-scale opinion aggregation with LLMs. Stanford Digital Economy Lab. Link
- Anonymous (2026). All public voices are equal, but are some more equal than others to LLMs? alphaXiv
- NeurIPS (2025). Federal agencies' use of approved LLMs to analyze citizen input. Link


Log in or sign up for Devpost to join the conversation.