-
-
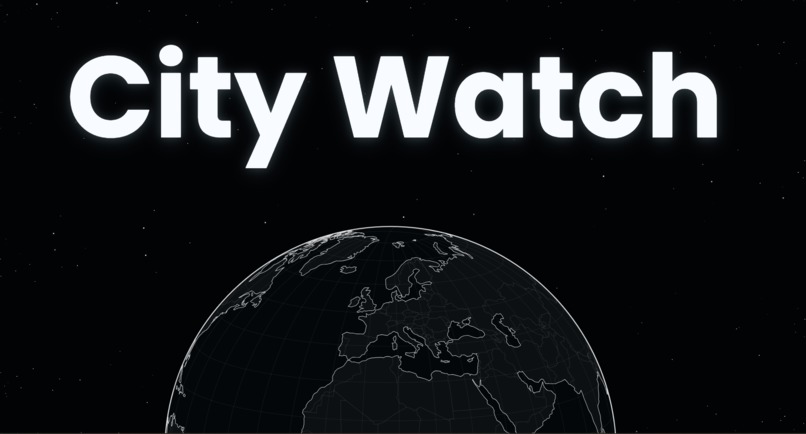
The UI for City Watch.
-
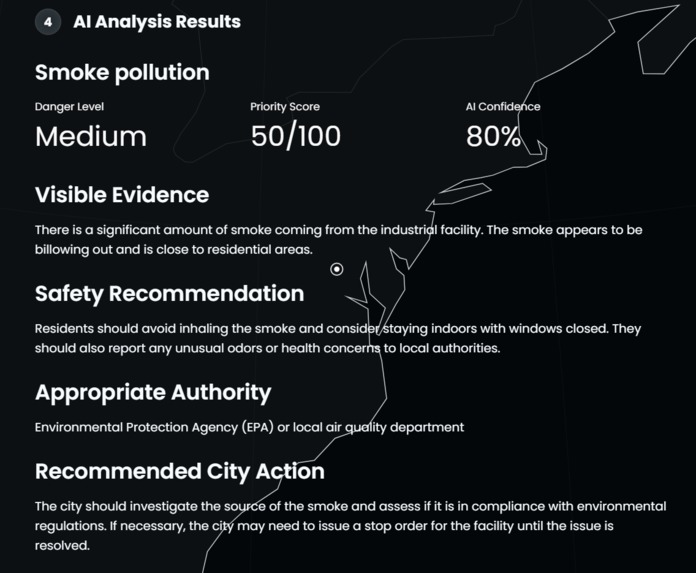
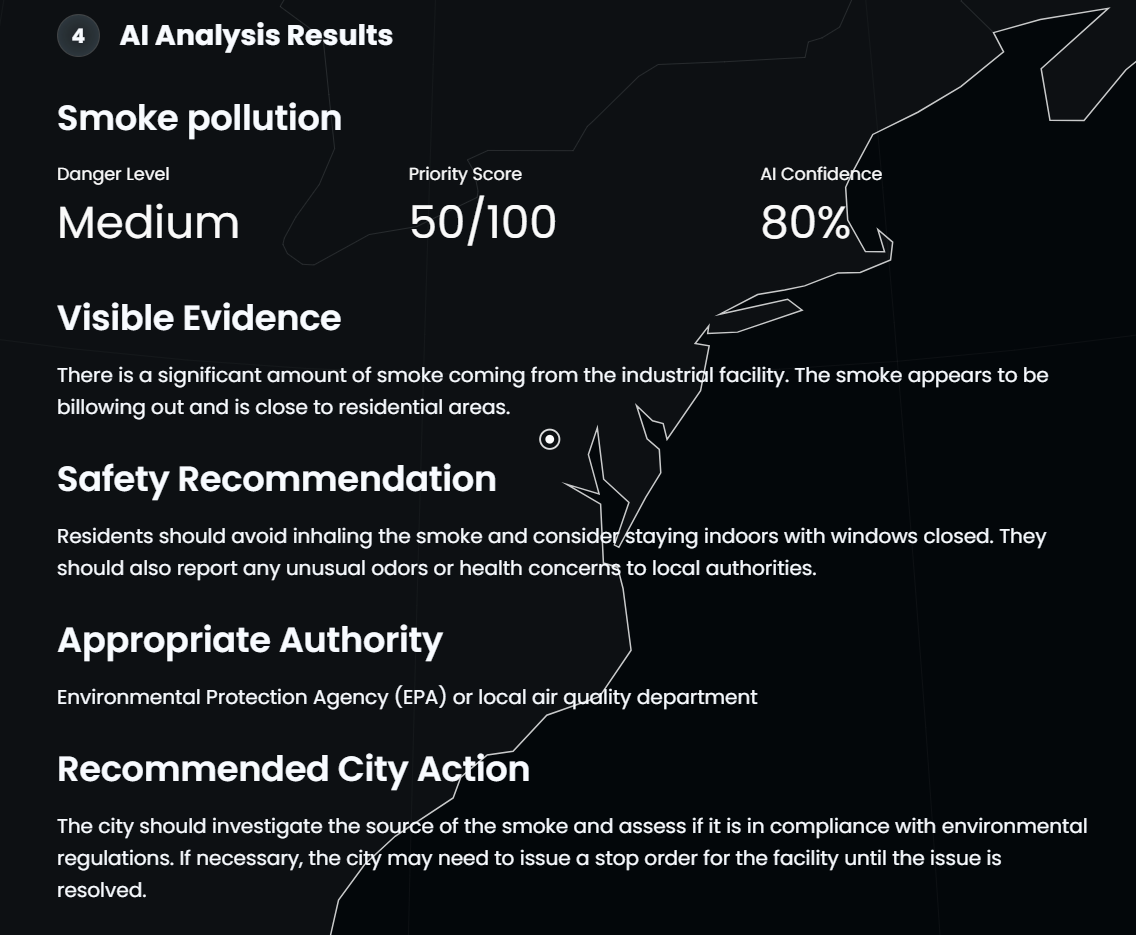
AI analysis on air pollution by City Watch.
-
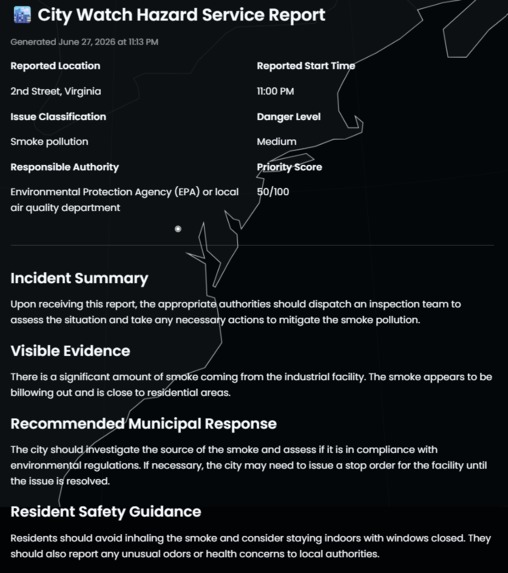
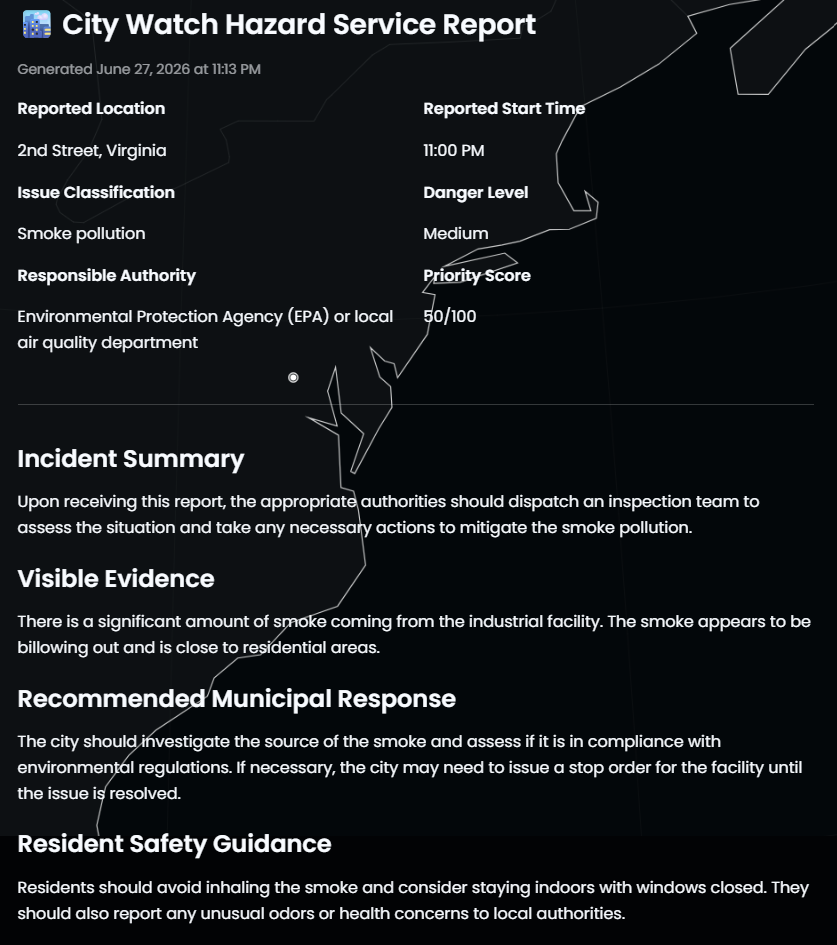
City Watch's formatted, concise, and professional hazard report.
-

The reasoning behind City Watch's decisions. This includes priority scores, issue identifications, evidence reasoning, and more.

Inspiration
To begin, City Watch was inspired by the disconnect between everyday citizens and urban reporting systems. Urban infrastructure problems such as potholes, flooding, blocked sidewalks, and more are often noticed by residents long before they are officially addressed. However, reporting these issues typically requires knowing the correct department, describing the problem in technical terms, and navigating different city systems; in other words, it can be a hassle. Thus, we wanted to simplify this process by enabling anyone to report a hazard using only a photograph, while the AI does the rest: interpretation, classification, advising, and routing.
What it does
City Watch is an AI-powered urban hazard reporting tool that converts a user-submitted photo into a structured municipal-style service report. Users upload an image of a potential city hazard, optionally add a description, and provide the location and time of the occurrence. Then, the tool uses a locally hosted vision language model to analyze the image and generate a detailed assessment; this includes identifying the issue, estimating danger level and priority, describing visible evidence and its thought process, recommending safety precautions, suggesting the appropriate service authority, and producing a downloadable, formal service report.
How we built it
We built City Watch primarily using Python and Streamlit for the web interface, with Ollama serving a local vision-language model named Qwen2.5-VL. Uploaded images are preprocessed using Pillow, where they are resized and compressed to improve the AI's inference speed. The AI prompt is engineered to enforce structured JSON output in order to ensure consistency across all generated reports. The frontend includes a custom designed interface with CSS styling: this includes a dynamic animated globe that incorporates IP-based geolocation to visually display the user's approximate location.
Challenges we ran into
One of the main challenges was ensuring that the AI consistently returned valid JSON outputs. Early versions of the model frequently produced inconsistent or poorly formatted fields, which caused issues with the tool's rendering and user quality. We solved this issue by tightening the prompt structure and adding more robust JSON extraction logic. Next, another challenge that we ran into when creating this project was AI performance; sometimes, it would take an extensive amount of time to generate service reports. We addressed this issue by resizing and compressing images before inference, so that the AI had less difficulty interpreting the images and could generate the service reports more efficiently.
Accomplishments that we're proud of
An accomplishment that we are proud of is successfully integrating a local multimodal AI model into a real-time web application without relying on external APIs. City Watch reliably transforms a single image into a structured service report with multiple analytical dimensions. Additionally, we also achieved a highly polished user interface with smooth animations, a dynamic globe visualization, and a multi-step workflow that helps to make the tool appear seamless. In all, we are incredibly proud of our achievements in the areas of AI reasoning, structured output, and interactive design.
What we learned
Throughout this project, we learned how to effectively prompt and constrain vison-language models to produce structured and valuable outputs. Also, we gained experience in integrating local AI systems through Ollama, managing performance tradeoffs with image preprocessing, and designing interactive applications with Streamlit. Moving on, for the frontend side, we learned how to embed and control JavaScript visualizations within a Python framework, as well as how small UX decisions have a significant impact on the tool's usability and quality.
What's next for City Watch
In the future, we aim to extend City Watch into a fully functional civic reporting platform. This would include direct integration with civic departments, real time report tracking, geographic mapping of hazards, and more. Additionally, we plan to implement a dashboard for city employees to manage incoming reports and visualize infrastructure hazard trends over time. This would lead to valuable urban insights in the future such as common hazard times, locations, what department they usually adhere to, and more.


Log in or sign up for Devpost to join the conversation.