-
-
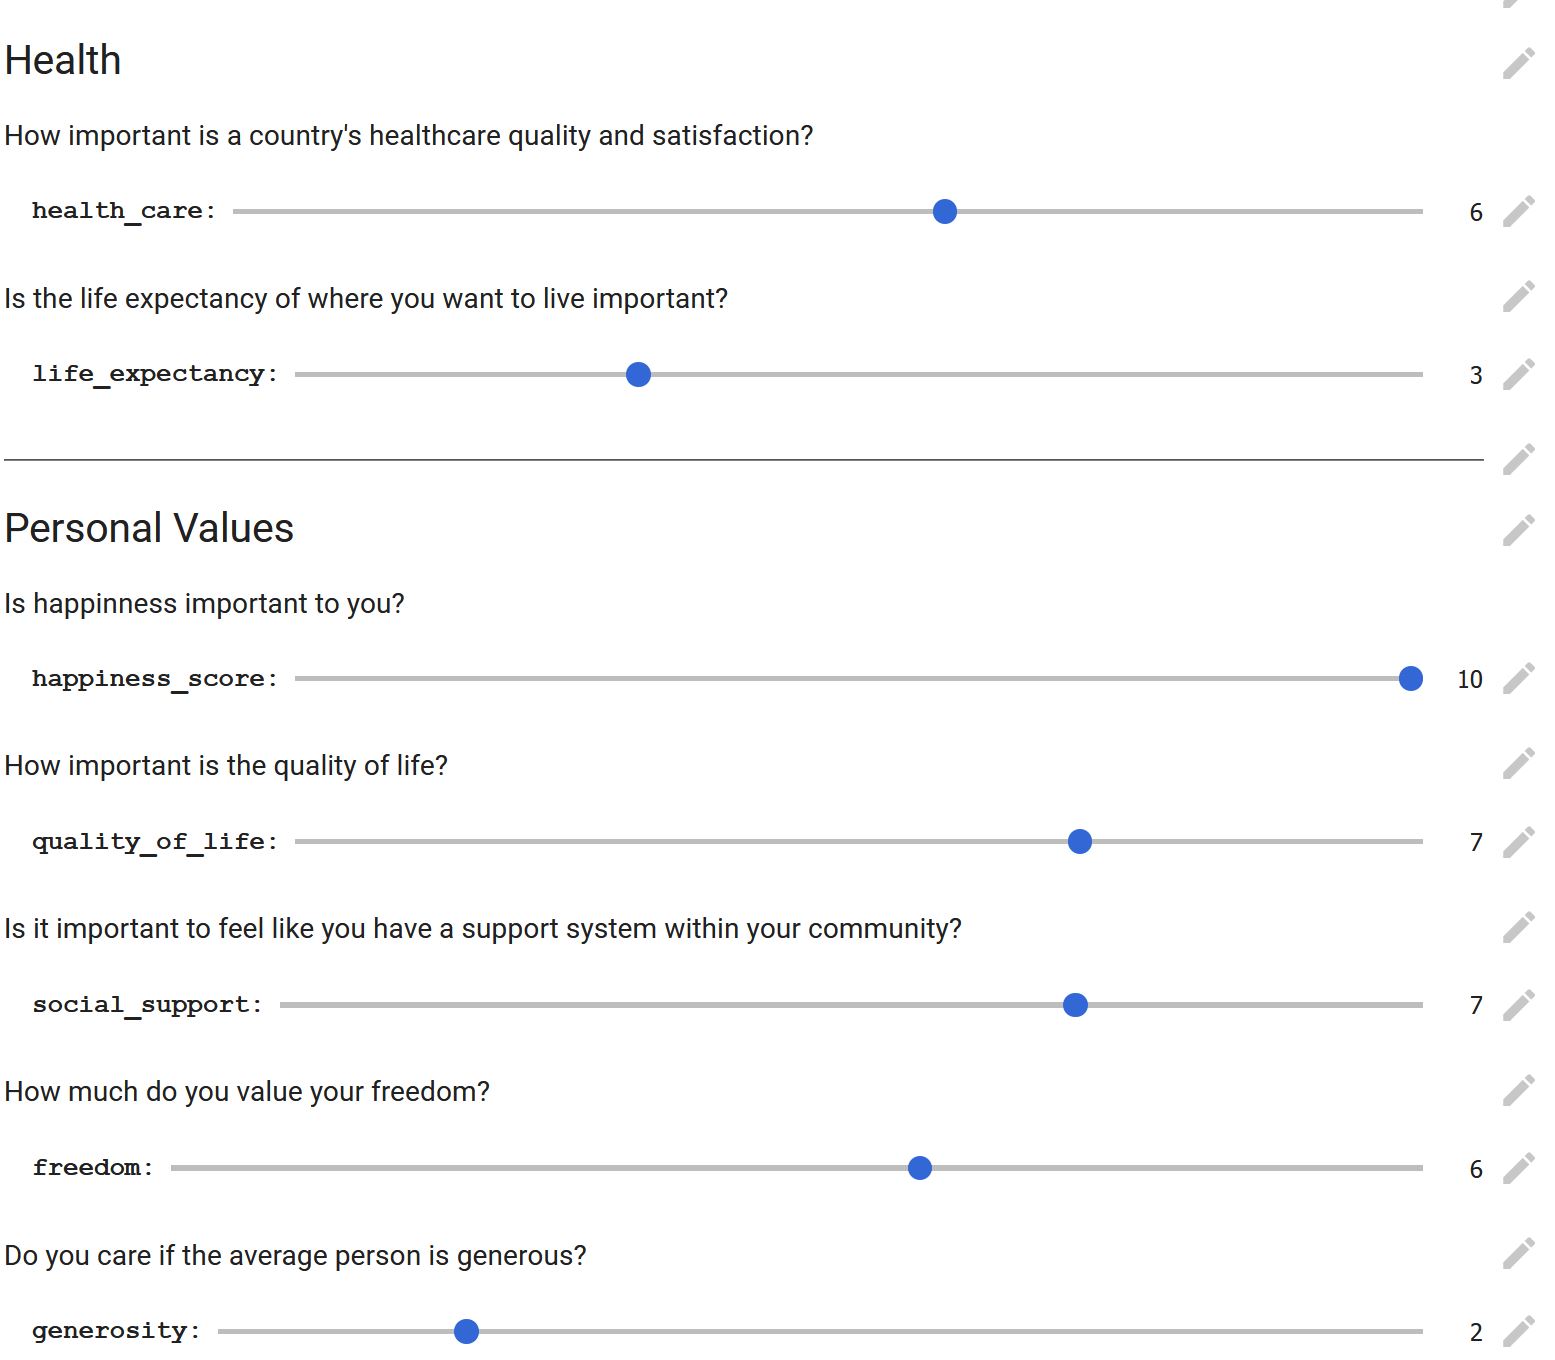
Screenshot of what the parameters section looks like within the original notebook
-
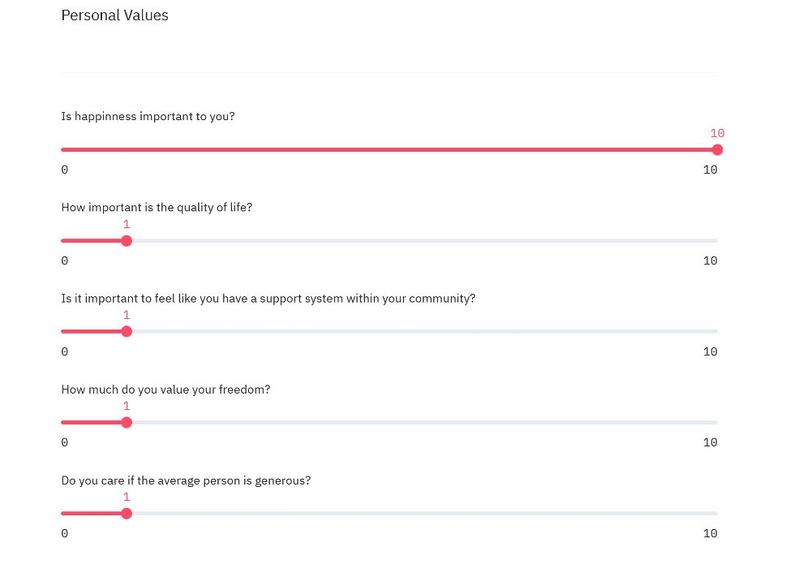
Rendered display after filling out the questionnaire within the original python notebook
-
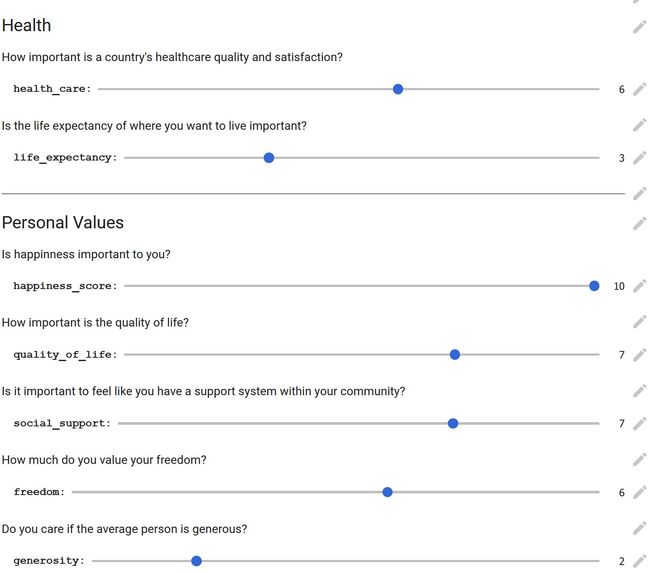
The final display of the sliders in the web application
-

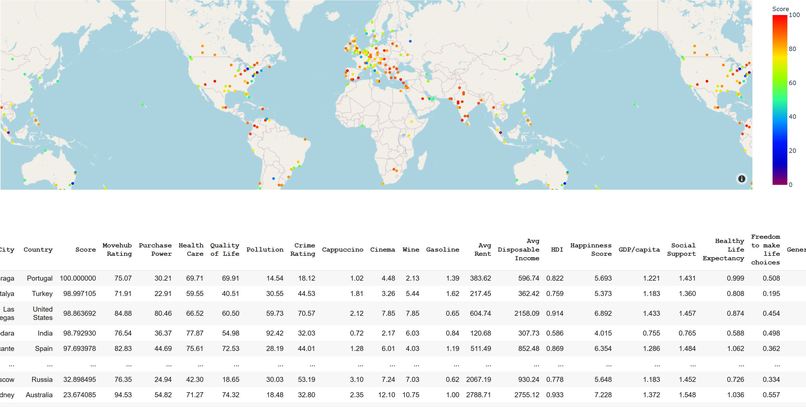
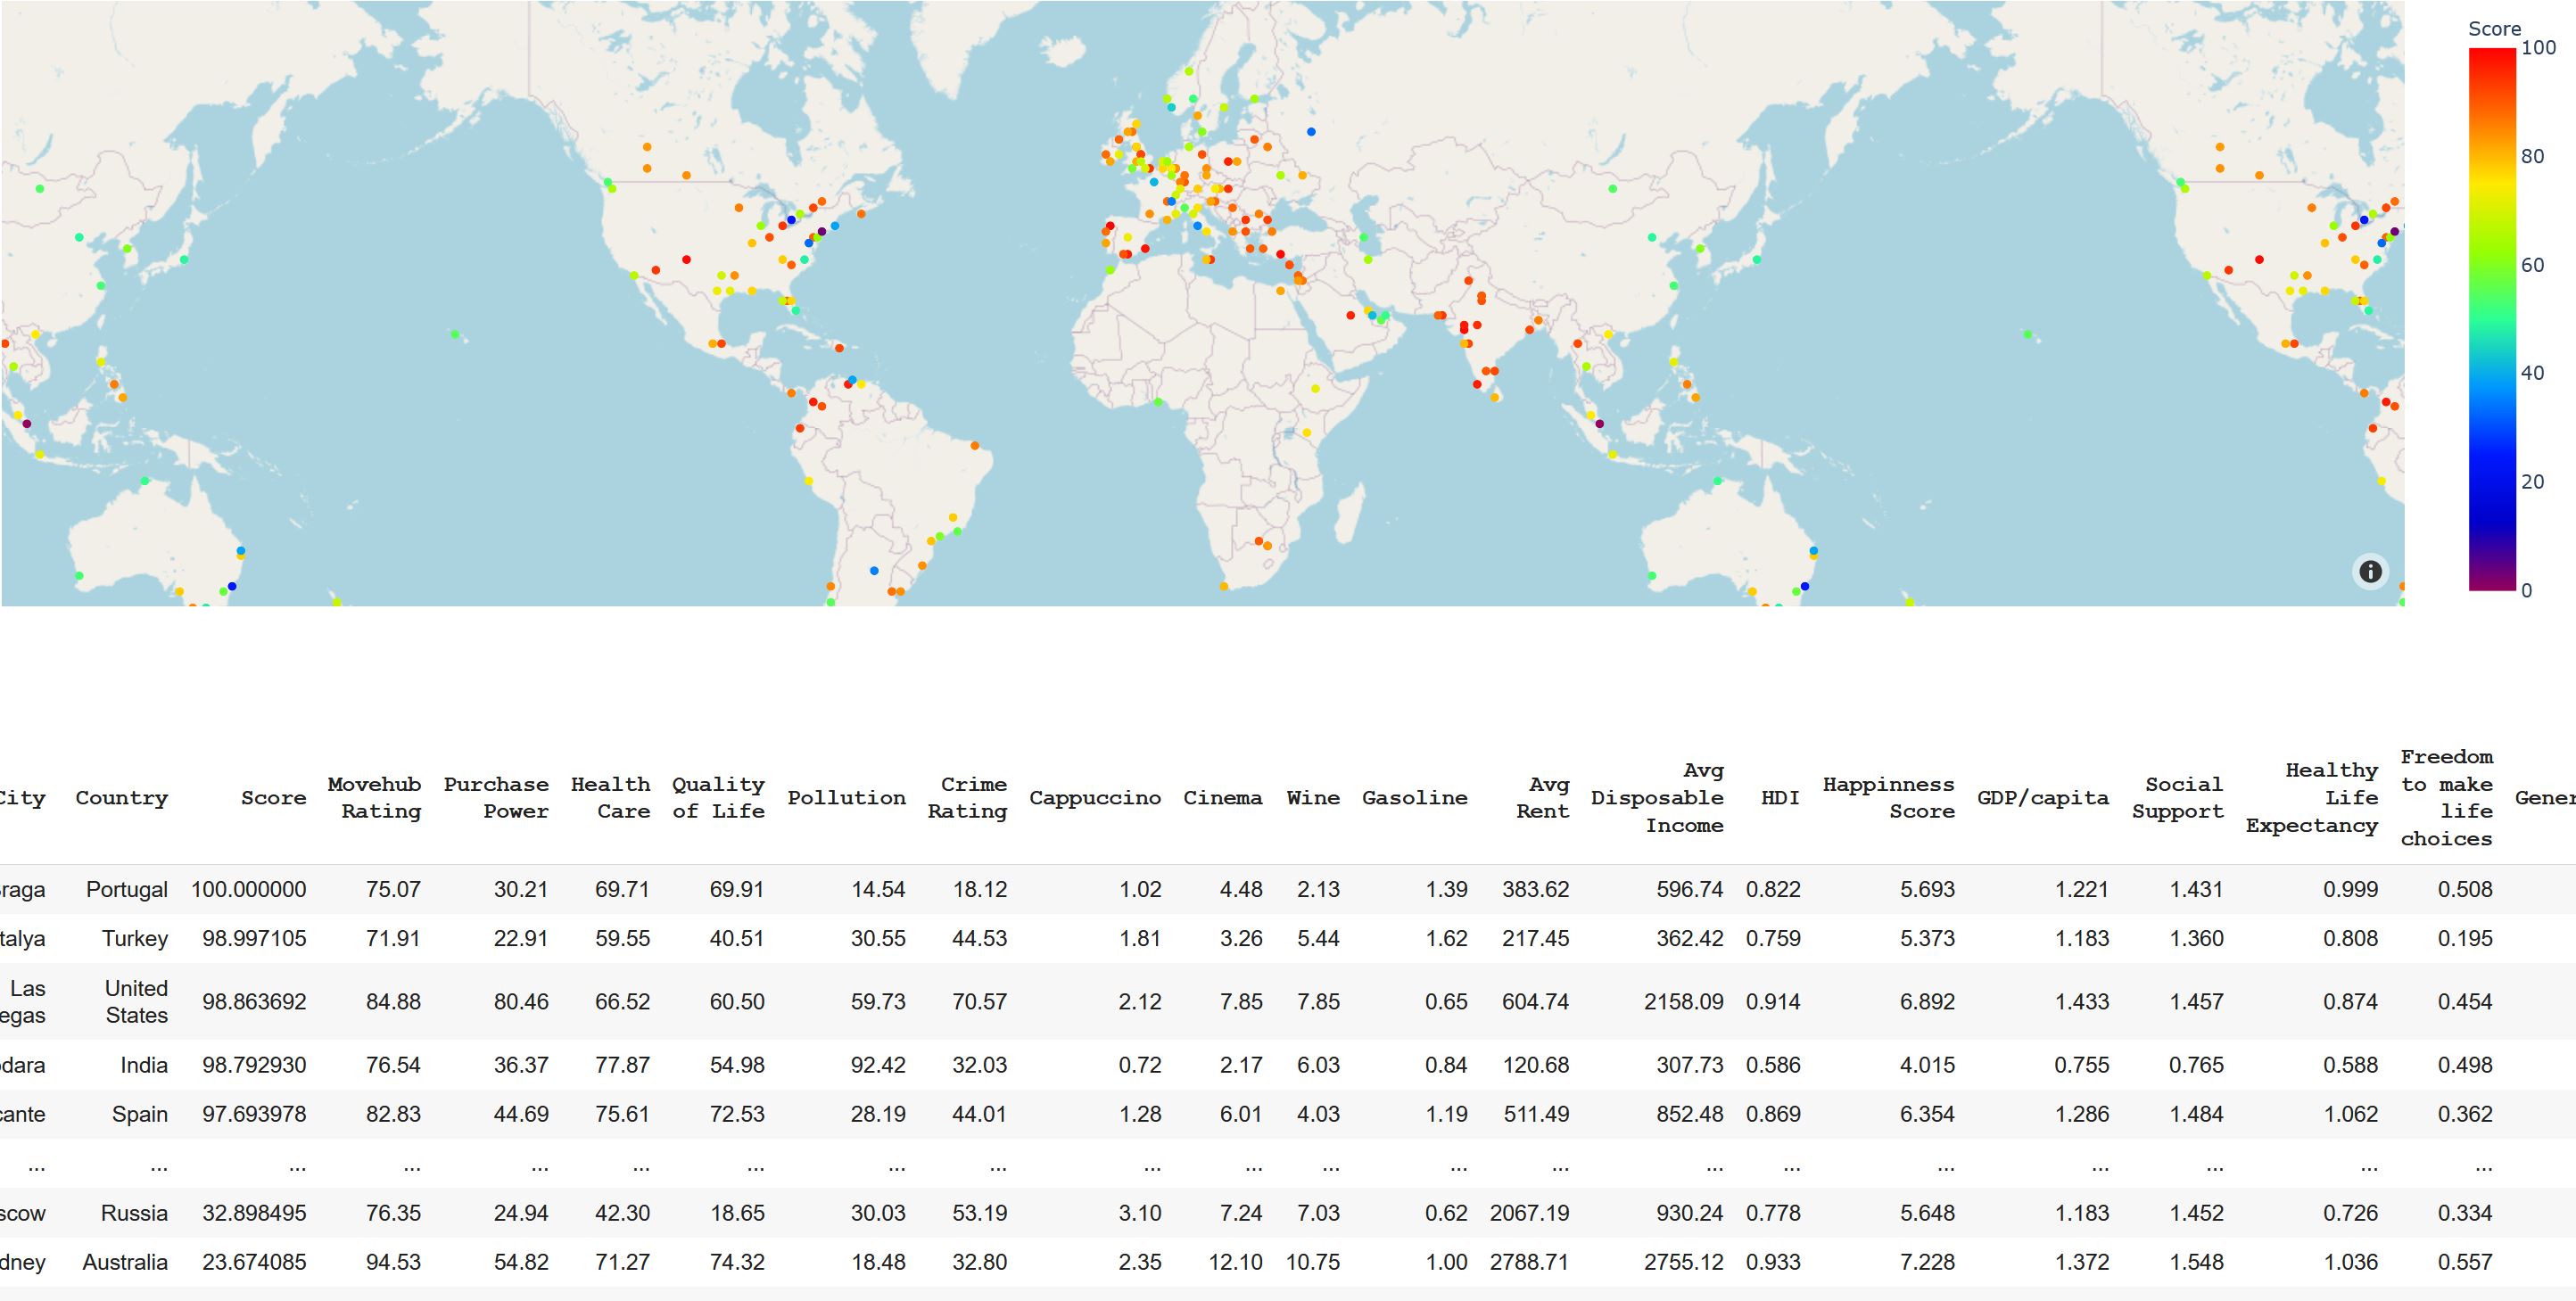
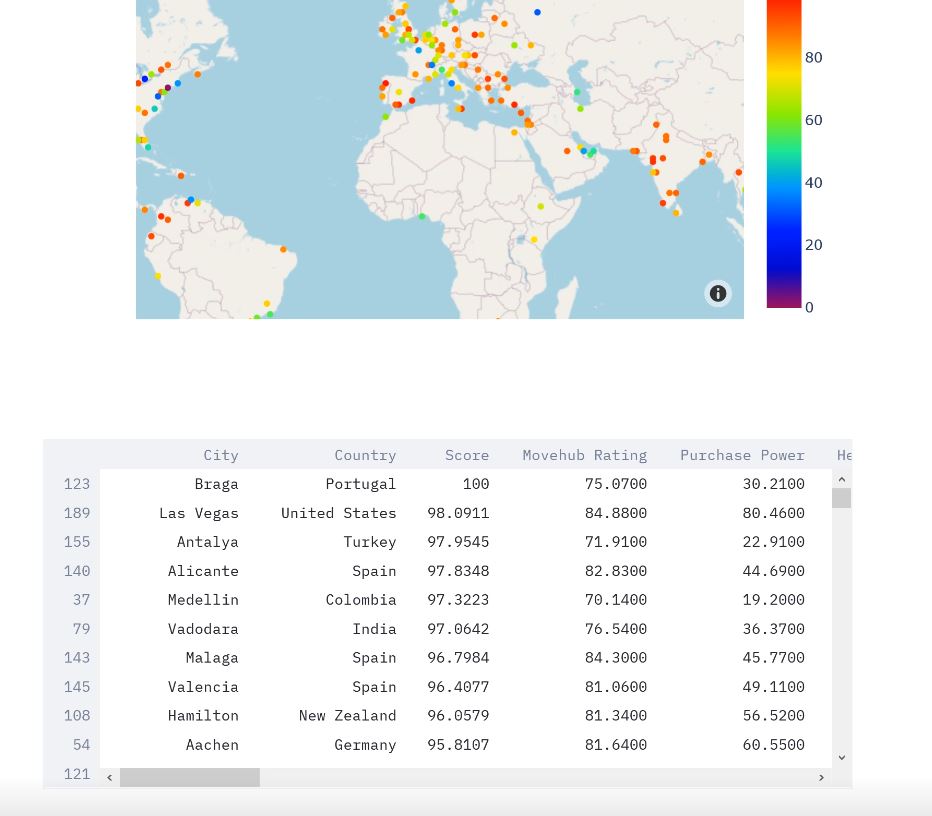
The final output map in the web application

Inspiration
We were given the idea by the organizers of the event as the beginner challenge for the TAMU Datathon.
What it does
City Search recommends a city to the user based on their perceived importance of certain characteristics of a location. Some characteristics are rather straightforward, such as crime rate or average cost of rent, but others were more subjective, such as how "happy" residents consider themselves to be or how "developed" the country a city is located in is.
How I built it
This application was built using python with the panda and plotly libraries. The datasets utilized for its creation are cited within the README in the provided GitHub link.
Challenges I ran into
One of the largest challenges was finding constants to multiply the variables by so nothing was skewed towards a certain value. For example, some characteristics are within a range of 0 to 1, while others are in the thousands of dollars, and constants had to be applied to said values so they were all roughly within the same range. (Fun fact- I had my roommate test the algorithm and found that originally our results were skewed towards Sweden).
Accomplishments that I'm proud of
I'm proud of finding the datasets! It was a lot more difficult than previously expected.
What I learned
I learned a lot about libraries within python that are used for analyzing and visualizing data.
What's next for City Search
The next feature involved for city search is pattern finding between factors and higher-level data analysis. For example, I would enjoy doing analysis on the correlation between the perception of corporate and political corruption within a country and how free people feel to make life choices. I also would like to apply clustering methods to see geographic trends with certain scores (ie- I noticed that the Scandinavian countries tended to have higher happiness scores than other countries, but I'm sure there's other clusters for other attributes).

Log in or sign up for Devpost to join the conversation.