-
-
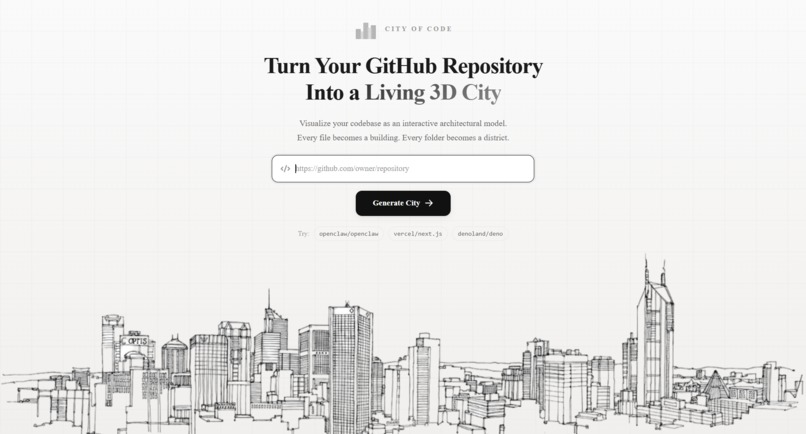
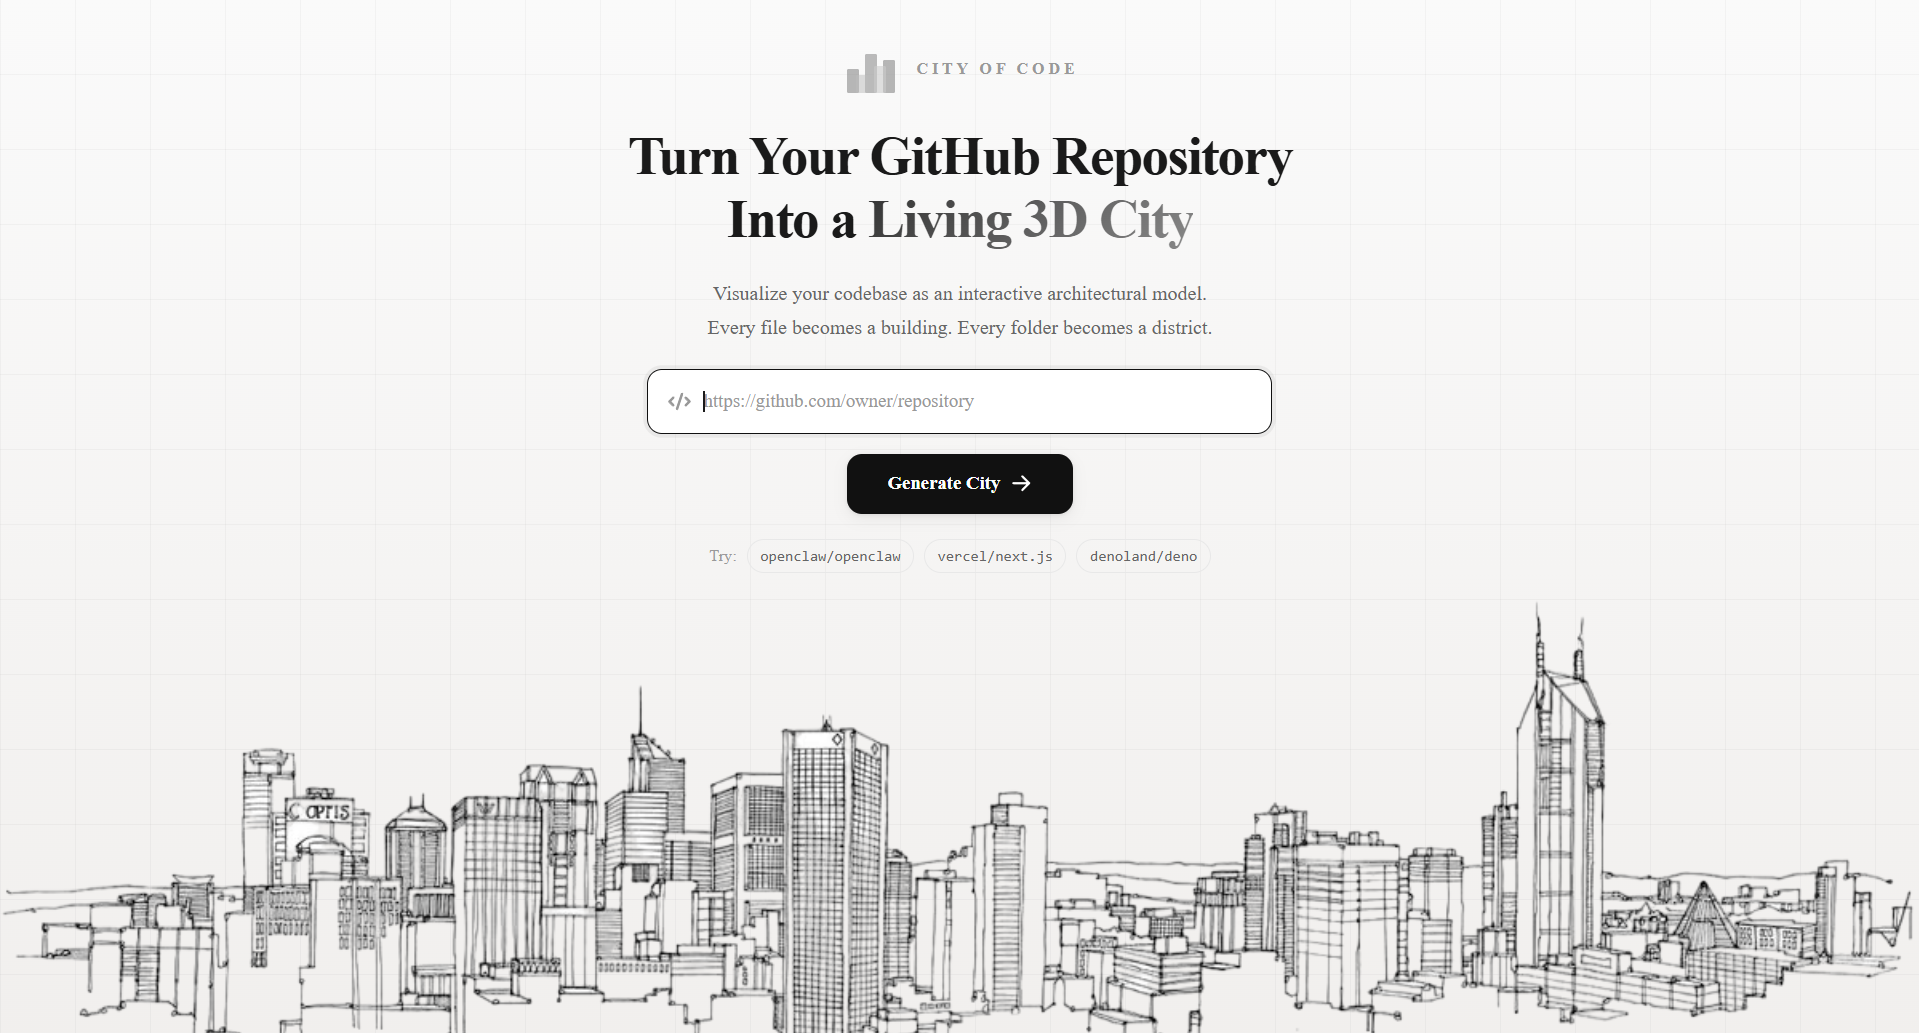
Landing page
-
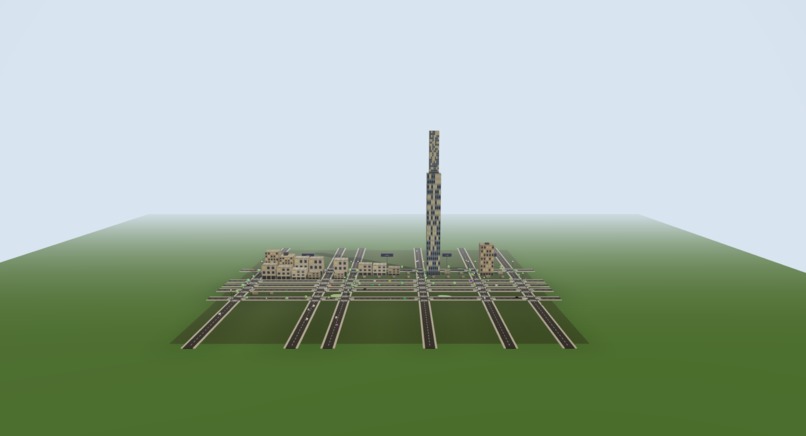
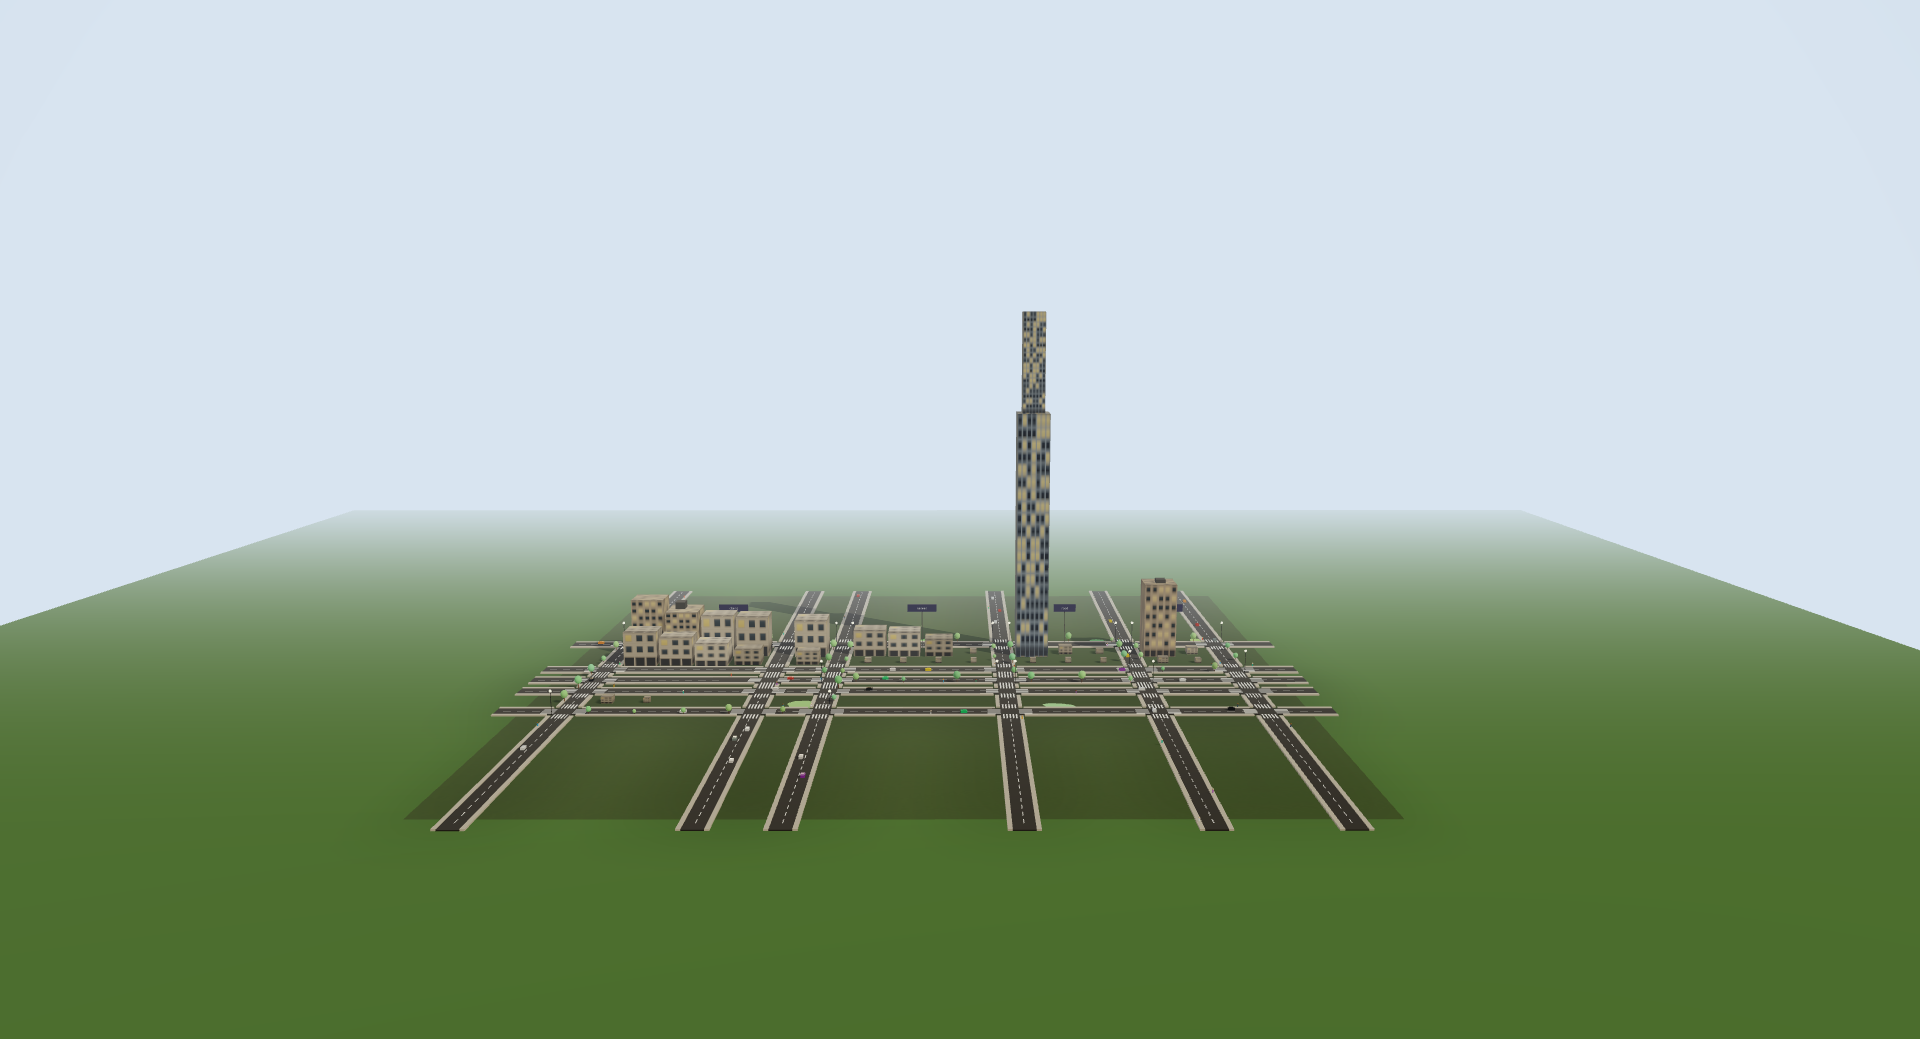
city view
-
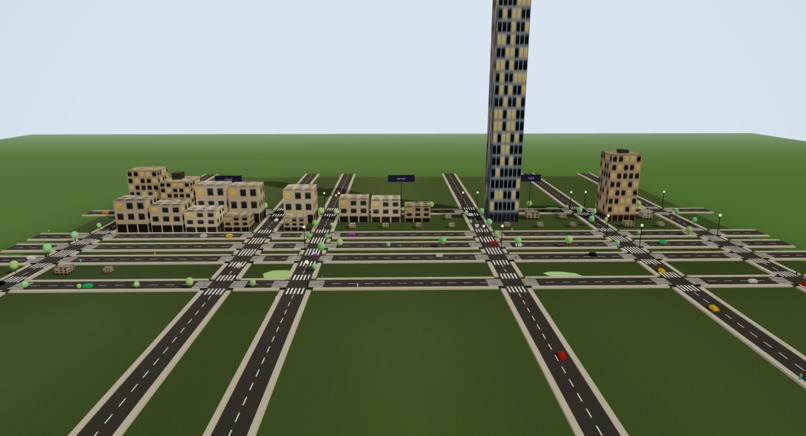
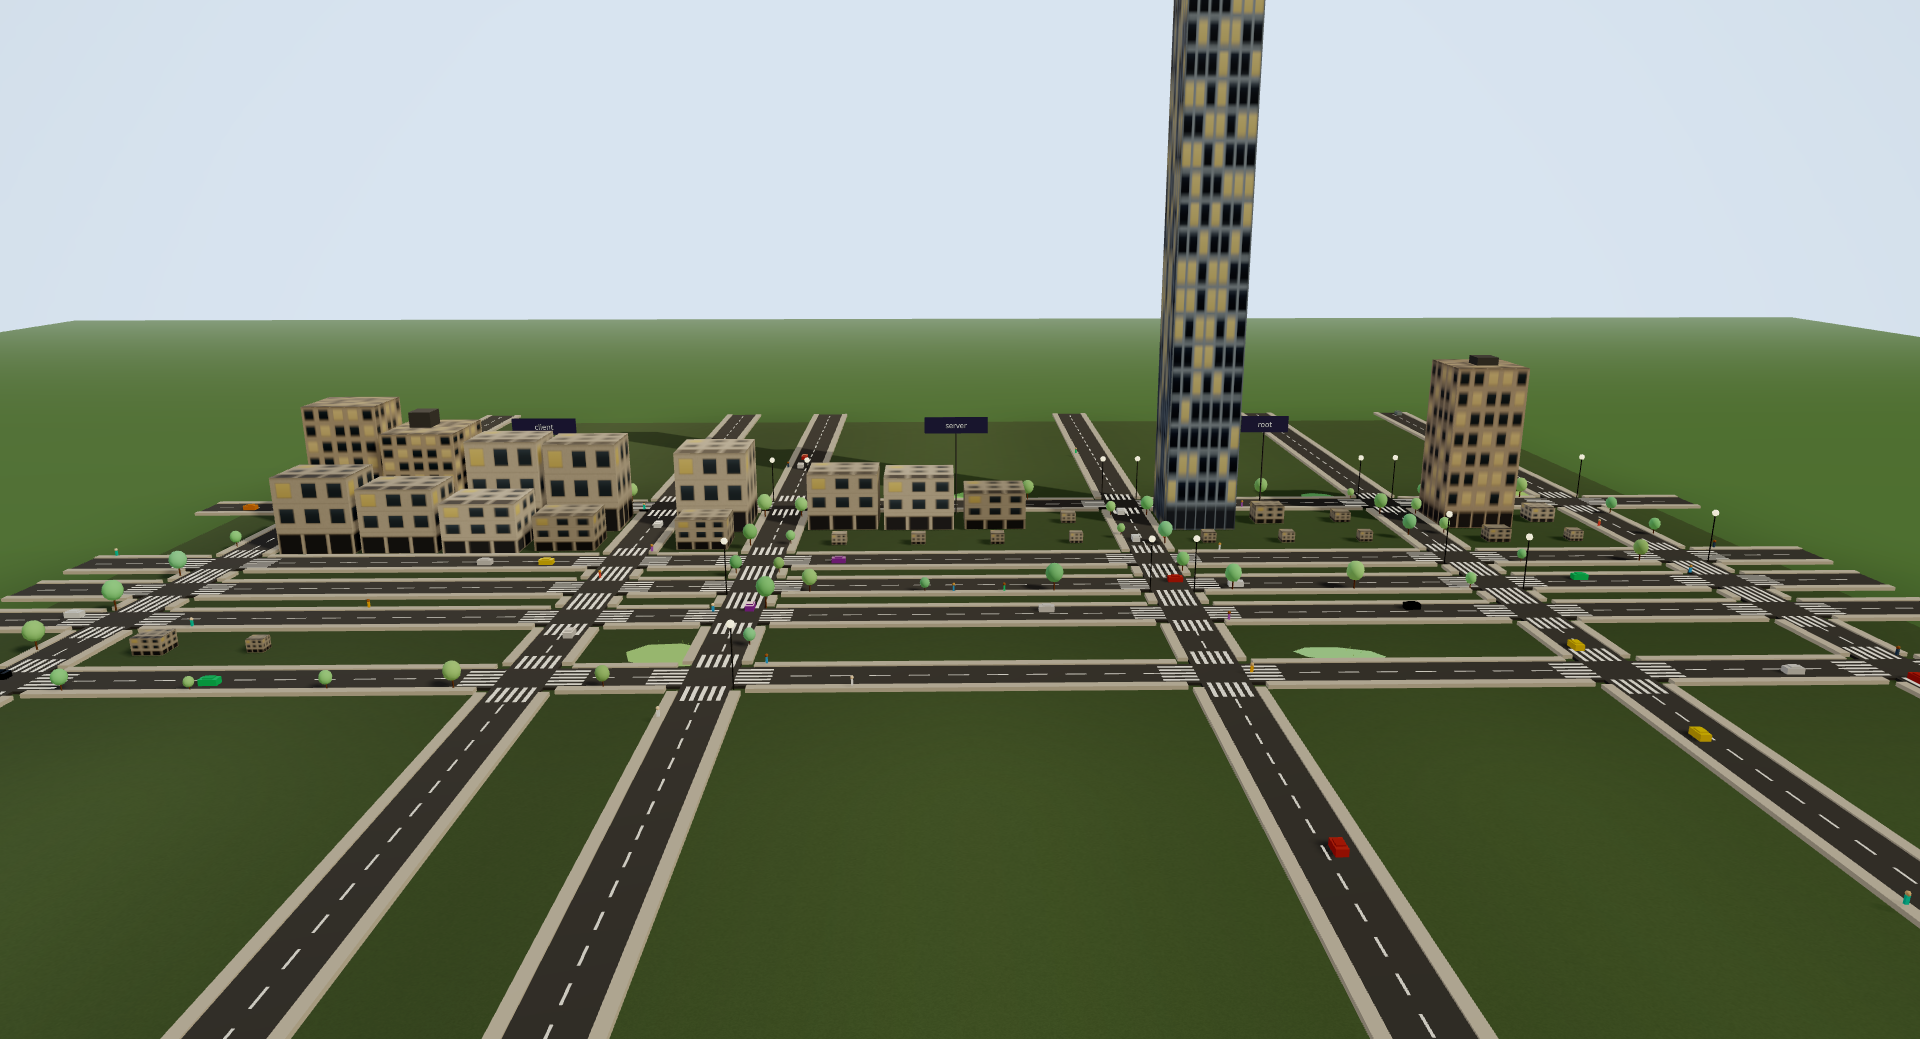
city view
-
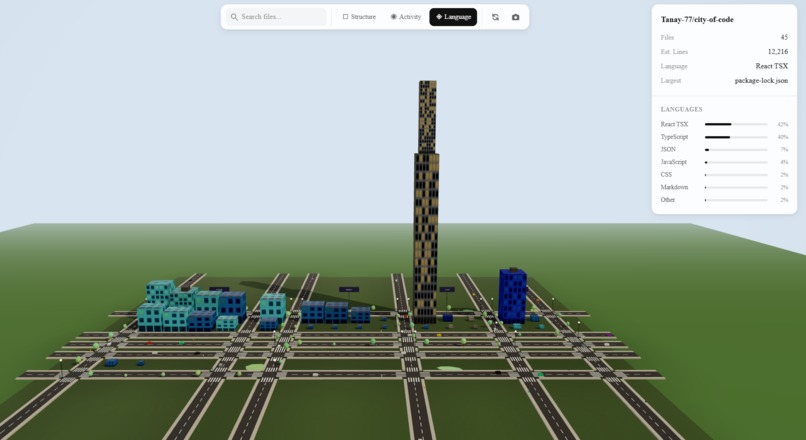
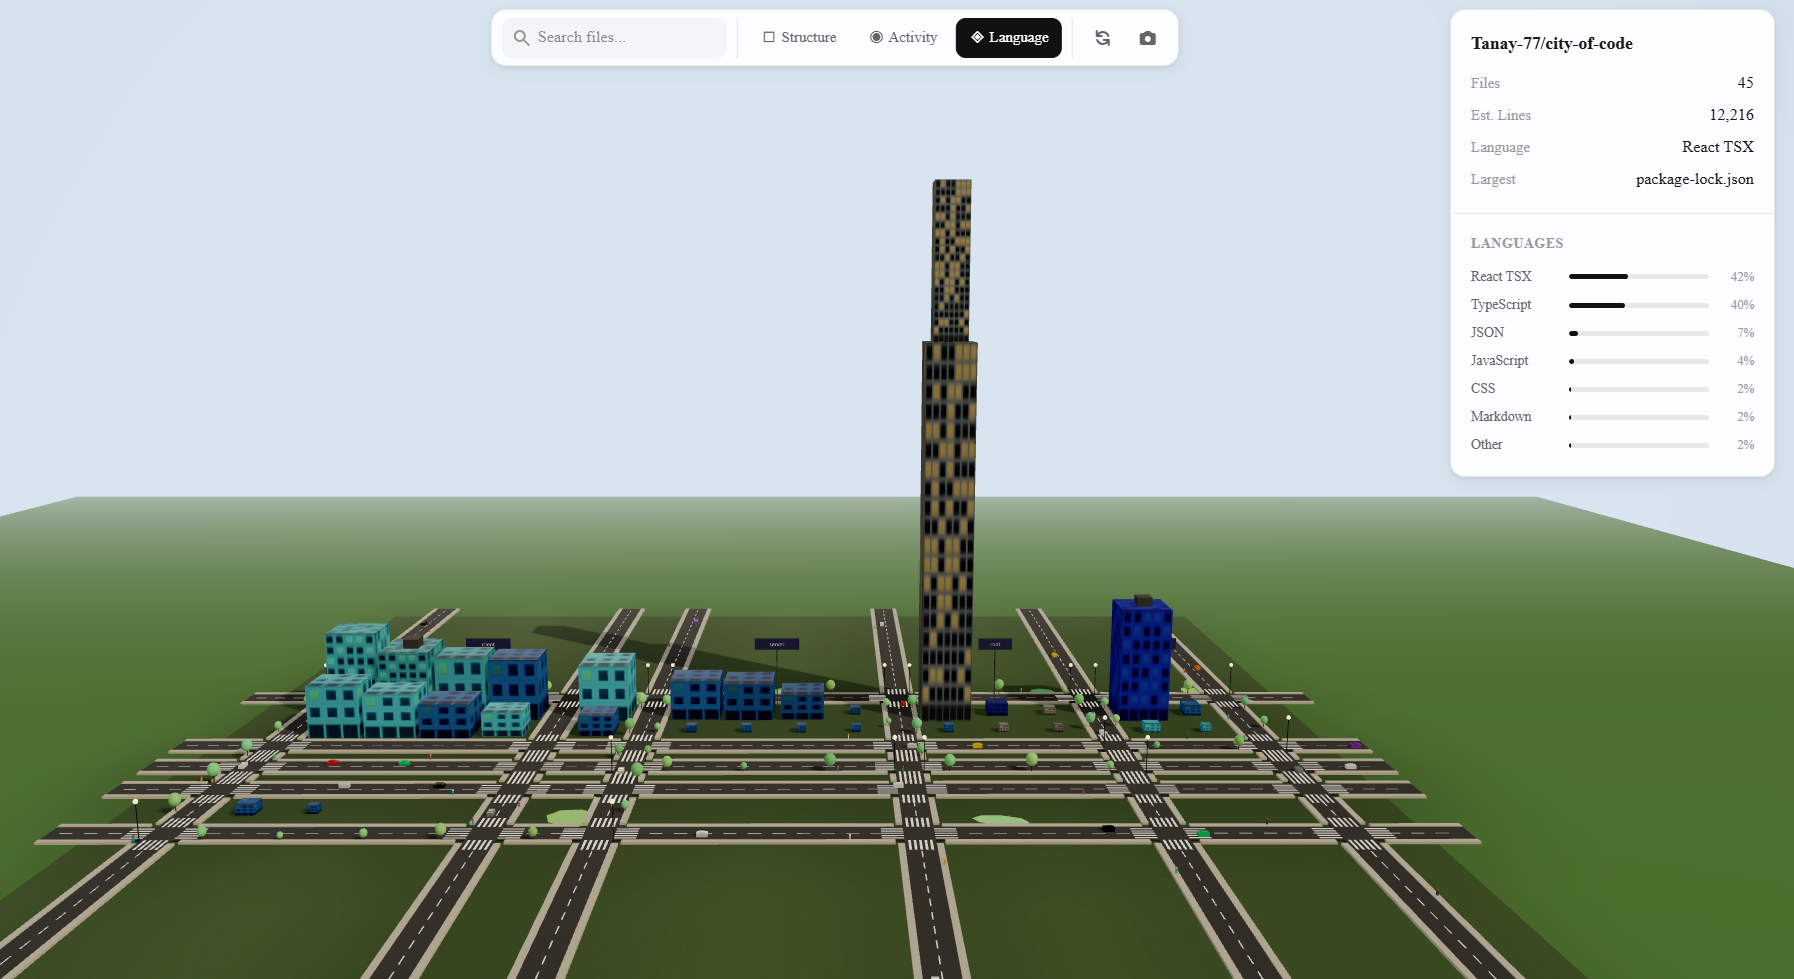
city view according to languages
Inspiration
I’ve often found myself staring at massive GitHub repositories trying to understand their structure — thousands of files, deeply nested folders, and overwhelming complexity. I wanted a better way to visualize code, something more intuitive than scrolling through endless directories.
So I started thinking: what if code could be seen like a real city? The towering skyscrapers could represent core modules, the quiet neighborhoods could represent utility files, and the bustling districts could highlight frequently updated parts of the codebase.
That’s when I built the idea of giving every repository its own skyline — a visual way to explore and understand complex codebases.
What it does
City of Code transforms any public GitHub repository into an interactive 3D city you can explore. Each file becomes a building (taller = more lines of code, wider = larger file size), and folders become districts. You can fly through the city using WASD controls and switch between three visualization modes:
Structure mode — color-coded by building type (skyscraper, tower, office, low-rise, shed) Language mode — buildings colored by programming language (JavaScript = cyan, Python = yellow, etc.) Activity mode — frequently updated files glow hot red, while stale files remain cool blue
You can search for files (matching buildings highlight in cyan), click any building to inspect file details in a sidebar, and the camera automatically pans to your selection.
It's like Google Earth, but for codebases.
How i built it
Frontend: Next.js 16 + React 19 + TypeScript, styled with Tailwind CSS 4.
3D Engine: Three.js via React Three Fiber, with React Three Drei for helpers and post-processing (Bloom + Vignette) to create cinematic visuals.
Animation: React Spring for smooth UI transitions.
State Management: Zustand for a reactive global store with fine-grained selectors.
Backend: Express 5 server with in-memory caching (15-minute TTL) and rate limiting.
Data Source: GitHub REST API — used to fetch repository file trees, commit activity stats, and language breakdowns.
City Generation: A custom algorithm groups files by folder into districts, arranges them on a grid with roads, and classifies buildings by size into architectural types. Buildings include realistic details like setbacks, antennas, and helipads.
Rendering Optimization: Uses instanced meshes, allowing 500+ buildings to render in just ~5 draw calls. Per-frame color updates happen entirely inside the Three.js render loop, avoiding unnecessary React re-renders for better performance.
Challenges i ran into
Performance with hundreds of buildings Rendering 500+ individual Three.js meshes was killing frame rates. I solved this by using InstancedMesh, bucketing buildings by type so each category renders as a single draw call with per-instance transforms and colors.
GitHub API limitations The GitHub API doesn’t allow fetching per-file commit history efficiently without making expensive per-file API calls. To solve this, I built a heuristic: fetch aggregate commit stats and distribute commit counts proportionally by file size, capped at 30% of the total.
City layout that looks realistic Designing a believable urban grid required multiple iterations of the layout algorithm. Buildings needed proper road spacing, district separation, and row wrapping. I also added architectural details like setbacks for tall buildings and varied roof types to make the city feel more alive.
Avoiding React re-renders in 3D Color changes for hover, selection, and visualization modes needed to happen inside useFrame (the Three.js render loop) instead of React state. Otherwise, the entire scene would re-render and cause frame drops.
SSR conflicts with Three.js Three.js relies on window and document, which aren’t available during server-side rendering. I solved this by using Next.js dynamic imports with SSR disabled to lazy-load the 3D canvas.
Accomplishments that i am proud of
Instanced rendering pipeline — Rendered 500+ buildings in ~5 draw calls with real-time color animations and smooth performance, with no frame drops.
The city actually looks like a city — Implemented districts, roads, varied architecture, traffic, trees, and procedural grass with noise, making the environment visually immersive.
Three meaningful visualization modes — Each mode reveals a different perspective of a codebase (structure, programming language, and activity).
Smooth end-to-end UX — From repository URL input through animated loading stages to full 3D exploration with search, clickable buildings, and camera controls.
Works on any public GitHub repository — Handles repositories of all sizes by intelligently capping analysis at 500 files and filtering out binary assets.
Community validation — The project received 200+ upvotes on Reddit, showing strong interest from the developer community.
What i learned
Instanced rendering is a game-changer Rendering many similar objects in Three.js becomes dramatically more efficient with instancing, reducing draw calls from hundreds to single digits.
React and Three.js need careful boundaries Per-frame logic should run inside useFrame instead of React state. This prevents expensive re-renders and keeps the 3D scene smooth.
GitHub’s API is powerful but has sharp edges Rate limits, missing per-file commit history, and recursive tree limits required building creative workarounds to extract useful repository insights.
Urban planning is hard — even in code Making a generated city feel natural required thinking about real-world concepts like block sizes, road grids, building setbacks, and district spacing.
Zustand’s selector pattern is crucial for performance Using fine-grained selectors ensures only the components that actually need updates re-render, which is essential in performance-sensitive 3D applications.
What's next for City of Code
Private repository support — OAuth-based GitHub authentication to allow visualization of private repositories.
Real-time collaboration — Multiple users exploring the same code city simultaneously.
Time-lapse mode — Watch the city evolve over time based on commit history, with buildings rising and new districts appearing as the project grows.
PR diff visualization — Highlight which buildings (files) changed in a pull request.
More code metrics — Visualize additional insights like code complexity, test coverage, or contributor count through building color and glow effects.
Export & share — Generate shareable links or export screenshots/videos of your city.
Support for GitLab & Bitbucket — Extend the platform beyond GitHub to support other repository hosting services.
VR / AR mode — Walk through your codebase in virtual or augmented reality.
Built With
- express.js
- next.js
- three.js
- typescript

Log in or sign up for Devpost to join the conversation.