-
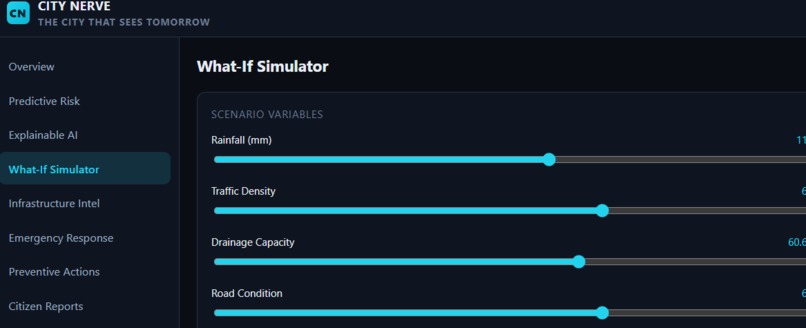
What If Stimulator
-
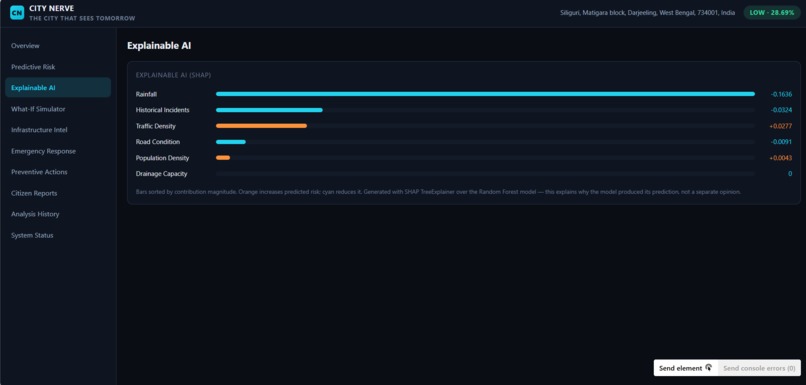
Explainable AI
-
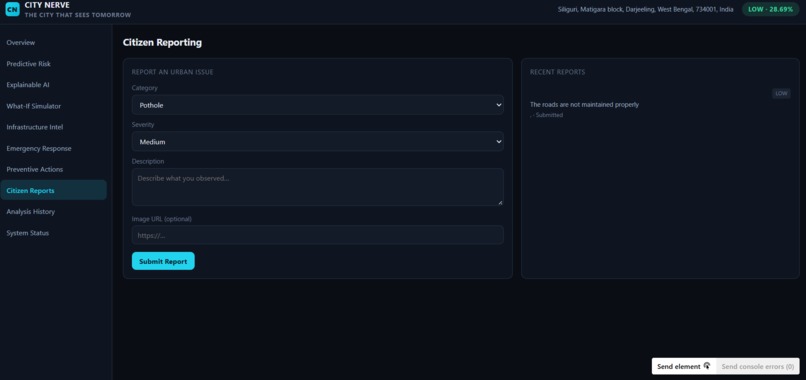
Citizen Reporting
-
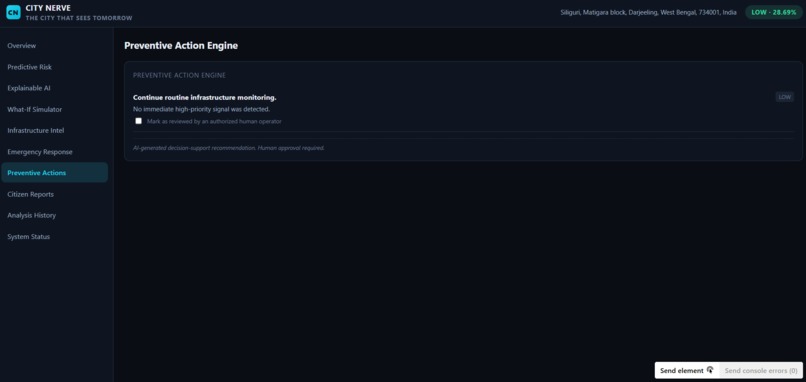
Preventive Action Engine
-
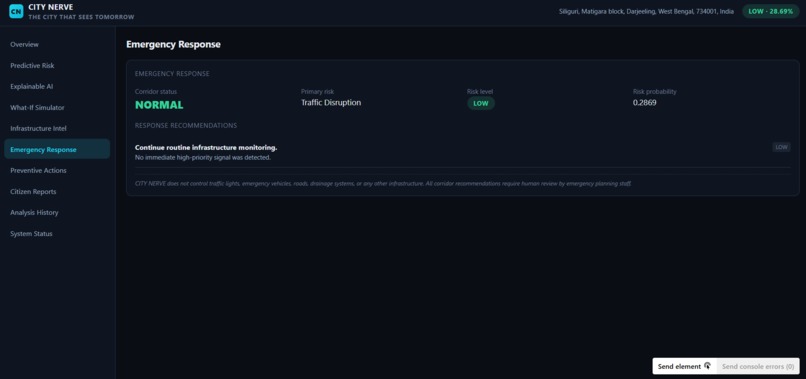
Emergency Response
-
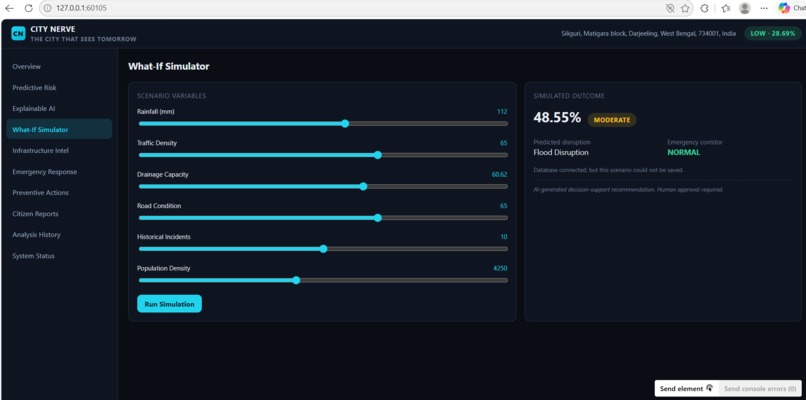
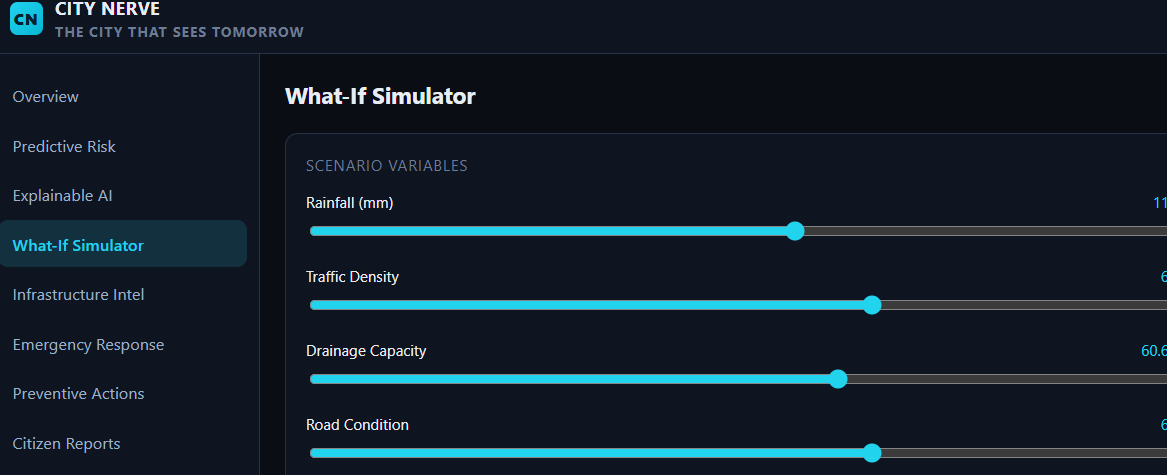
What If Stimulator
-
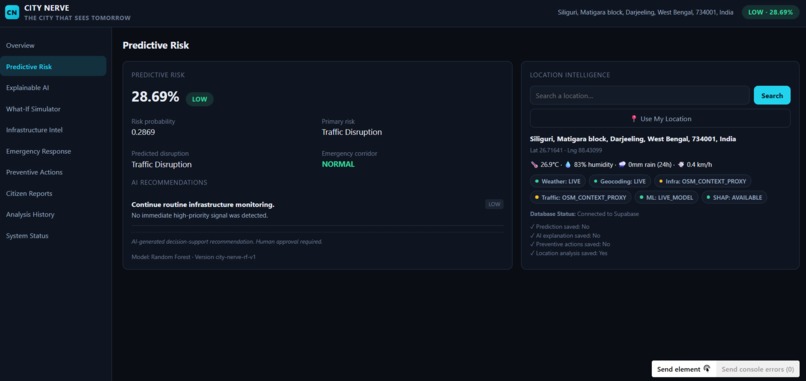
Predictive Risk
-
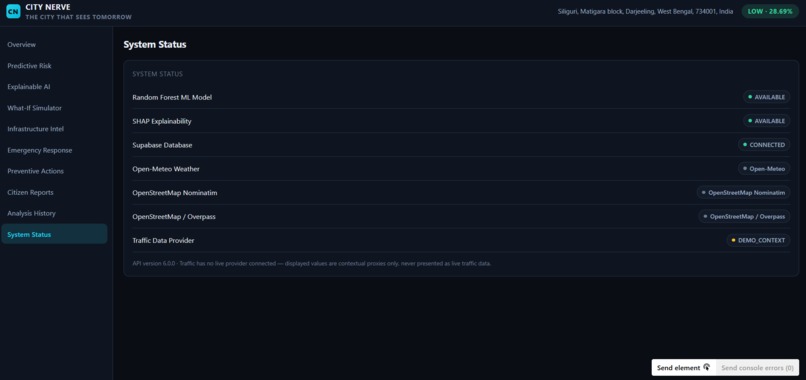
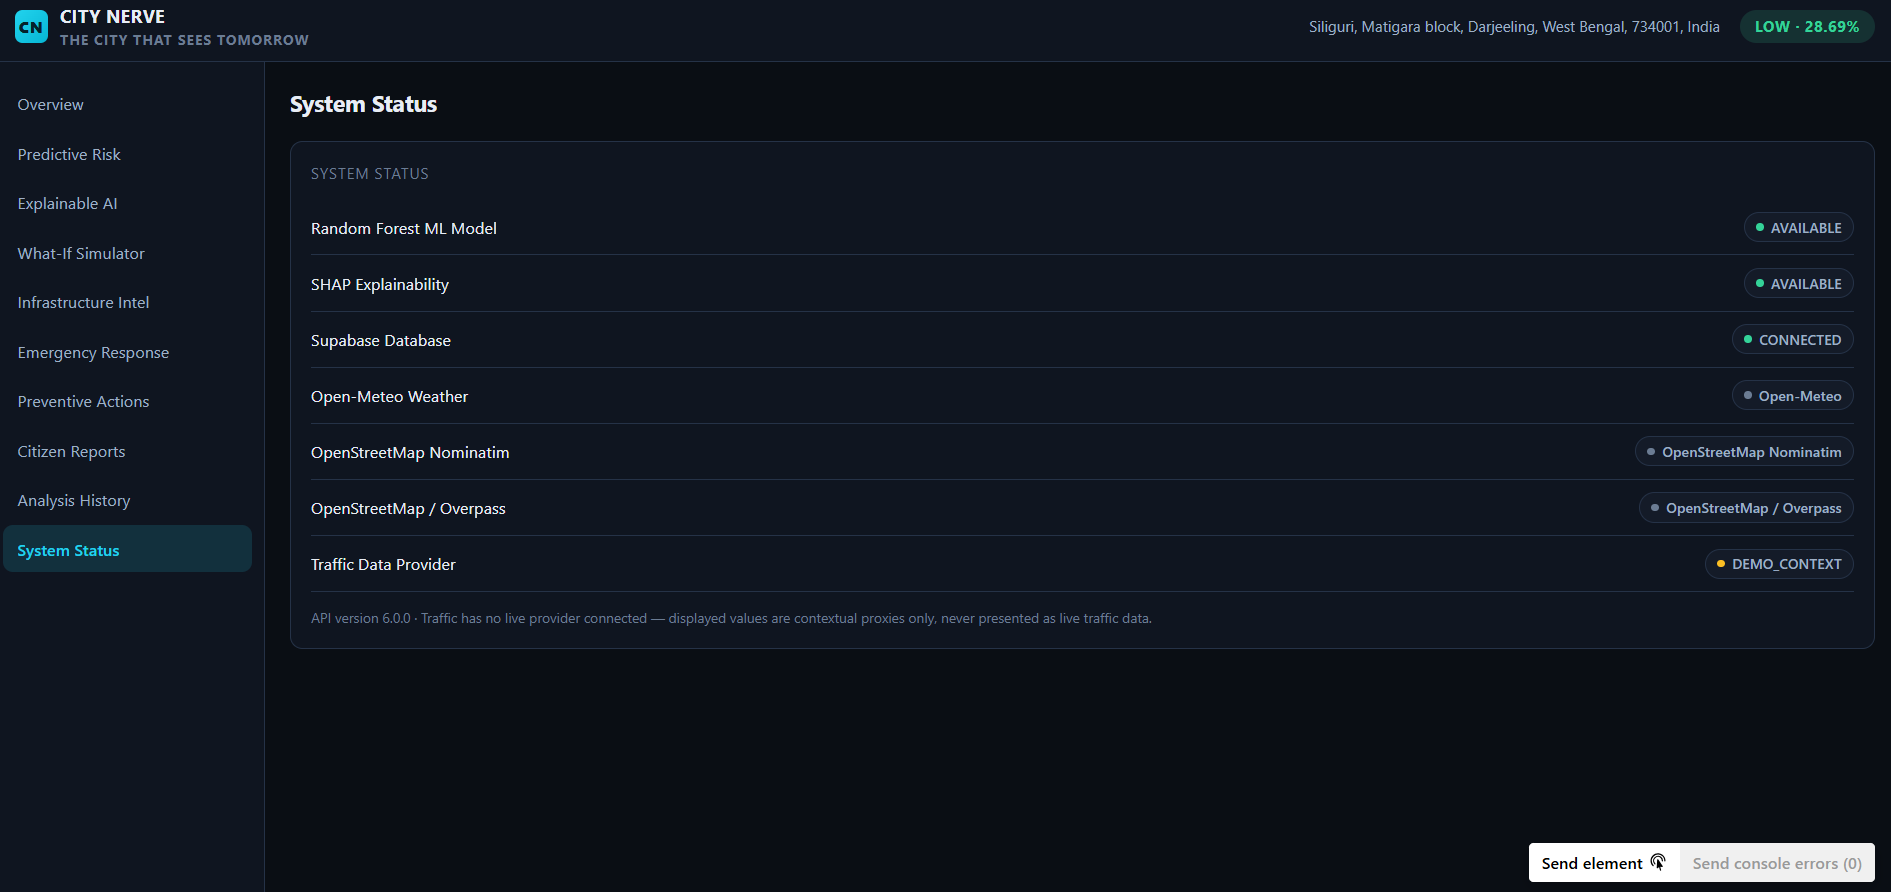
System Status
-
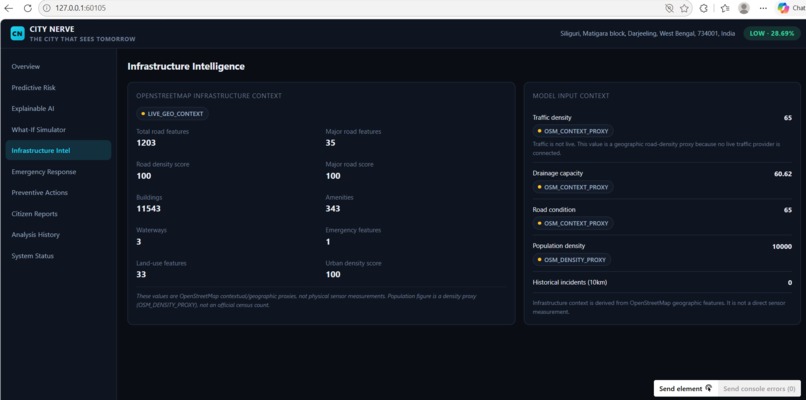
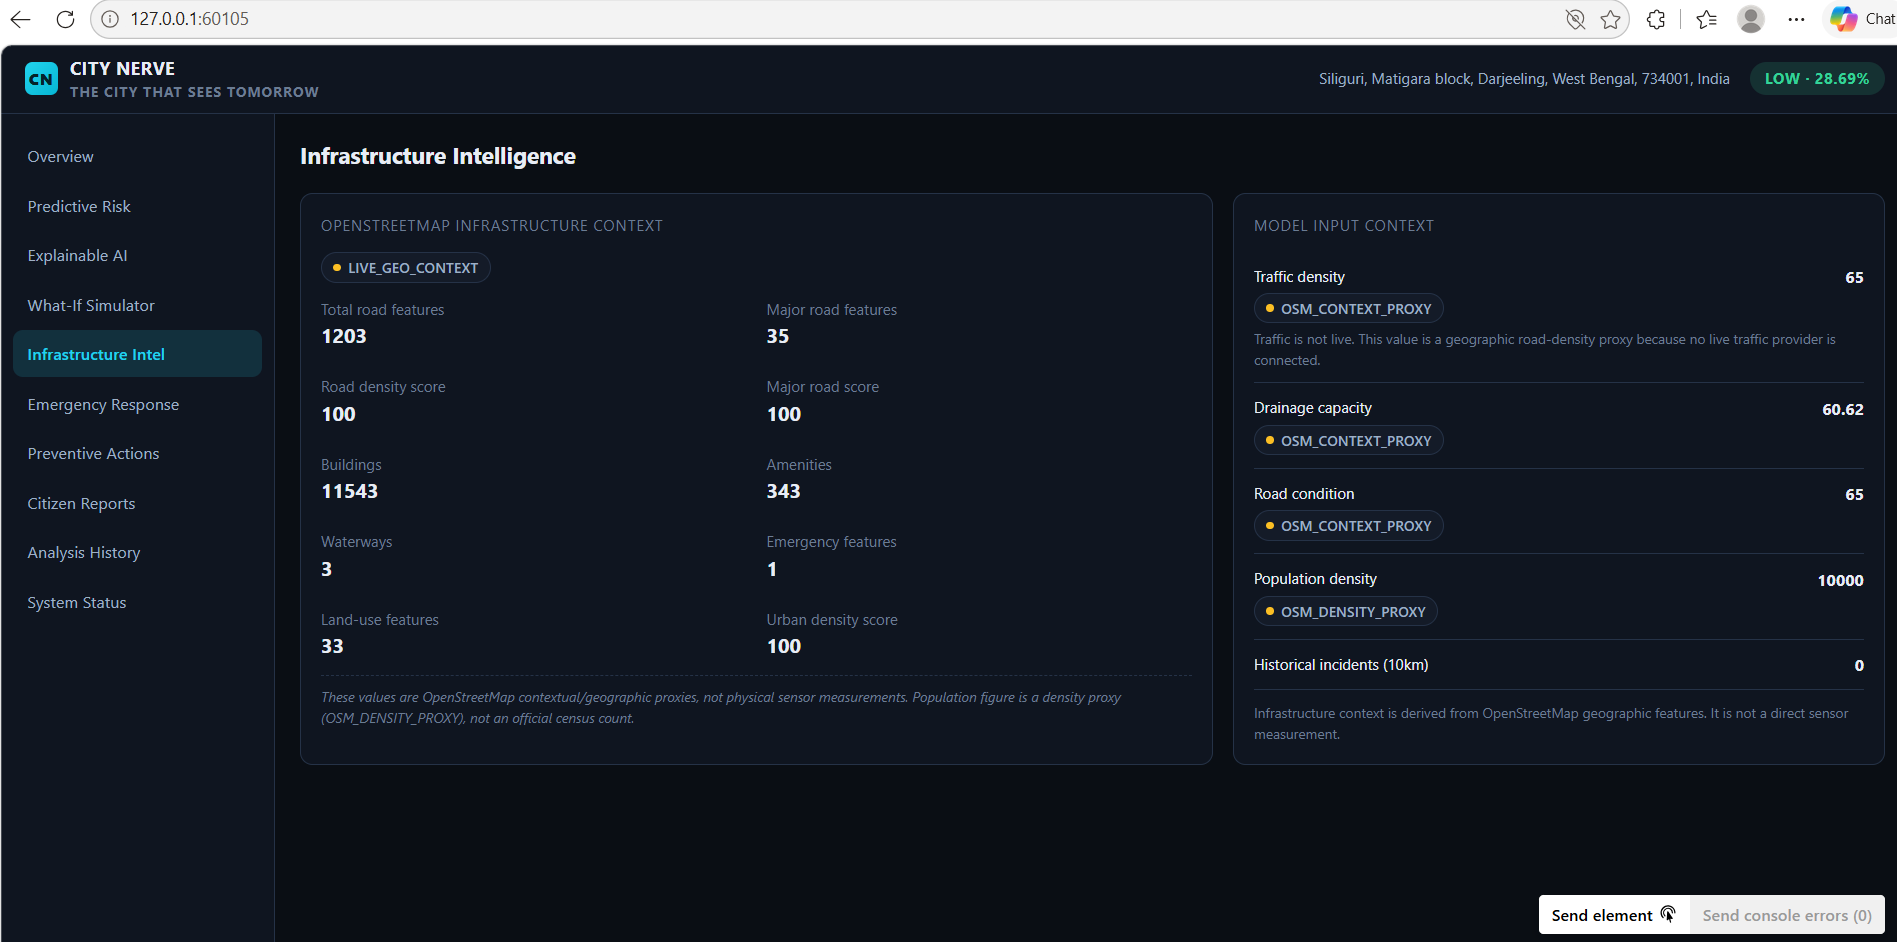
Infrastructure Intel
-
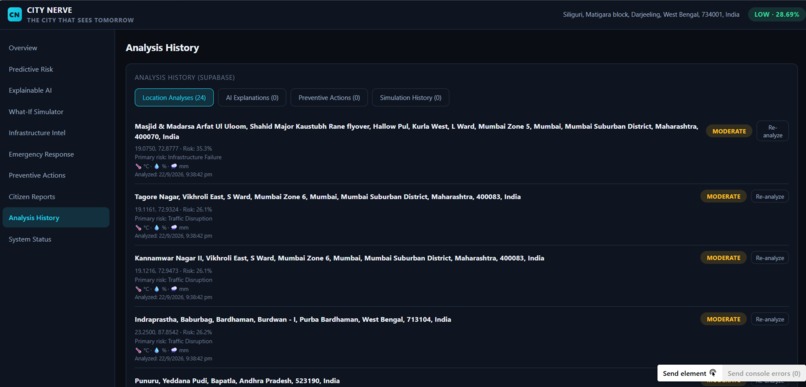
Analysis History
-
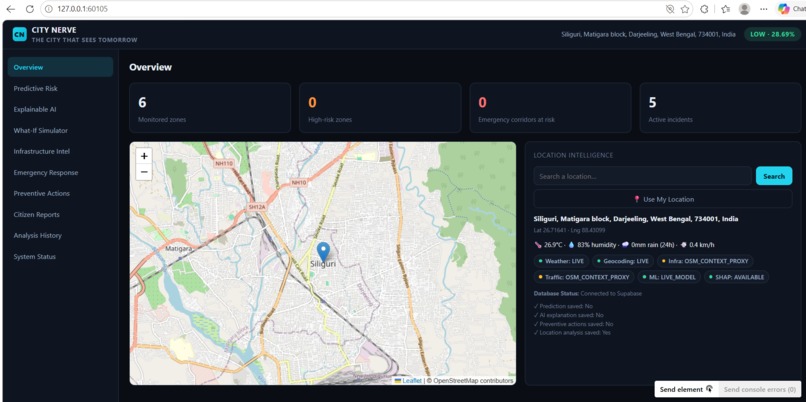
City Nerve Dashboard
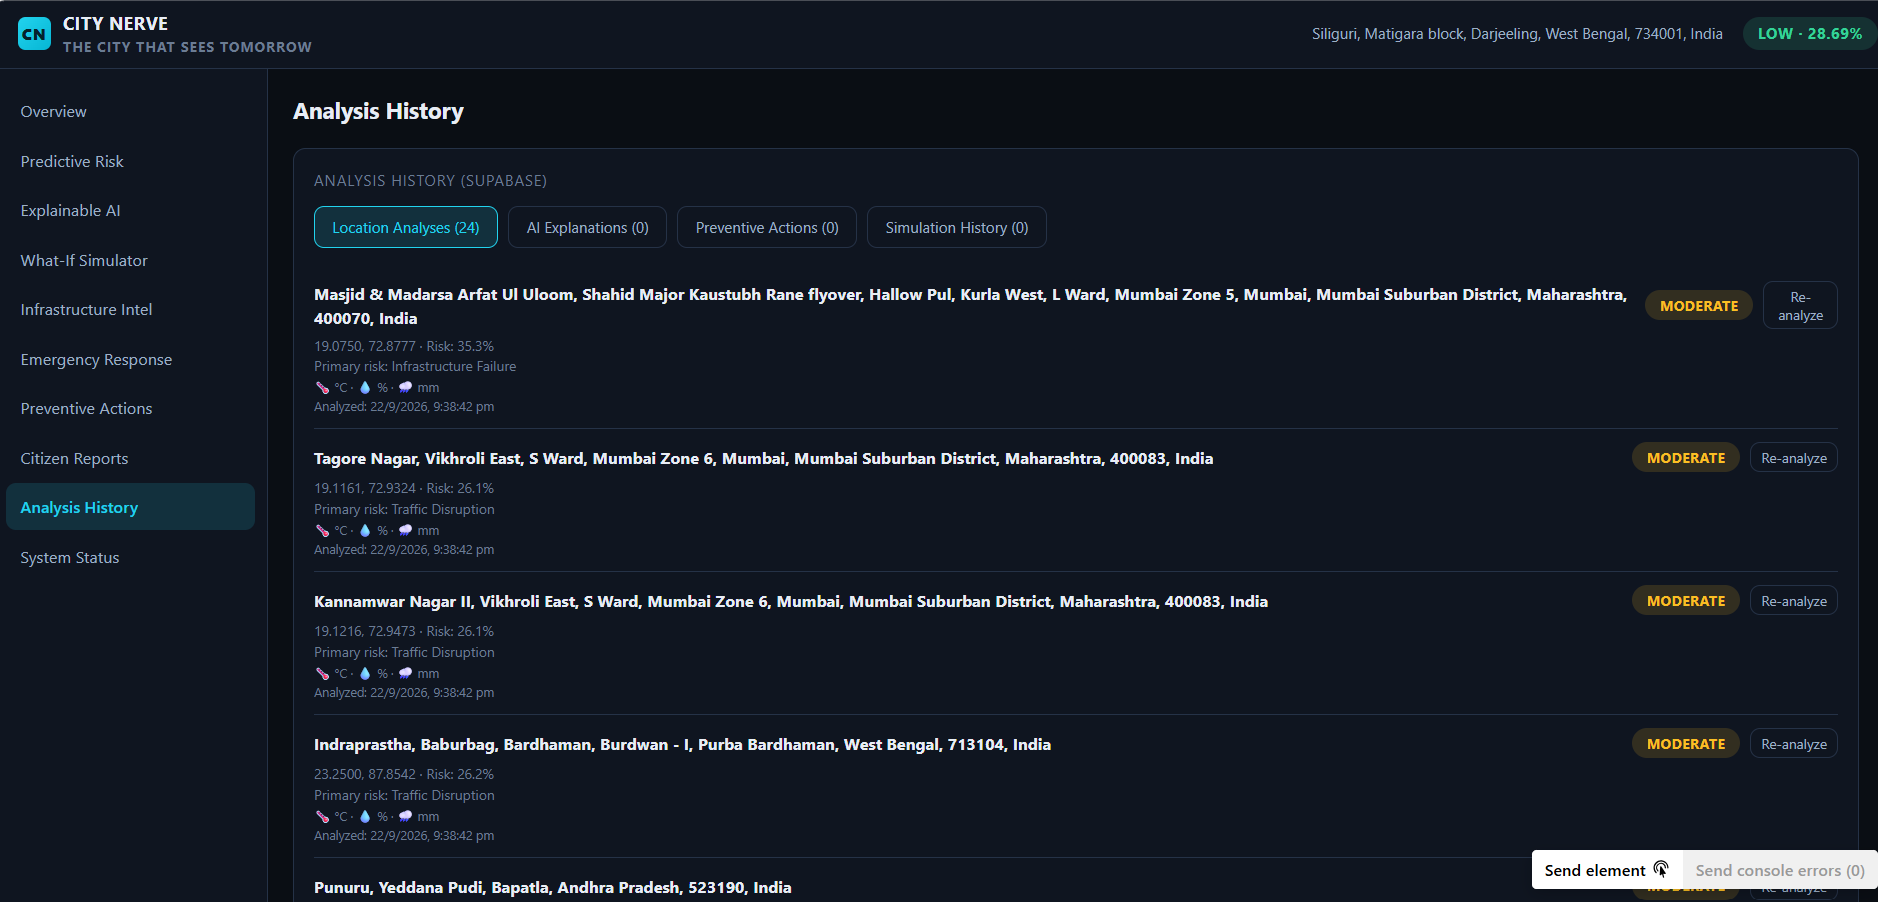
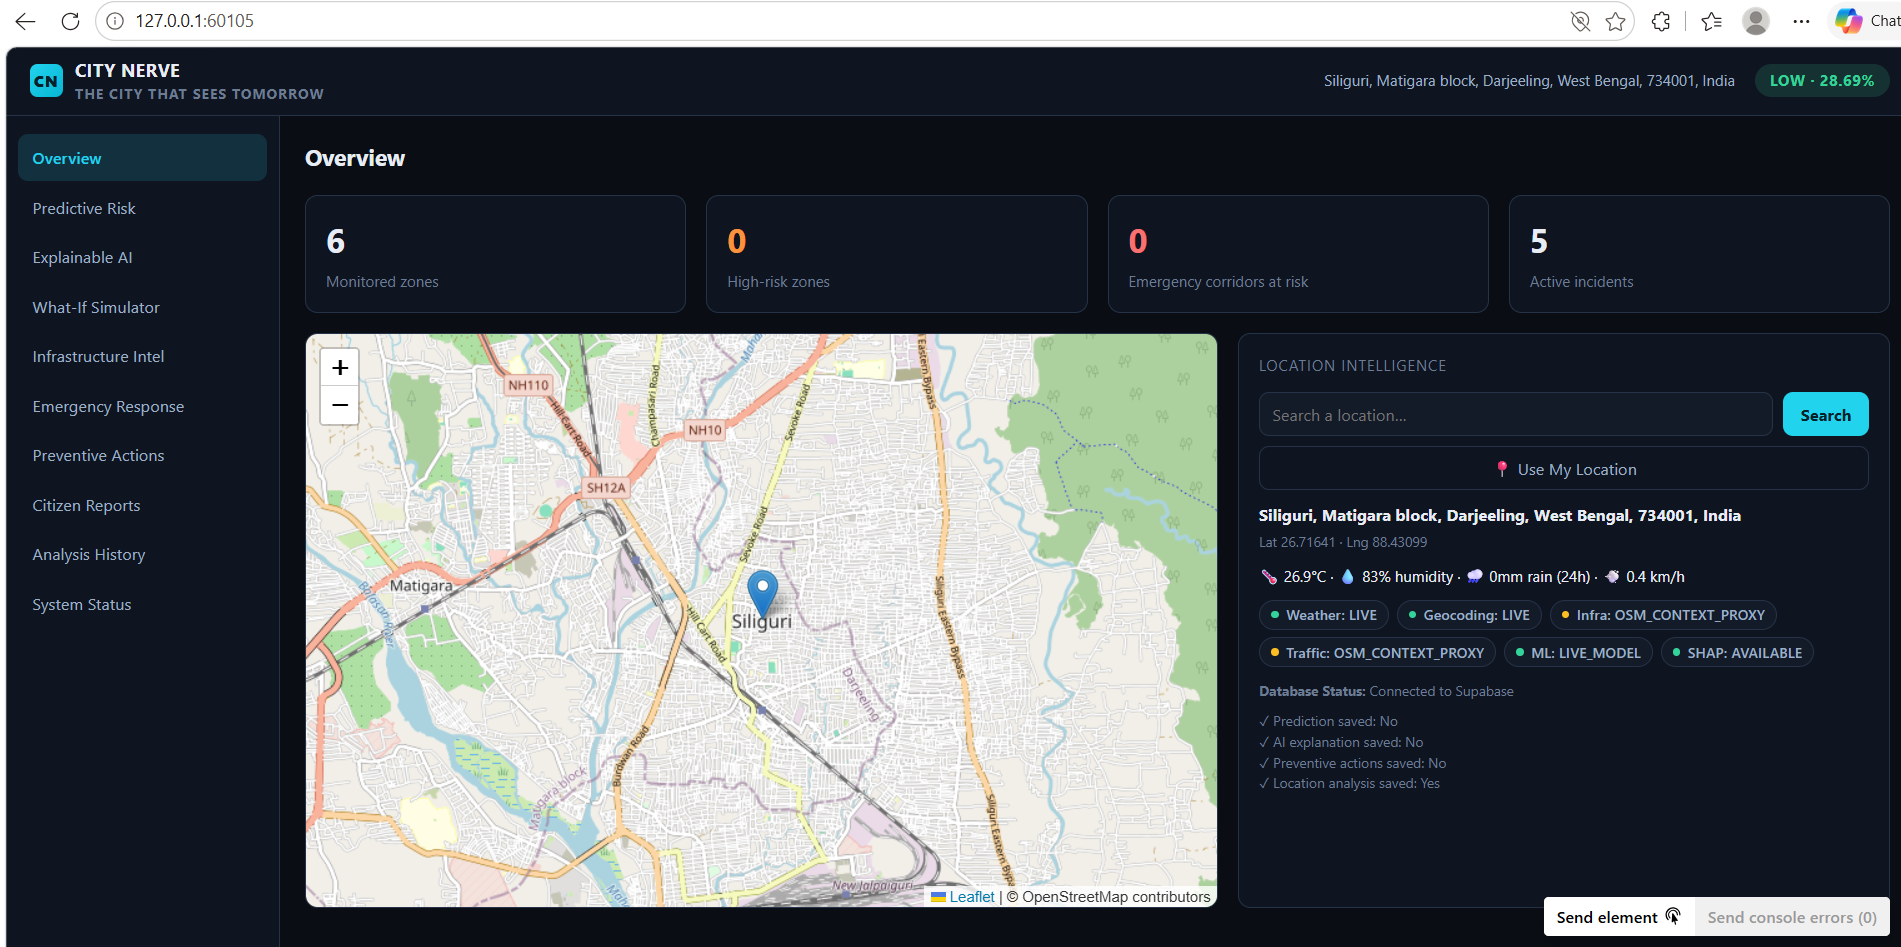
🏙️ City Nerve
Turning city data into predictive urban intelligence
Cities generate enormous amounts of information every day, but raw data alone does not automatically become useful intelligence.
Urban planners, administrators, researchers, and communities need to understand "where risk is concentrated, what factors are contributing to it, and how changing conditions could affect the situation".
That is the problem we wanted to explore with 'City Nerve'.
City Nerve is an AI-powered urban risk intelligence platform that combines "machine learning, geospatial visualization, predictive analytics, and explainable AI" into a single interactive dashboard.
Rather than presenting urban information as static charts or isolated datasets, City Nerve creates a connected workflow:
Data → Risk Prediction → Geographic Insight → Explanation → What-If Analysis
💡 The Idea
The inspiration behind City Nerve came from a simple observation:
A city should not only be able to see its current problems. It should be able to understand emerging risks and investigate what might happen next.
Traditional dashboards are often descriptive. They tell users what has already happened.
City Nerve explores a more proactive approach.
The platform analyzes urban indicators and produces a risk-oriented view of locations across a city. Users can inspect individual locations, visualize risk geographically, examine predictive information, understand important contributing factors, and experiment with hypothetical changes using the 'What-If Simulator'.
This turns a dashboard from a passive reporting tool into an interactive decision-support environment.
🧠 How City Nerve Works
City Nerve is built as a full-stack AI application.
1. Urban Data
The system works with structured urban indicators that can represent factors relevant to city risk.
These inputs are processed and transformed into features that can be consumed by the machine-learning pipeline.
2. Predictive Risk Modeling
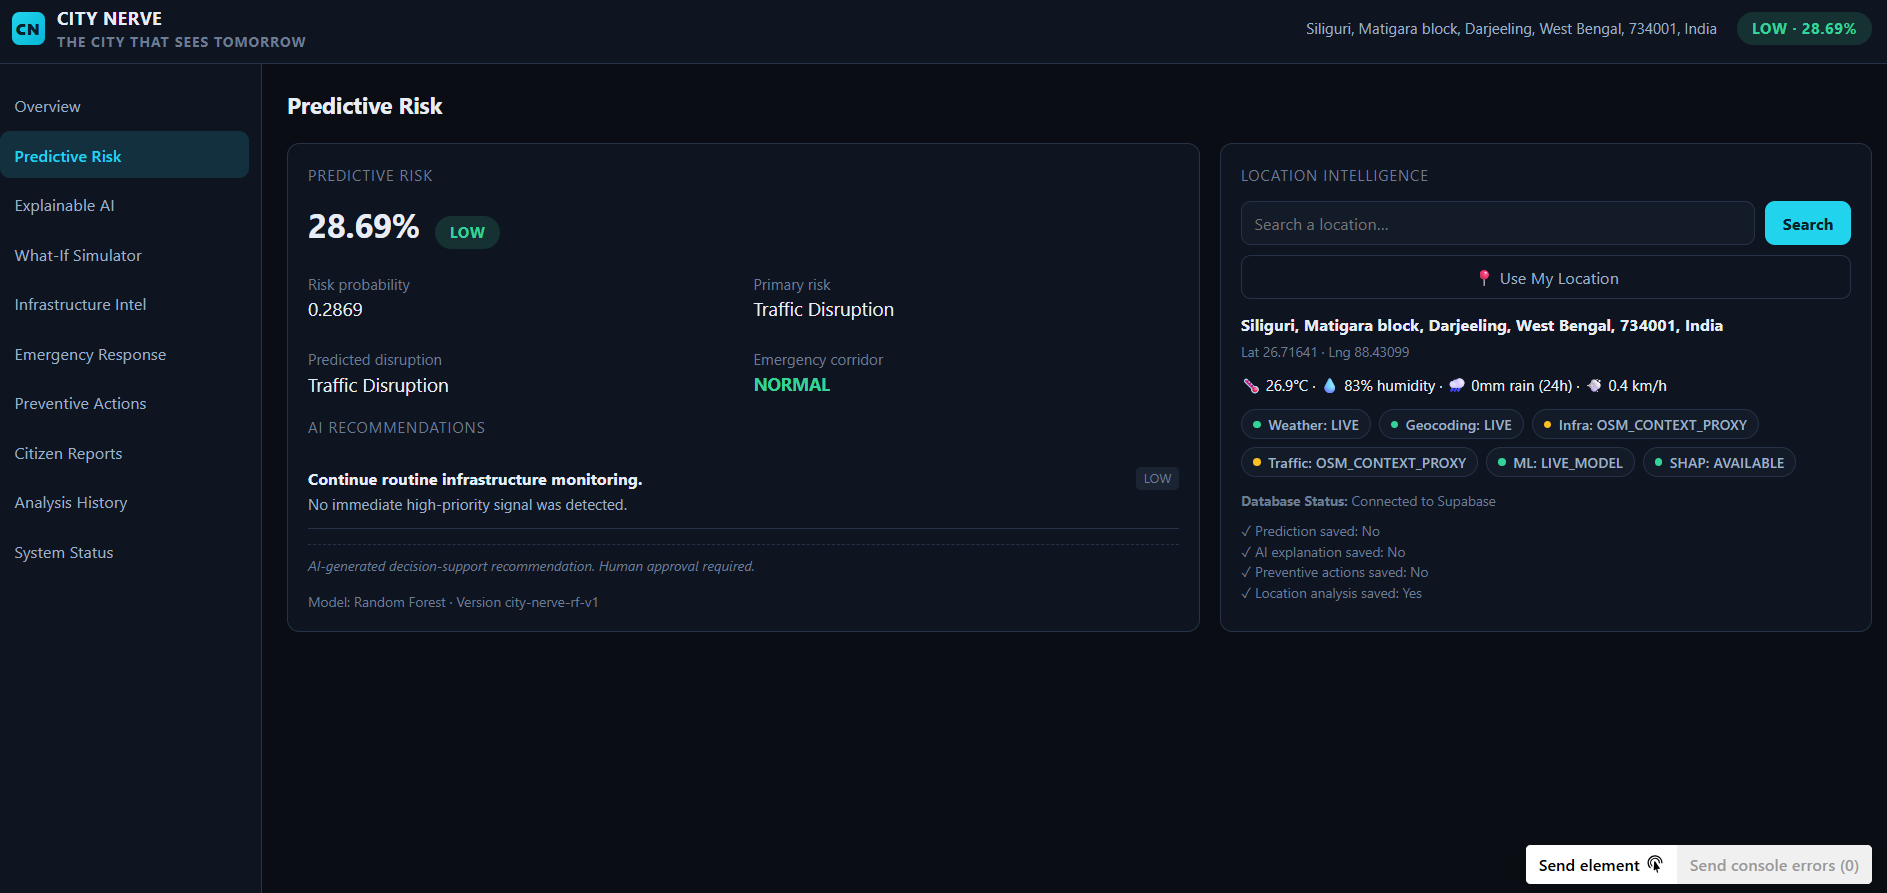
A machine-learning model analyzes the available features and produces risk-related predictions.
Instead of displaying only raw measurements, City Nerve converts those predictions into an understandable urban risk view.
3. Geospatial Risk Visualization
Predicted information is displayed on an interactive map.
Users can explore different locations and quickly identify areas requiring attention.
This geographic layer is important because urban risk is rarely distributed uniformly across a city.
4. Location-Level Intelligence
Selecting a location opens a more detailed view containing relevant metrics and prediction information.
This allows users to move from:
"Where is the risk?"
to:
"What is happening at this location?
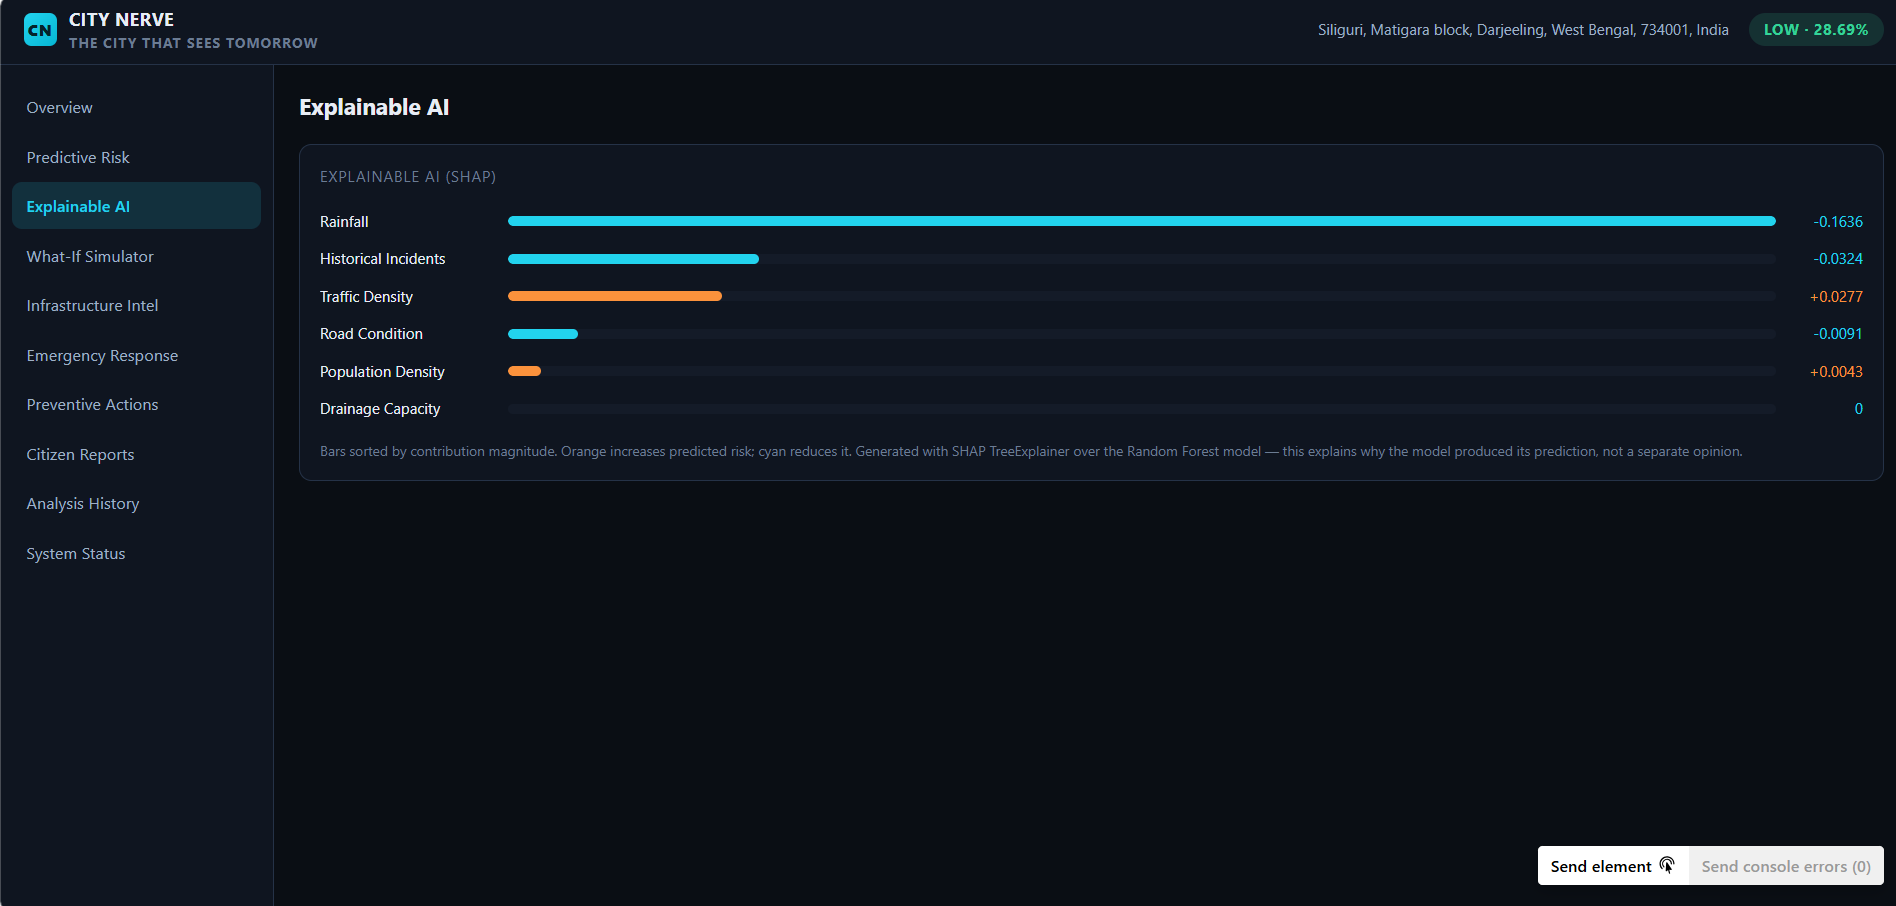
5. Explainable AI
Prediction without explanation can be difficult to trust.
City Nerve therefore includes an explainability layer using SHAP-based analysis to help reveal which features are contributing to model predictions.
This creates a more transparent workflow:
Prediction → Contributing Factors → Human Interpretation
Instead of treating the model as a black box, users can investigate the reasoning behind individual predictions.
6. Predictive Risk View
The predictive risk component gives users a forward-looking perspective rather than limiting the dashboard to historical reporting.
The goal is to help users identify potential risk patterns early enough to investigate them.
7. What-If Simulator
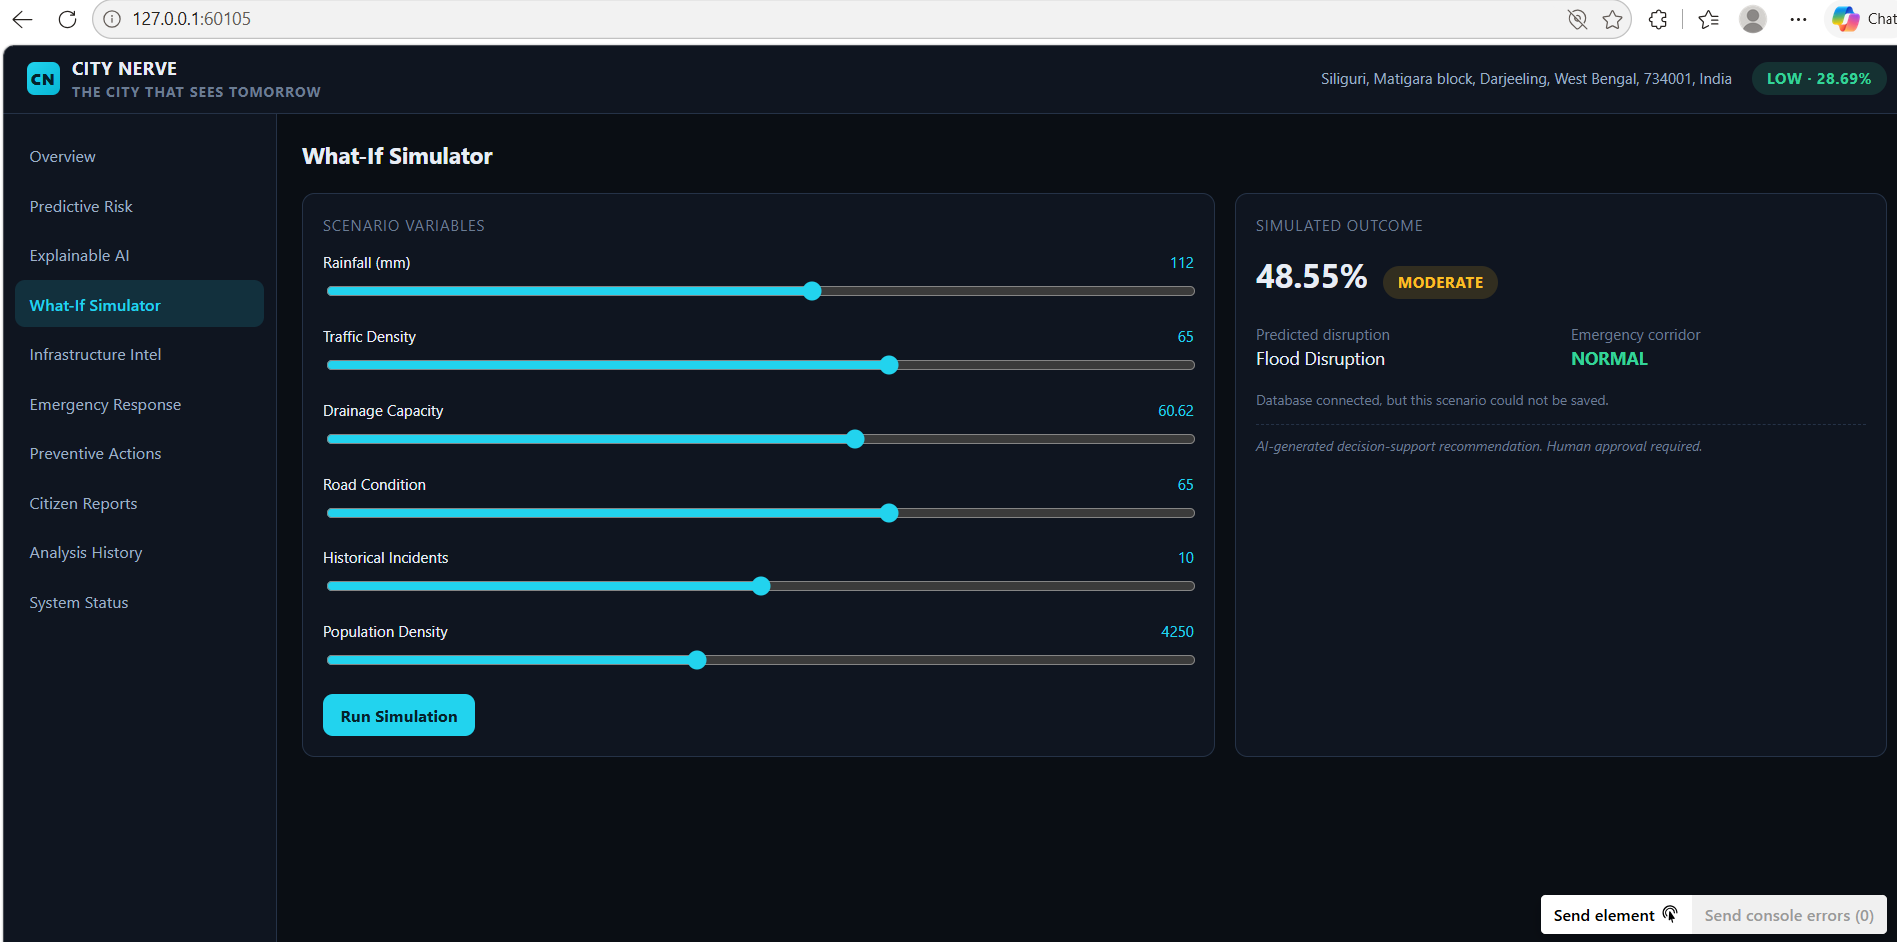
One of the most interactive parts of City Nerve is the 'What-If Simulator'.
Users can modify selected input conditions and observe how the predicted risk responds.
This enables questions such as:
- What happens if a particular risk factor increases?
- What happens if an indicator improves?
- Which factors have the greatest influence on the prediction?
- How sensitive is the predicted risk to changing conditions?
This makes the system exploratory rather than purely observational.
🔍 Explainable Rather Than Black-Box AI
A major design principle of City Nerve is that an AI prediction should not be presented as an unquestionable answer.
The platform therefore combines prediction with explanation.
SHAP-based explainability helps identify the relative contribution of features to individual model outputs.
This allows users to investigate not just:
"What is the predicted risk?"
but also:
"Which factors are influencing this prediction?"
That distinction is particularly important for systems intended to support decisions involving real-world communities.
🎯 Who Could Use City Nerve?
City Nerve is designed as a prototype for several potential users:
- Urban planners
- Municipal administrators
- Smart-city researchers
- Emergency planning teams
- Infrastructure analysts
- Data scientists
- Researchers studying urban risk
- Community and civic organizations
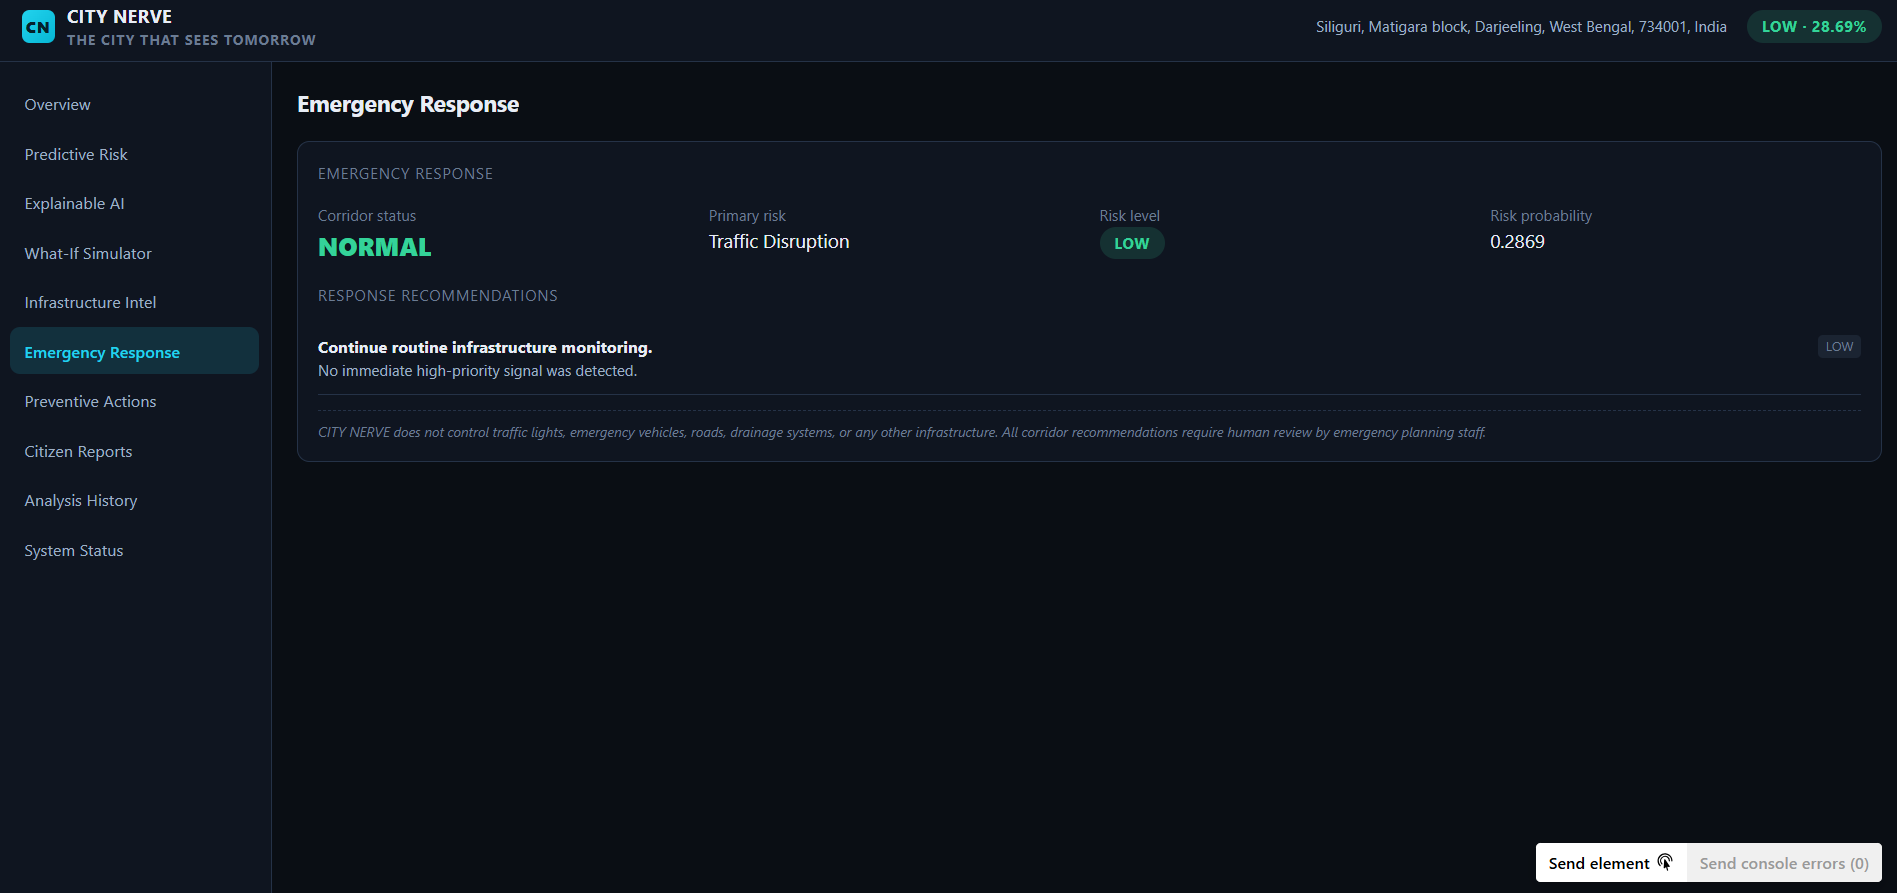
The system is intended as a decision-support and analytical tool, rather than an autonomous authority for real-world emergency decisions.
⚙️ Technical Architecture
City Nerve uses a modern full-stack architecture.
1) Frontend:
- React
- Vite
- Interactive dashboard components
- Interactive geospatial visualization
- Responsive UI
2) Backend:
- Python
- FastAPI
- REST API architecture
3) Machine Learning:
- Python-based ML pipeline
- Predictive risk modeling
- Feature processing
- Model inference
4) Explainable AI:
- SHAP
- TreeExplainer
5) Mapping:
- Leaflet
- React Leaflet
- Interactive geographic visualization
The frontend communicates with the backend API to retrieve predictions, metrics, location information, and explainability results.
🧪 What We Learned
Building City Nerve taught us that an AI model is only one part of an AI product.
A prediction can be technically correct but still be difficult to use.
The challenge was therefore not simply building a model. We had to think about the complete journey:
How does a user discover a risk?
How do they understand it?
How do they investigate the underlying factors?
How can they experiment with possible changes?
This led us to combine machine learning with visualization and explainability rather than treating them as separate components.
We also learned that communicating uncertainty and model limitations is just as important as displaying predictions.
🚧 Challenges
One of the biggest challenges was connecting different technical layers into a single usable system.
The project required coordinating:
- Data processing
- Machine-learning inference
- Backend APIs
- Explainability
- Geospatial visualization
- Frontend state management
- Interactive simulation
Another challenge was making technical ML outputs understandable to someone who may not be a machine-learning specialist.
This influenced the design of the dashboard and encouraged us to prioritize visual explanations and location-based exploration.
🌍 Why It Matters
Urban problems are interconnected.
A change in one factor can influence other parts of a city, and risks can vary significantly between locations.
City Nerve explores how AI can help transform complex urban data into an interface that is easier to investigate and reason about.
The long-term vision is to evolve City Nerve toward a broader urban intelligence layer capable of integrating more real-world datasets, temporal information, live feeds, and additional predictive models.
The prototype is not intended to replace human decision-makers.
Instead, its goal is to give them better information, clearer explanations, and a way to explore possible scenarios before making decisions.
🚀 Future Roadmap
Future versions of City Nerve could include:
- Real-time city data integration
- Additional urban datasets
- Temporal forecasting
- Anomaly detection
- More granular neighborhood-level analysis
- Multi-risk modeling
- Automated alerts
- Historical trend analysis
- Scenario comparison
- Additional explainability techniques
- Mobile accessibility
- Integration with public infrastructure and IoT data
The larger vision is a system where a city can continuously sense, analyze, explain, and visualize emerging patterns.
That is the idea behind City Nerve: giving cities a "nerve system" for understanding their changing environment.
Built With
- analytics
- api
- css
- data
- explainable
- fastapi
- fastapimachine
- geospatial
- interactive
- javascript
- leaflet.js
- learning
- lucide
- maps
- predictive
- python
- react
- responsive
- rest
- scikit-learn
- shap
- treeexplainer
- vite

Log in or sign up for Devpost to join the conversation.