Inspiration
Lahore spends most of the winter in the world's top ten most polluted cities, and yet there is no live public monitoring network for it. The one station most global aggregators list for the city last reported in February 2025. Residents plan school runs, commutes and outdoor exercise on numbers that are either stale, on the wrong scale, or contradict each other from one app to the next.
We wanted a dashboard that a Lahori family could actually plan a day around: one honest number, where it came from, how old it is, where it is heading, and what to do about it. City Intelligence is that dashboard.
What it does
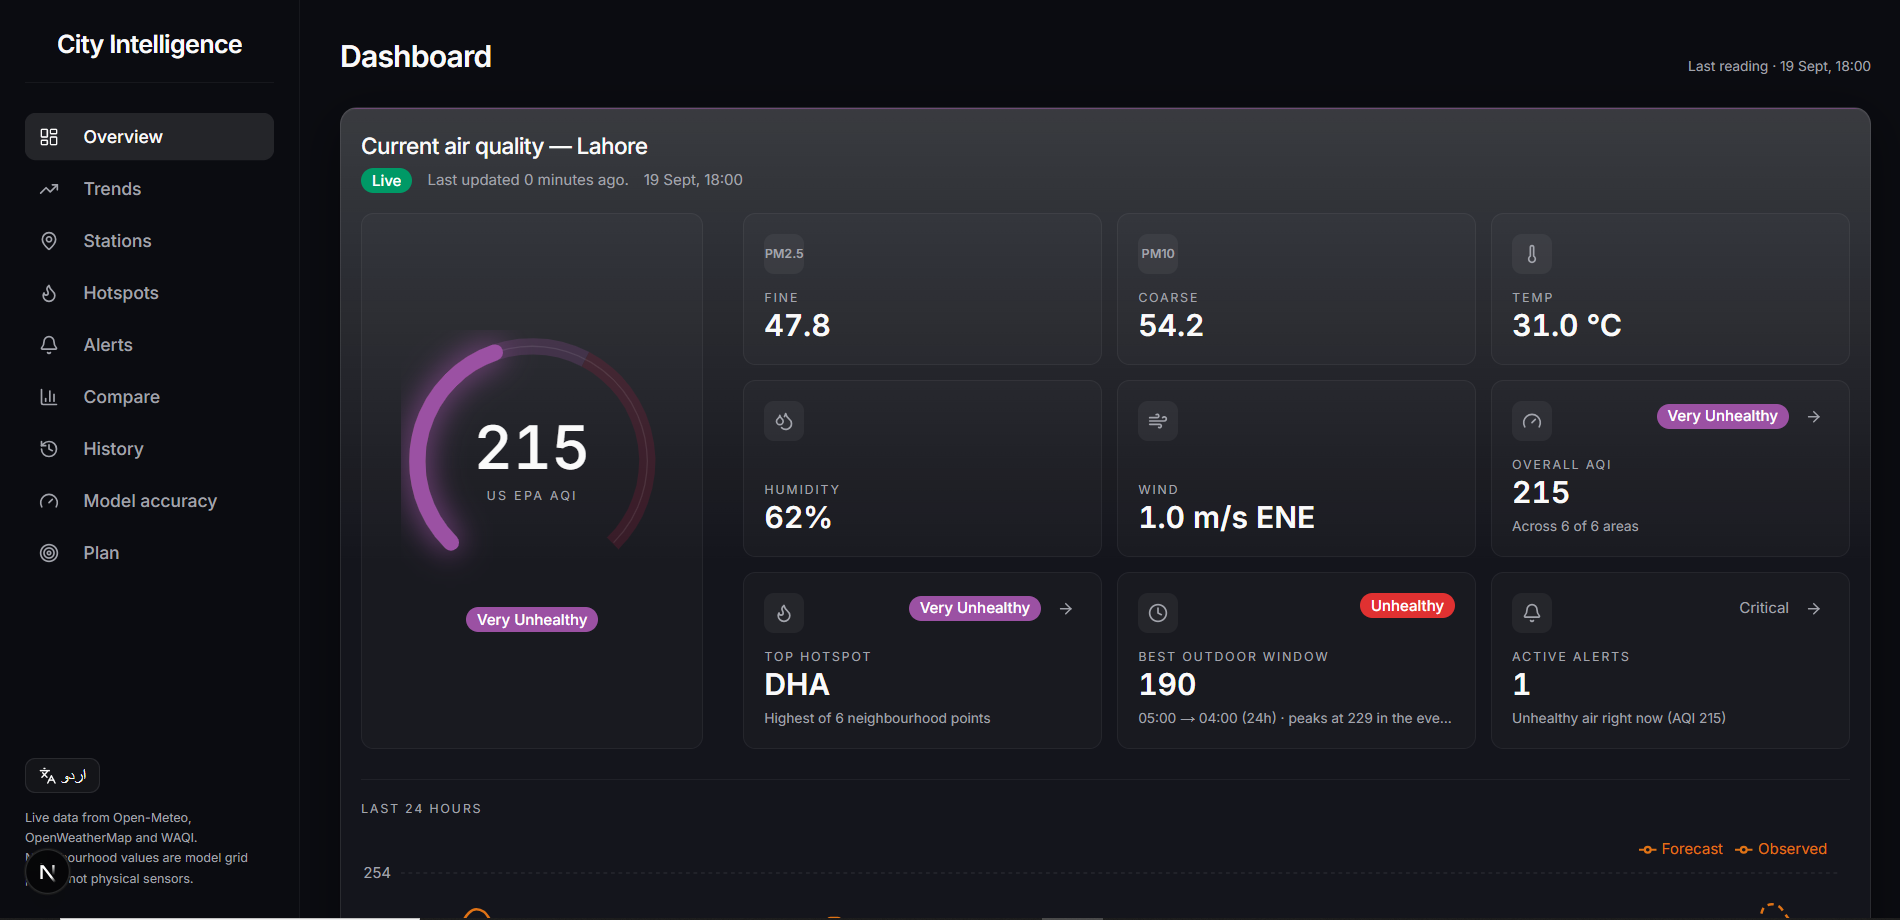
City Intelligence is a live air-quality intelligence dashboard for Lahore, in English and Urdu.
- Current conditions. Headline US AQI on the 0 to 500 scale, pollutant concentrations, weather, the provider that supplied the number and how many hours old it is. Nothing stale is ever presented as live.
- Six neighbourhoods. Six real districts on a map, ranked by AQI, with hotspots flagged when an area runs well above the city mean.
- History. Stored hourly readings merged with an open archive, so charts work on day one and every point says whether it was recorded by us or backfilled.
- A 6 to 24 hour forecast with an explainability card that names the model inputs and never claims causation.
- Forecast accuracy. A hindcast panel that reports mean absolute error and how often the prediction landed in the right EPA category, so the forecast comes with its own report card.
- Practical guidance. Threshold alerts, the least-bad window to be outside, activity and exercise recommendations, and a weather-versus-pollution correlation view.
- Planning scenarios. A what-if panel where a planner sets traffic, industrial and other controls at 0 to 100 percent and sees the estimated PM2.5 and AQI change, with diminishing returns as measures stack.
How we built it
Backend. A FastAPI service in Python with six read-only endpoints. Live AQI and concentrations come from Open-Meteo's air-quality model, weather from OpenWeatherMap with an Open-Meteo fallback, and WAQI is kept for station attribution. Every call to the current endpoint writes a snapshot to DynamoDB, and that store is what feeds history, forecast and accuracy. An in-process TTL cache with a per-key lock stops a cold cache from fanning out six upstream calls at once, and a small hand-rolled rate limiter protects the free upstream tiers.
The forecast is a scikit-learn pipeline of a standard scaler and Ridge regression, refit on every request from the stored history. The predicted value is a weighted sum of an intercept, a linear time trend, the hour of day encoded cyclically (as a sine/cosine pair, so 23:00 sits next to 00:00), wind speed and humidity.
Future wind and humidity are pulled from Open-Meteo's hourly weather forecast, so the model projects onto predicted weather rather than a flat line. It refuses to forecast on fewer than 12 readings instead of drawing a fabricated curve.
Accuracy is measured by walk-forward hindcast: hold out the last 24 hours, refit on everything before, predict forward, score against what actually happened. We deliberately carry weather forward rather than reading it from the held-out rows, because feeding real future weather to the model would hand it perfect foresight.
Frontend. Next.js 16 with the App Router and React Compiler, TypeScript in strict mode, Tailwind v4, shadcn/ui, Recharts, Leaflet and TanStack Query. All AQI domain logic lives in pure modules with no framework imports, covered by Vitest. The backend serialises camelCase through a Pydantic alias generator, so a single TypeScript types file mirrors the Python schemas field for field and there is no mapping layer.
Challenges we ran into
There is no ground truth. We spent five days switching the headline source back and forth. WAQI read around 212 for Lahore, Open-Meteo read around 99, and the official Punjab EPA figure was 150. Every source failed the comparison, so every choice got reversed. The lesson was that no provider matches the official number, and chasing one is a dead end.
Two AQI definitions inside one app. At one point the gauge showed 212 while the "Overall AQI" card directly beneath it showed 99. The cause was not two providers. The city headline was the provider's full EPA index, which folds in ozone, NO₂, SO₂ and CO, while the neighbourhood summary rebuilt the index from mean PM2.5 and PM10 alone. On one live reading the full index was 207 and the particulate-only index was 166. Those 41 points were gases. We rewrote the summary to average the same index over the same pollutants as the headline, and added a rule to the codebase: never show two differently scoped numbers as one figure.
Three scales that look alike. OpenWeatherMap reports a 1 to 5 index, WAQI a 0 to 500 index, and neither is comparable to the other. We keep them in separately named fields and convert concentrations to US AQI ourselves using the EPA piecewise-linear breakpoints, linearly interpolating a concentration between the two nearest breakpoints onto the corresponding AQI range.
The data is coarser than the city. Open-Meteo's global grid is roughly 40 km and Lahore spans about 30 km, so all six neighbourhoods can land in one cell and read identically. We label every area as a model grid point, never a station, and say so in the UI.
Accomplishments that we're proud of
- A forecast that ships with its own out-of-sample accuracy report, not just an in-sample R² that flatters the model.
- Every number on the page carries its source, its age and its basis. Stale readings are flagged and never stored, so a dead station cannot poison the training window.
- The dashboard degrades instead of failing: history and forecast work on a fresh deploy with no AWS account, and the forecast falls back to persisted weather when the weather forecast is unavailable and says which happened.
- Full Urdu localisation with a fixed timezone so server and client renders match.
- A written architecture document and a "Known limitations" section that records what is a property of the data rather than a bug.
What we learned
- Honesty is a feature. Most of our best decisions were about what not to claim: no fabricated forecast below 12 samples, no dominant pollutant when we cannot know it, no "real-time" when the providers publish hourly.
- Consistency beats accuracy. Users can live with a number that is 30 points off the official figure. They cannot live with two numbers on one screen that disagree.
- In-sample fit is not skill. Measuring a forecast properly means hiding the future from the model, including the weather.
- Small, interpretable models with good features beat heavier ones when you have a week of hourly data.
What's next for City Intelligence
- Calibration against the official reading. A rolling 24-hour average and an offset fitted against the Punjab EPA figure, applied on top of the existing source rather than by switching sources again.
- Persist live forecasts so accuracy can be verified against what actually happened, not only by hindcast.
- More cities. The backend is keyed by city slug and the EPA breakpoints live in one file, so a second city is configuration and coordinates.
- Push alerts when a threshold crossing is forecast in the next few hours.
- Low-cost sensors. Partner with community PM2.5 sensors to replace the 40 km grid with real neighbourhood readings.
Built With
- amazon-dynamodb
- amazon-ec2
- axios
- boto3
- fastapi
- framer-motion
- leaflet.js
- nextjs
- numpy
- open-meteo-forecast
- open-weather-map
- pandas
- prediction
- pydantic
- python
- recharts
- scikit-learn
- tailwind
- tanstack-query
- testing
- typescript
- vitest
- waqi

Log in or sign up for Devpost to join the conversation.