-
-
City Health Observatory
About City Health Observatory
Inspiration
Smart cities rely on interconnected systems—traffic, air quality, power, water, and noise. But there’s no simple way to understand overall city health or how failures spread across regions.
We built this for Luddy Hackathon Case 2 to solve that gap: a real-time Smart City Health Leaderboard that continuously scores districts and visualizes cascading failures.
Urban Health Score (UHS)
Each district's health is computed using weighted sensor signals:
$$ UHS = \sum_{i} w_{i} s_{i} $$
To reduce noise, we apply temporal smoothing:
$$ UHS_{new} = (1 - \alpha) \cdot UHS_{window} + \alpha \cdot UHS_{prev} $$
What it does
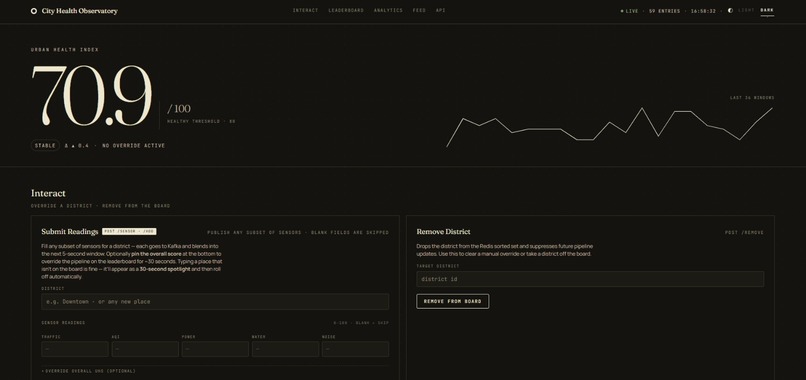
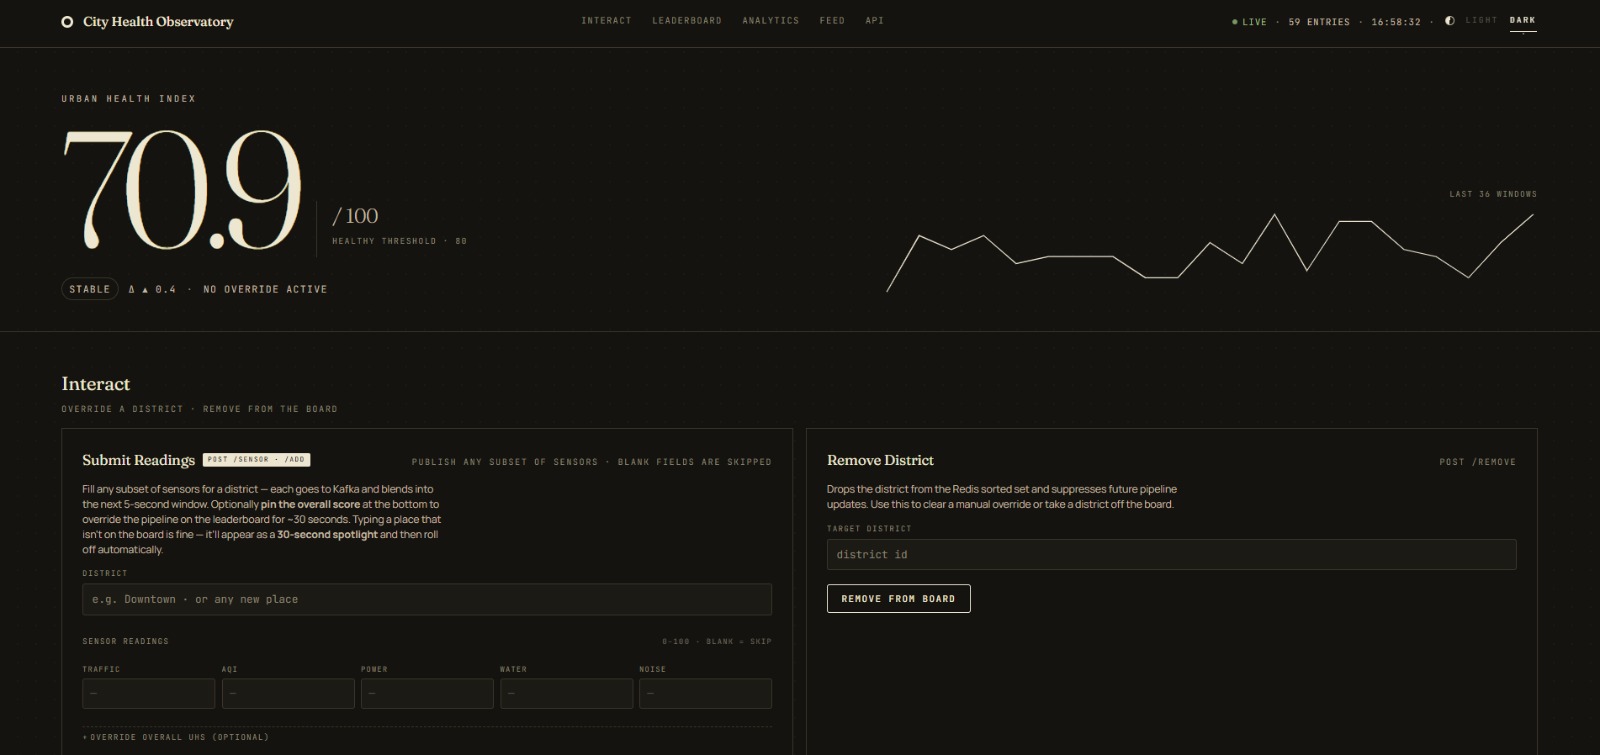
A real-time leaderboard that scores and ranks city health every few seconds.
- Streams sensor-like data and computes a 0–100 health score
- Displays a live ranked leaderboard
- Detects cascading failures across neighboring districts
- Applies geographic ripple penalties over time
Key idea: A failure in one district doesn’t stay isolated—it spreads.
The system supports:
- Local mode: SQLite, no broker
- Streaming mode: Redpanda + Flink / Python worker + Redis + PostgreSQL
How we built it
- Backend: Python 3.12, FastAPI, Pydantic
- Streaming: Redpanda (Kafka-compatible), PyFlink or Python worker
- Storage: Redis (real-time), PostgreSQL / SQLite (history)
- Frontend: HTML/CSS/JS dashboard
- Infra: Docker + Compose (modular profiles)
Challenges we ran into
- Flink setup issues: PyFlink + JVM caused inconsistent builds across machines
- System coordination: Syncing broker → processor → Redis → API required careful orchestration
- Dual-mode complexity: Maintaining both local and streaming modes without breaking the UI
- Data realism: Ensuring synthetic data still tells a believable story
Accomplishments we’re proud of
- End-to-end system: from ingestion → processing → visualization
- Cascading failure modeling based on real geographic adjacency
- Flexible architecture: works with or without full streaming stack
- Built-in observability: latency + pipeline metrics exposed via API
What we learned
- Stable APIs let you swap entire backends without breaking the UI
- Observability must include both API latency and pipeline lag
- Making parameters configurable (YAML) turns assumptions into experiments
What’s next
- Integrate real-world data sources
- Add map-based visualization of district health
- Implement alerts for critical failures
- Improve load testing and CI pipelines
Built by Krisha, Prajwal, Suraj, and Monesh Luddy Hackathon – Smart City Infrastructure Health Leaderboard
Built With
- kafka
- redis


Log in or sign up for Devpost to join the conversation.