-
-
Dashboard
-
Analytics
-
Simulation
-

Reports
-
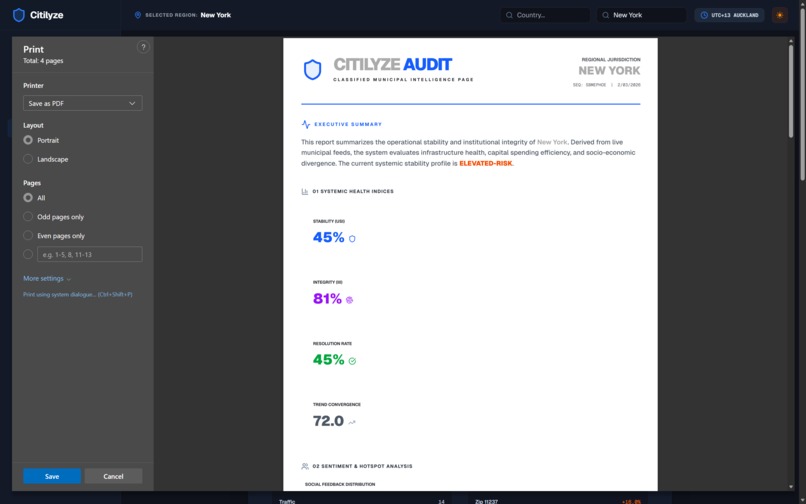
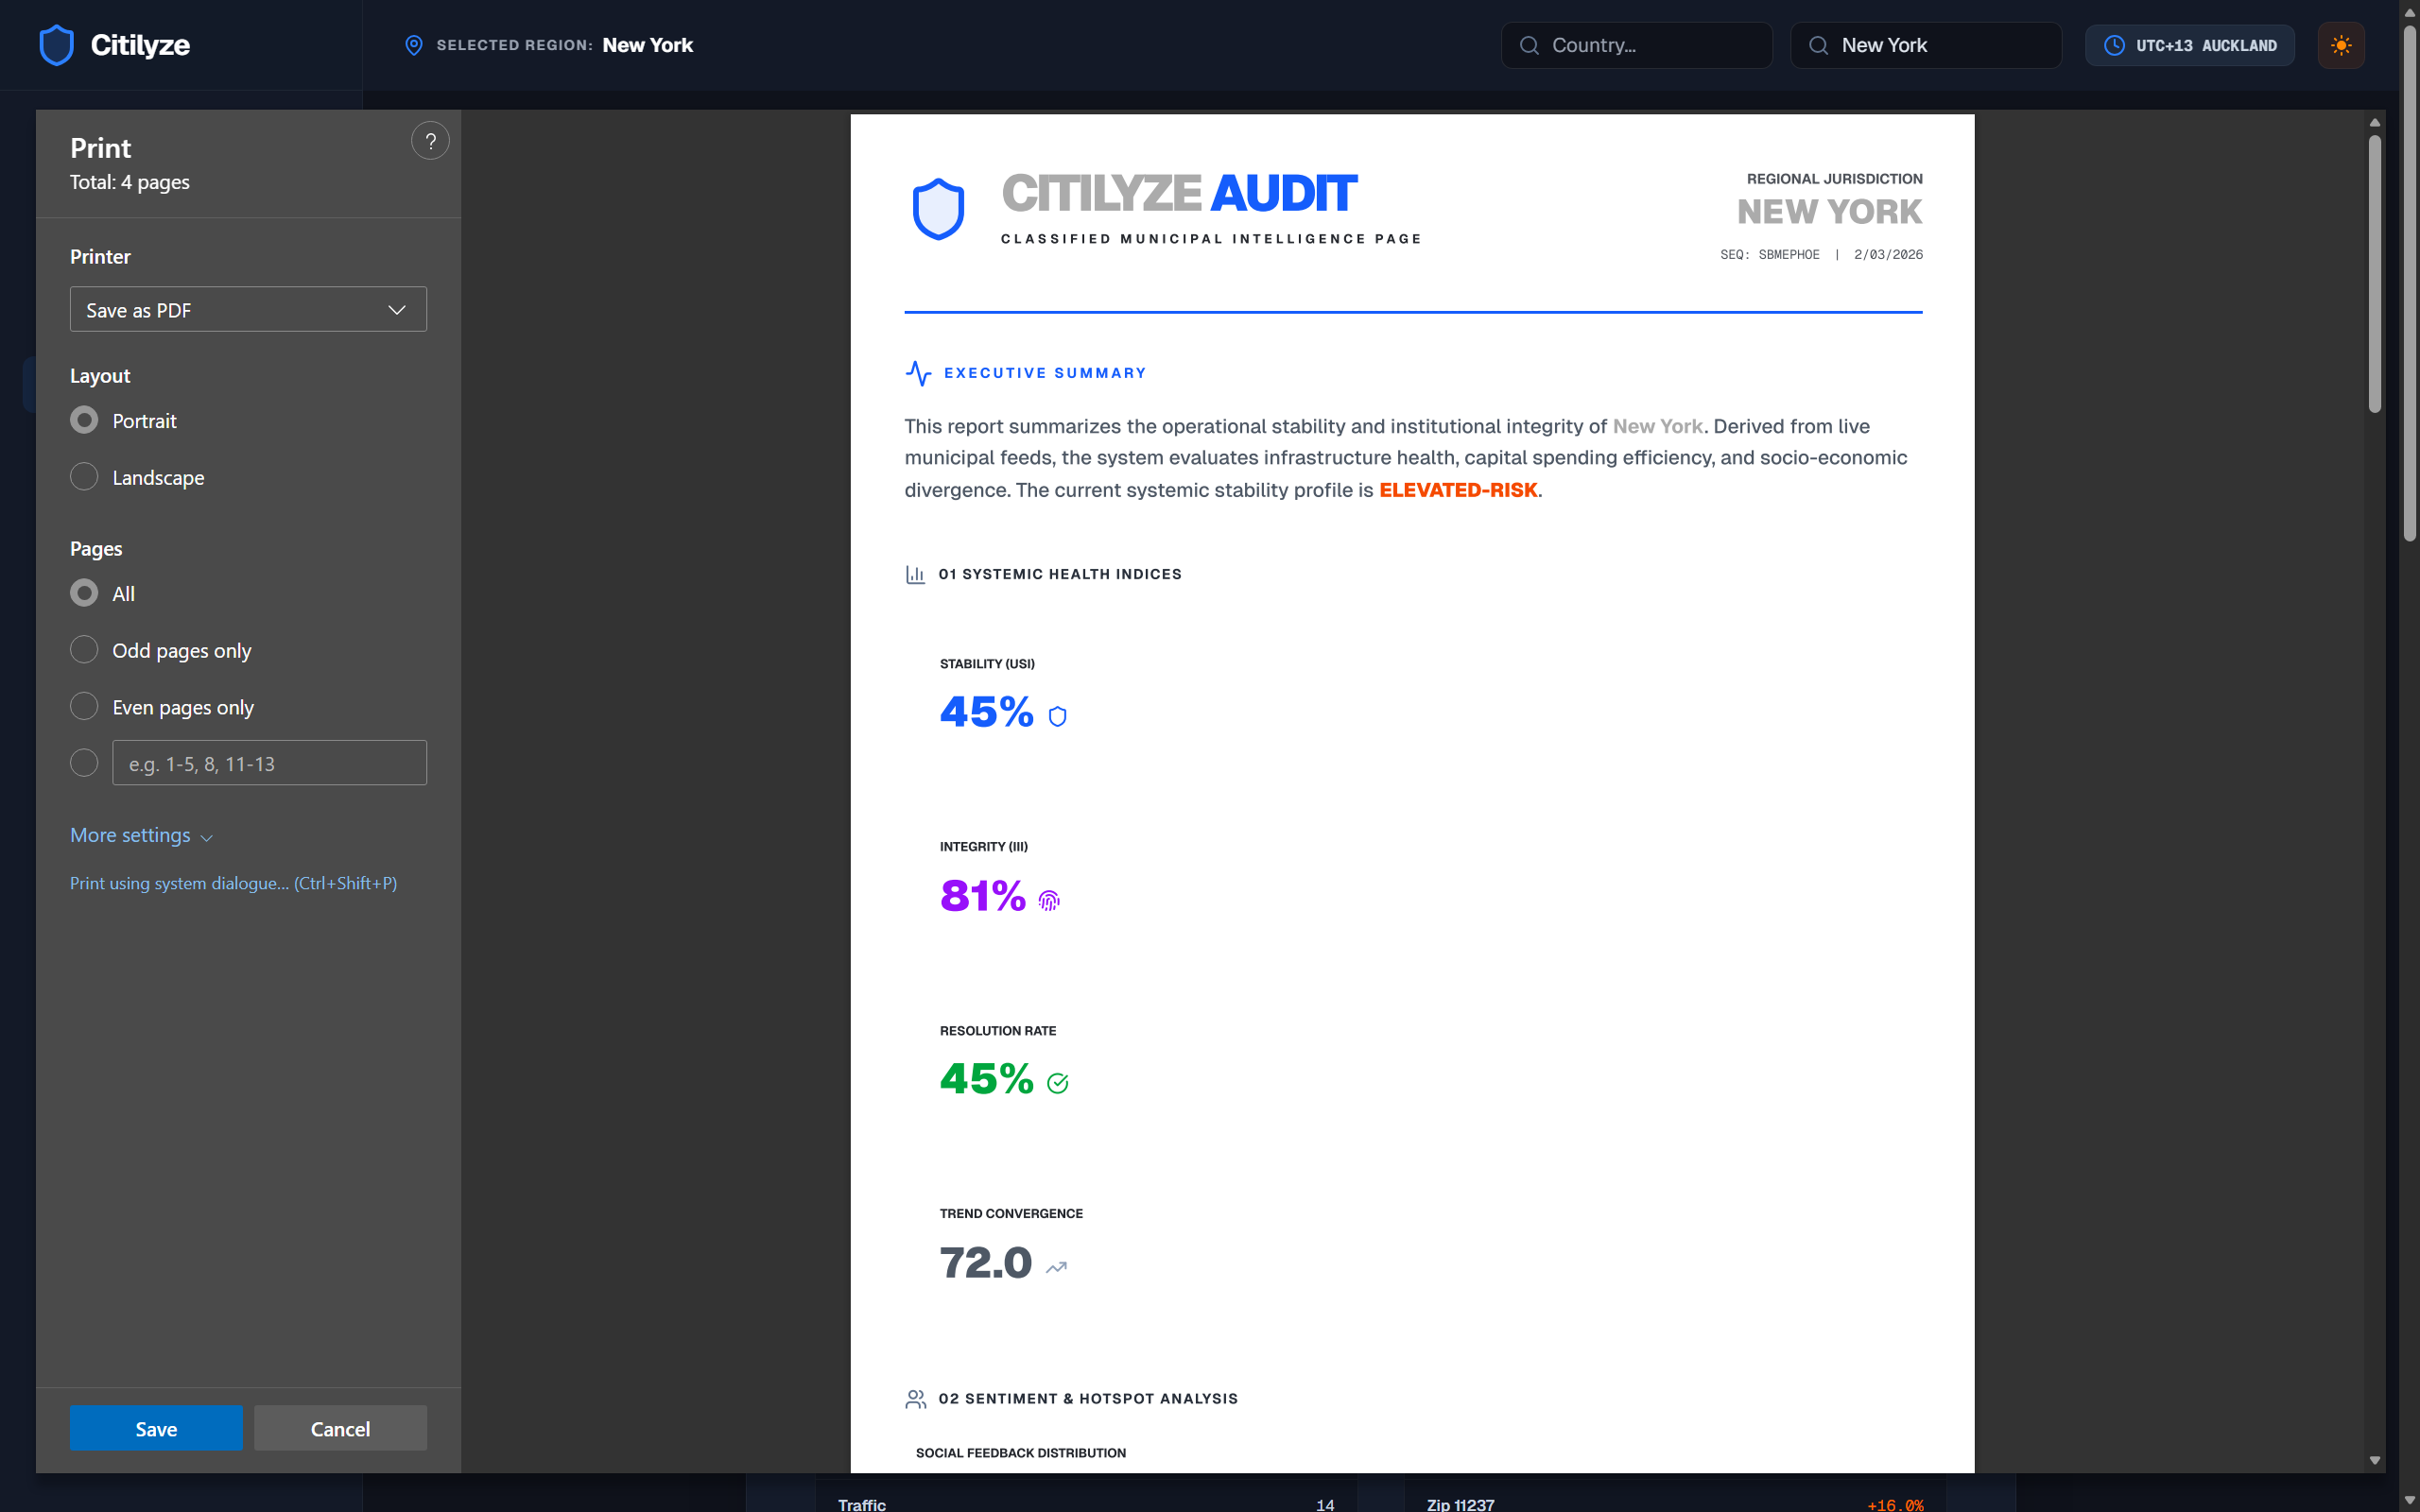
Download PDF
-
Methodology
-
About

Citilyze
🏛️ Inspiration
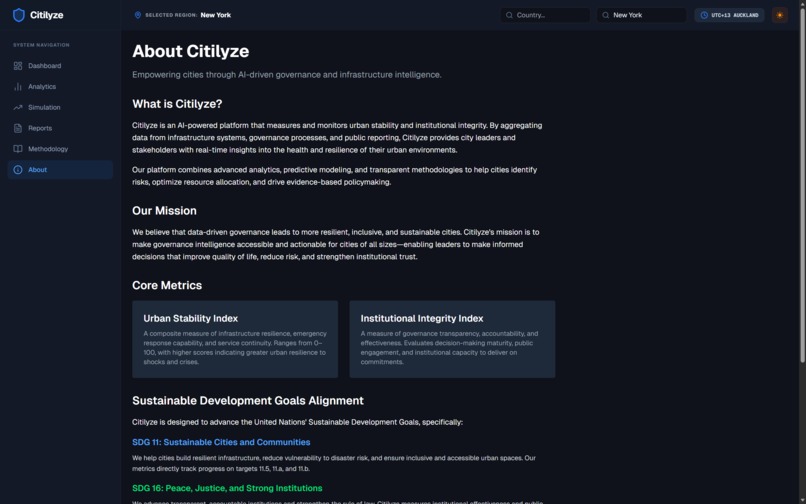
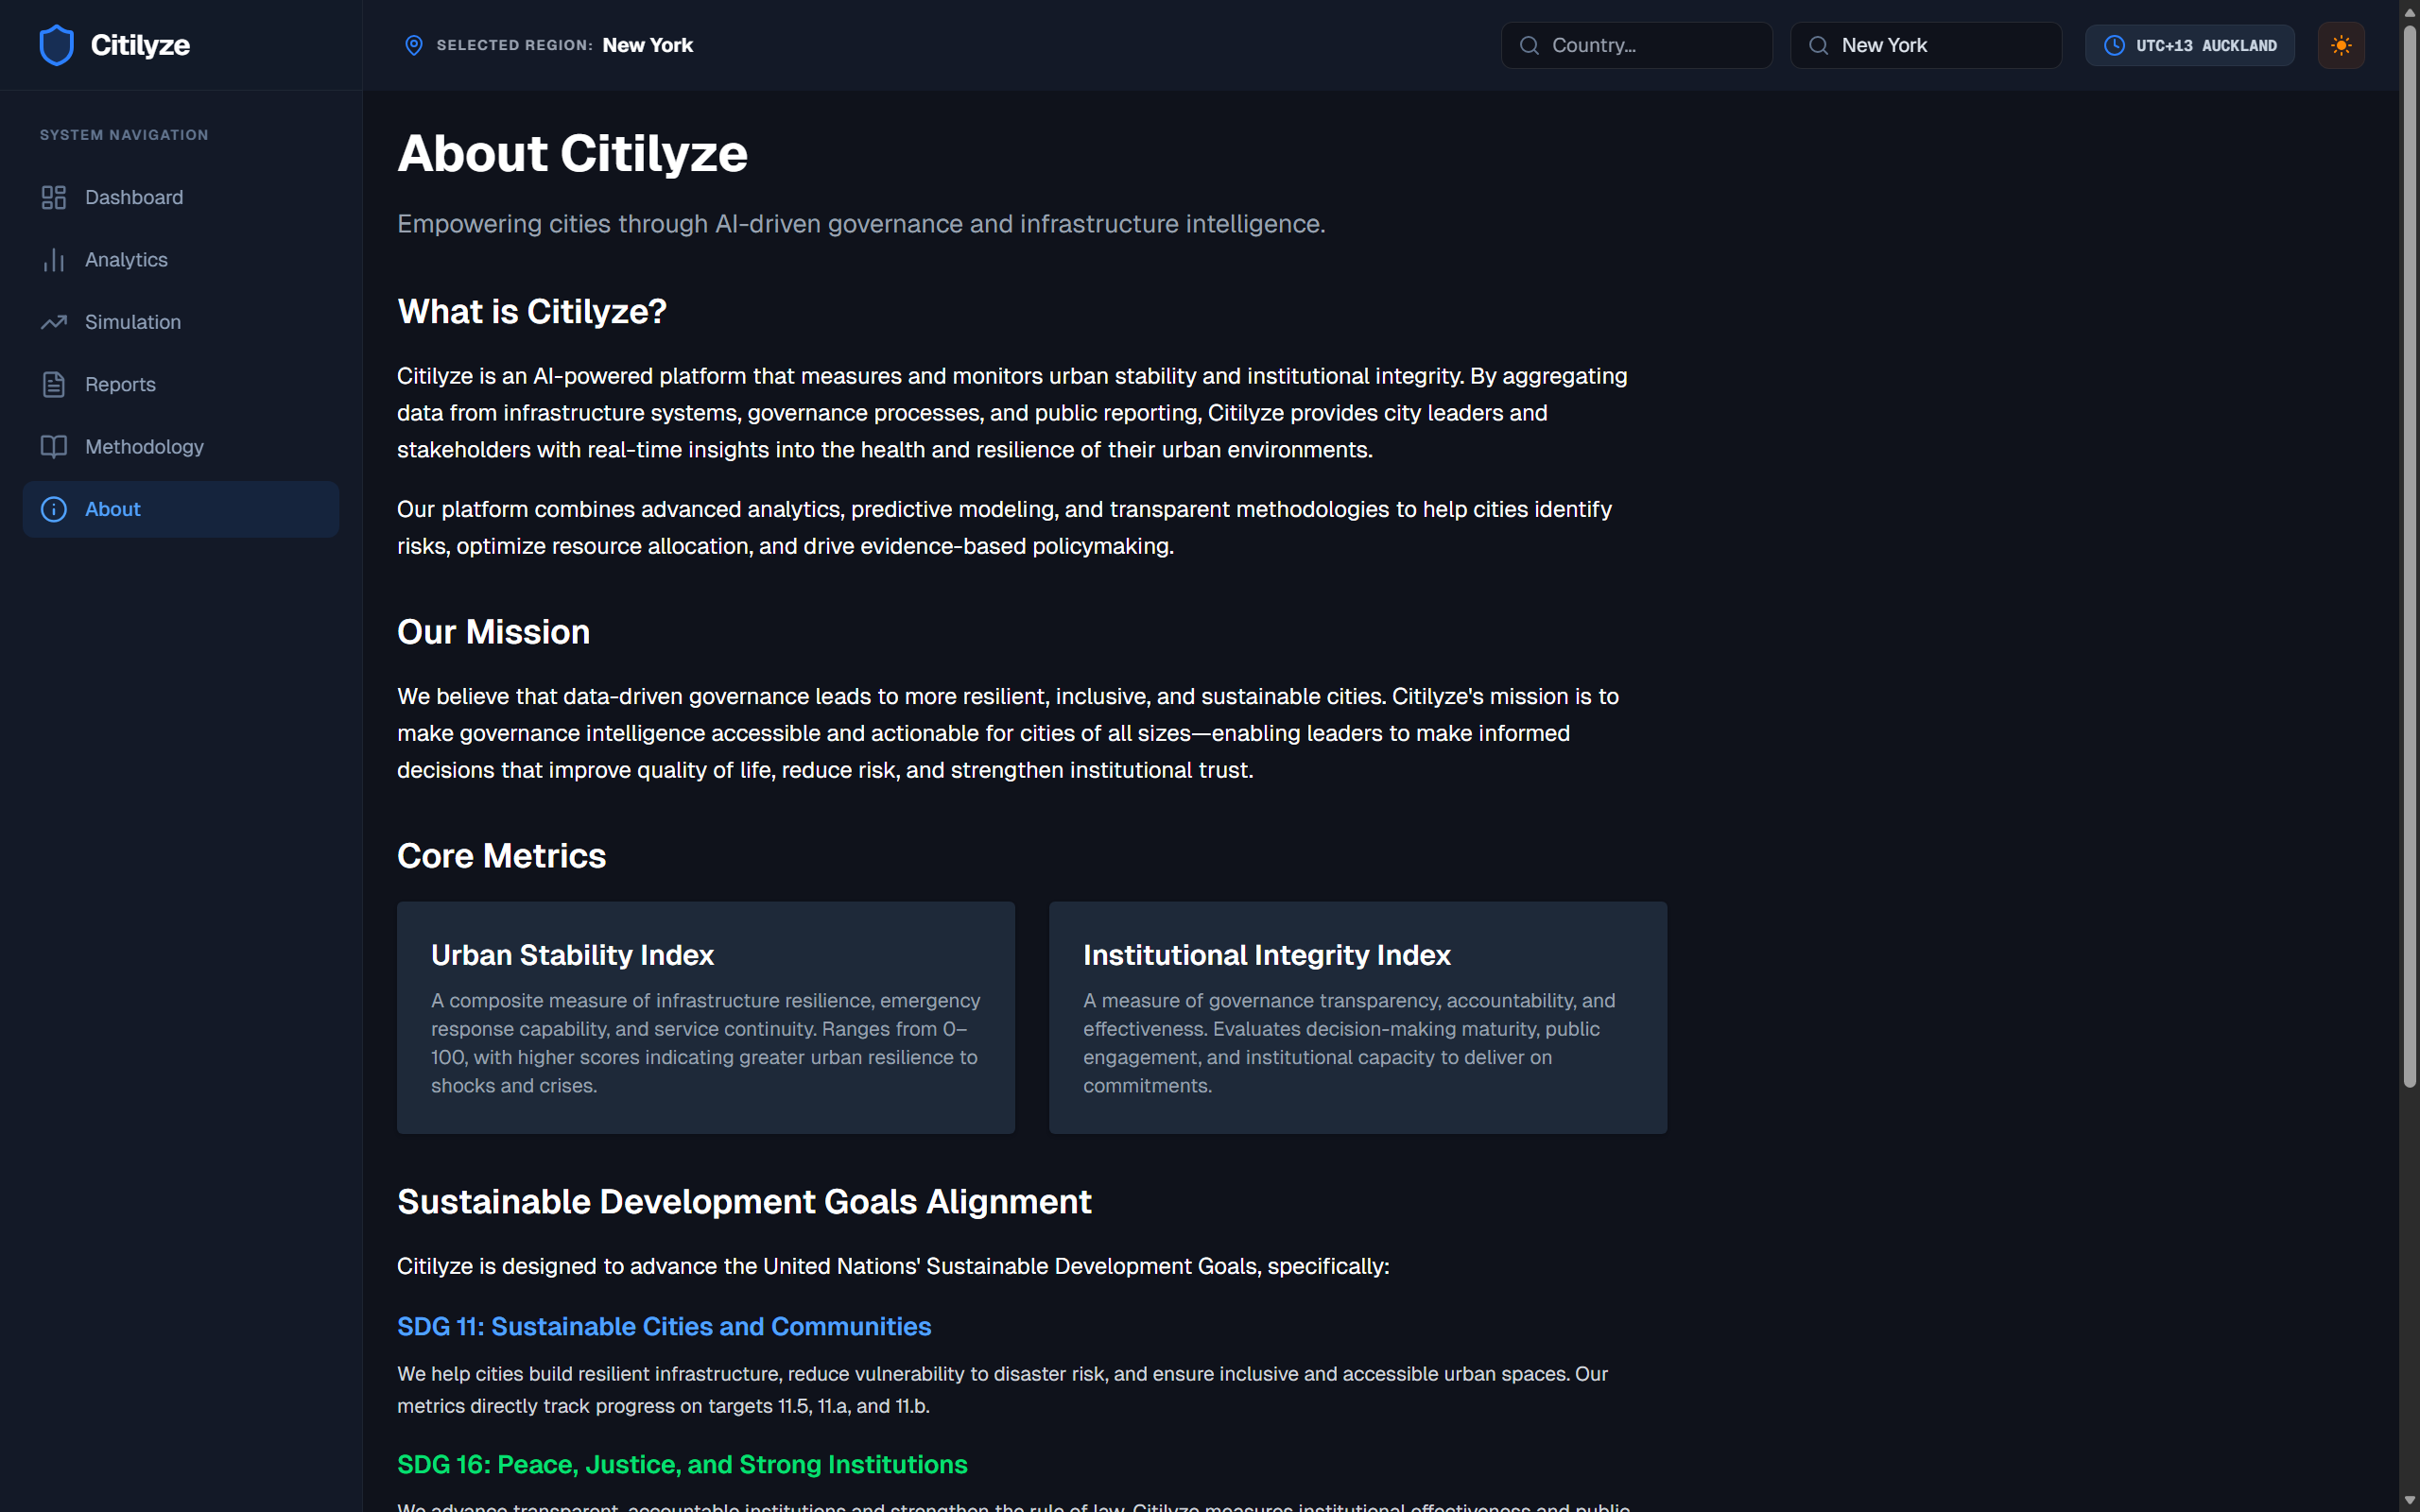
Based on the project task aligned with UN Goals 11 (Sustainable Cities) and 16 (Peace, Justice, and Strong Institutions), I was inspired to build a platform that moves municipal governance from a "reactive" state to a "proactive" one. Most cities are managed through opaque procurement and decaying infrastructure; I wanted to build a high-fidelity intelligence instrument that turns messy data into a cinematic, actionable command center to preserve community stability.
📊 What it does
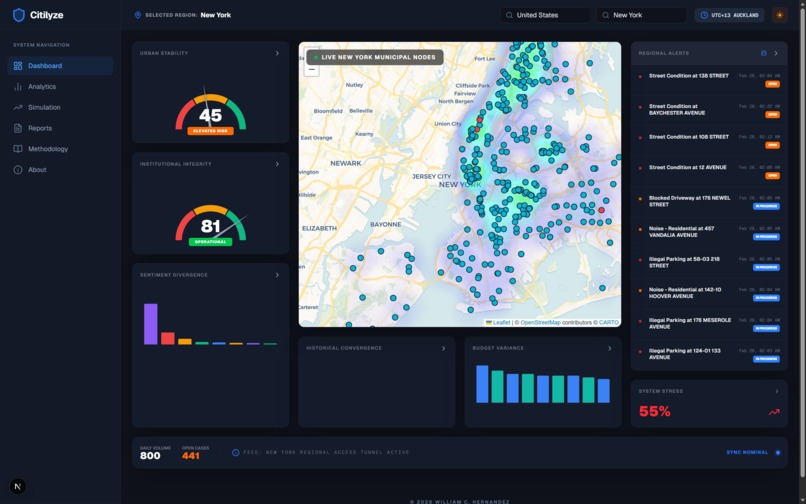
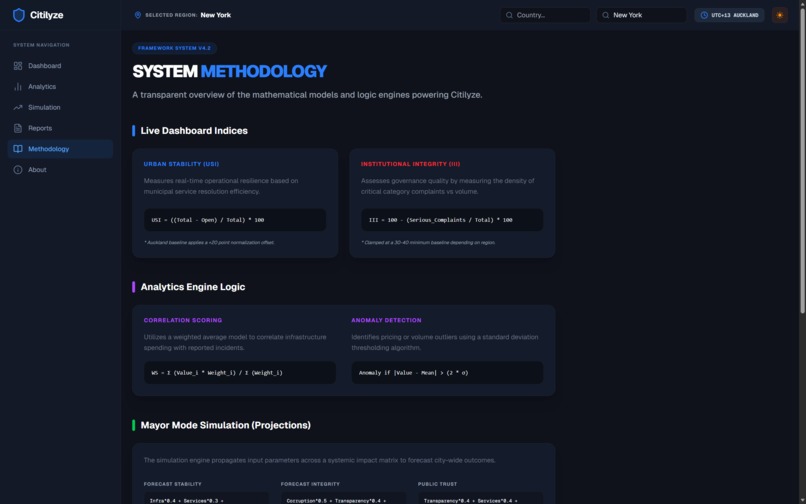
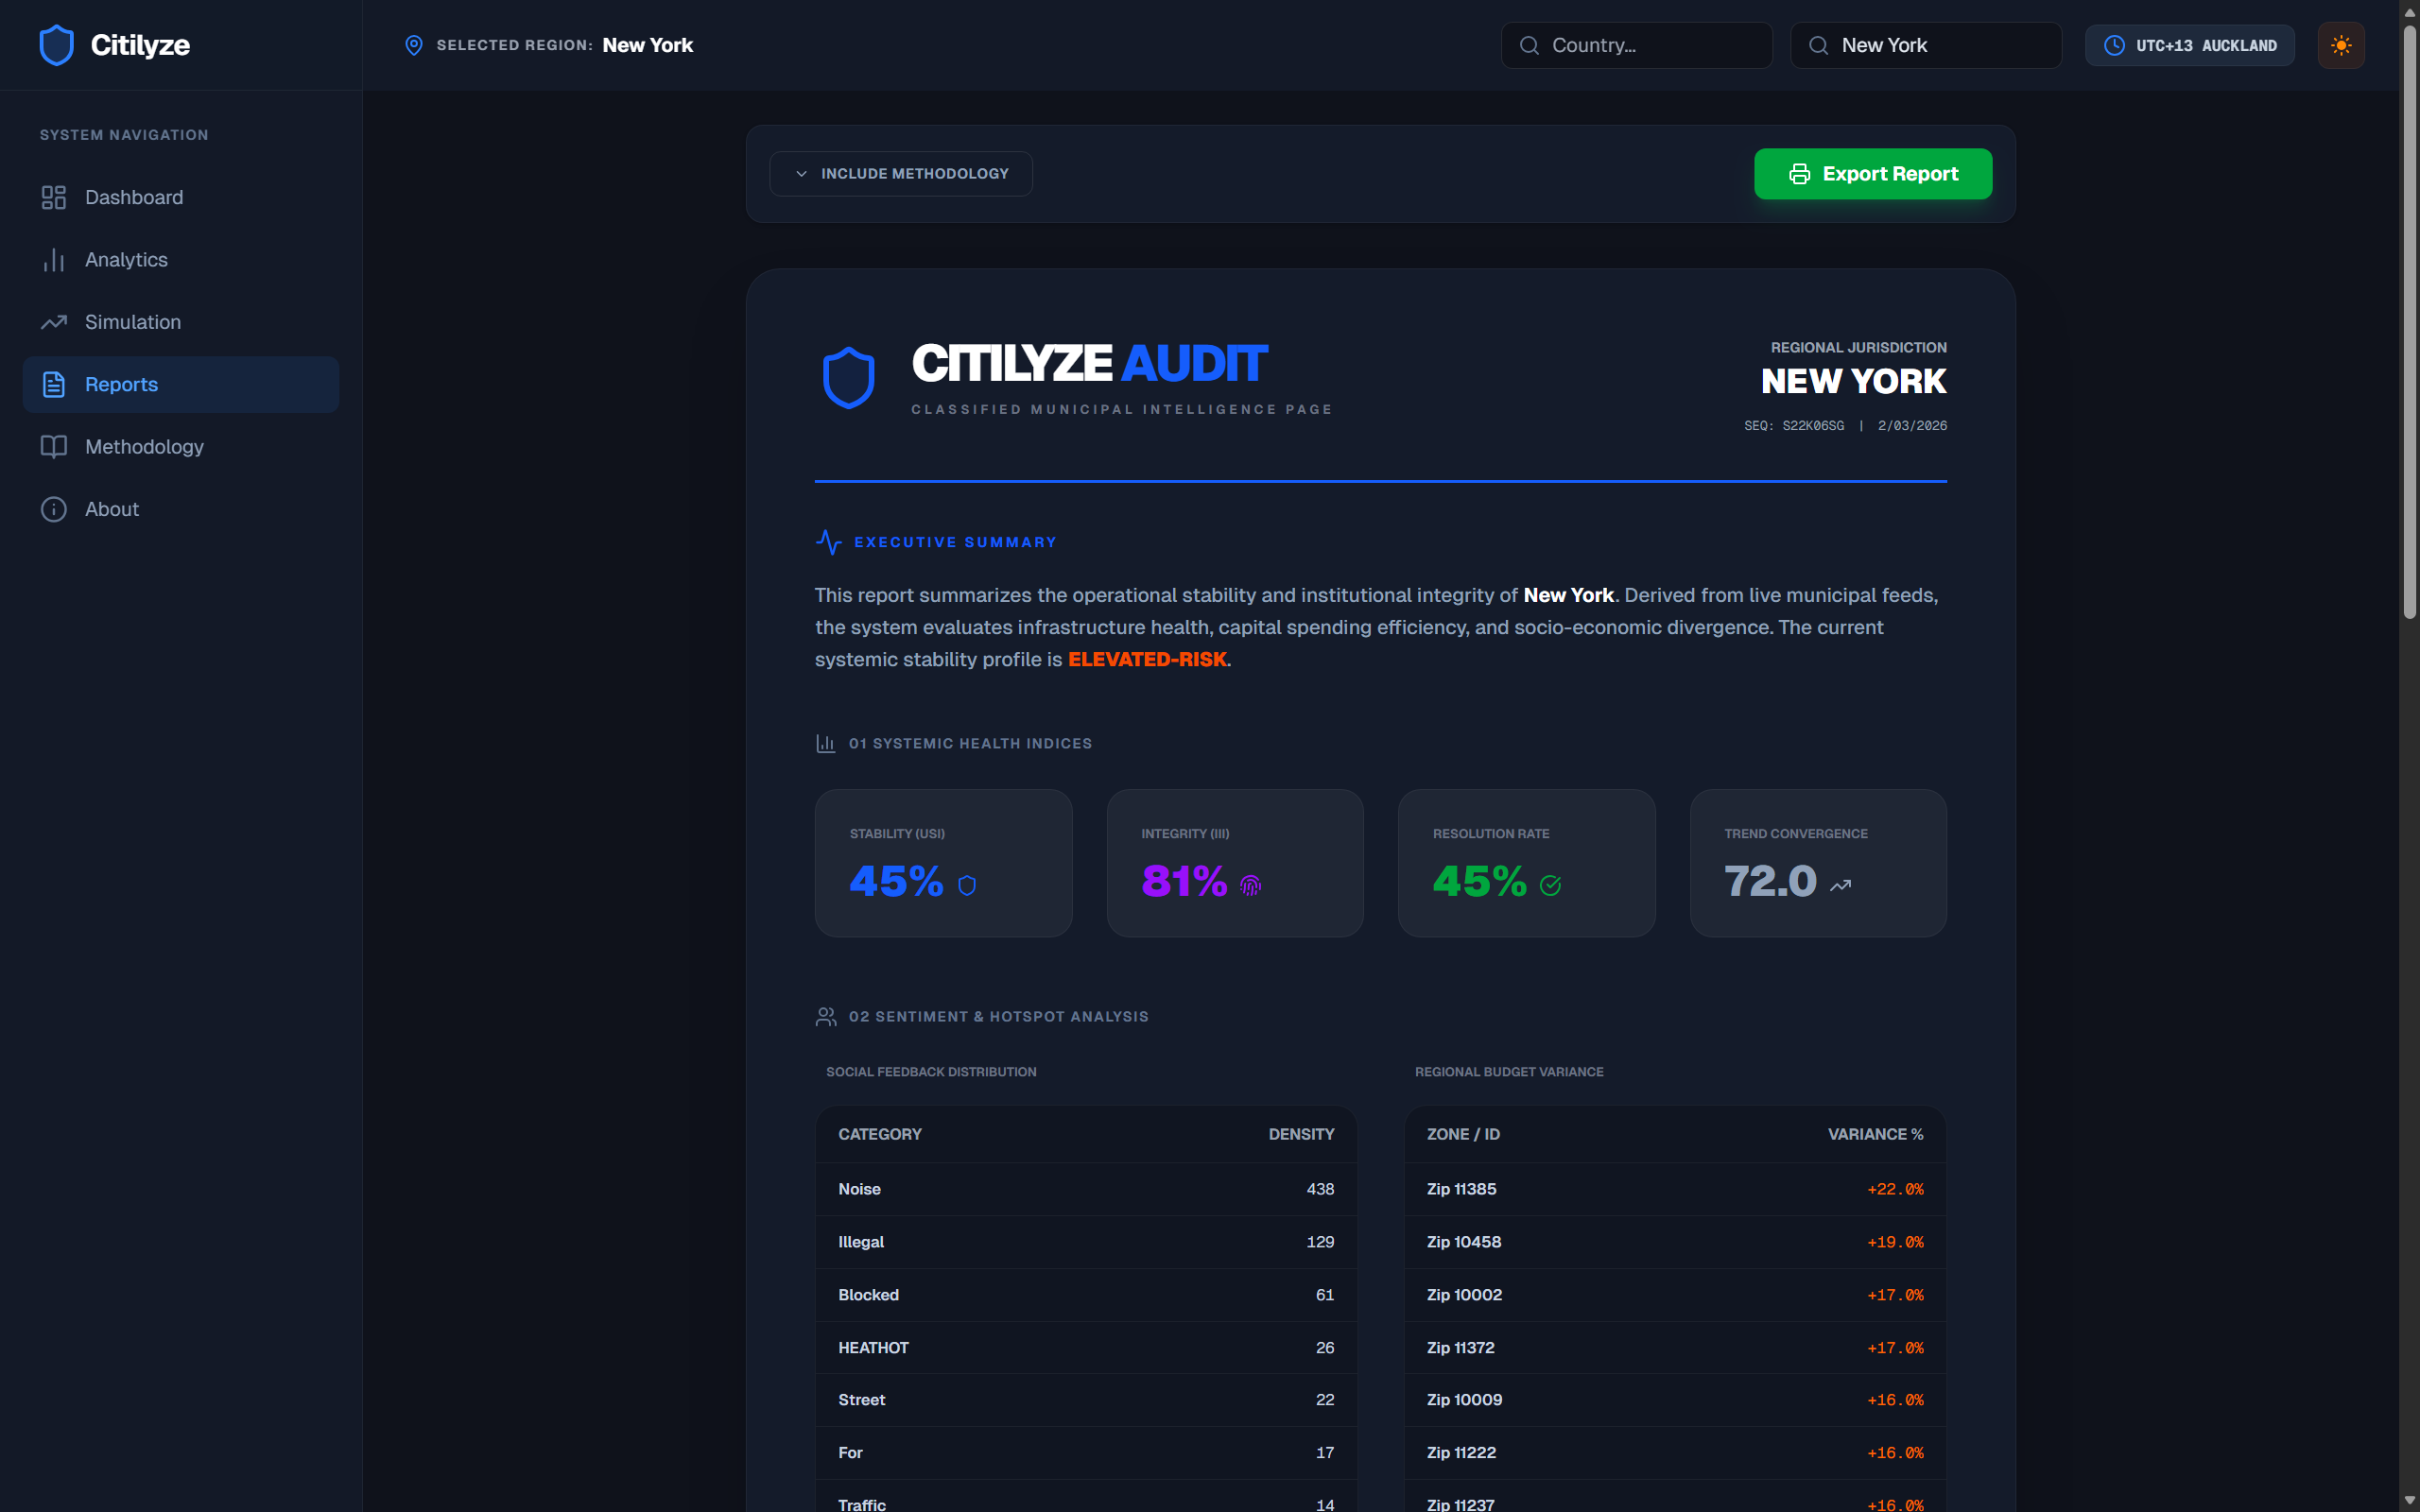
Citilyze is a municipal intelligence dashboard that provides a "Radical Transparency" score for urban environments. It features:
- Live Urban Stability Index: A real-time delta between infrastructure health and service requests.
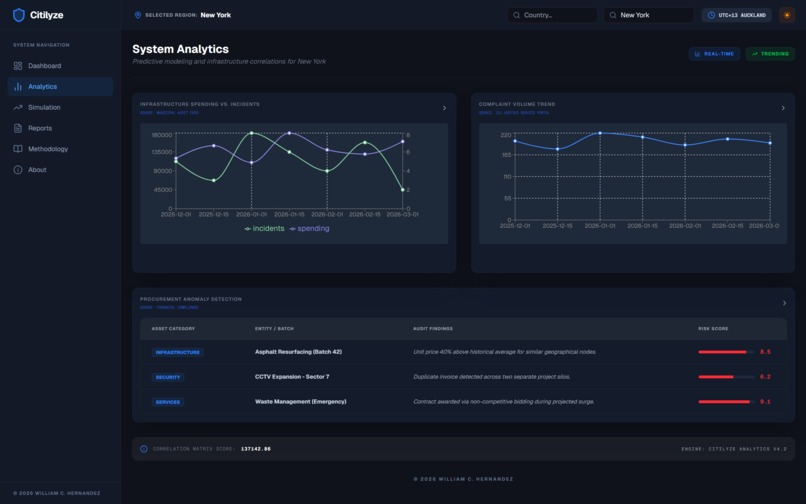
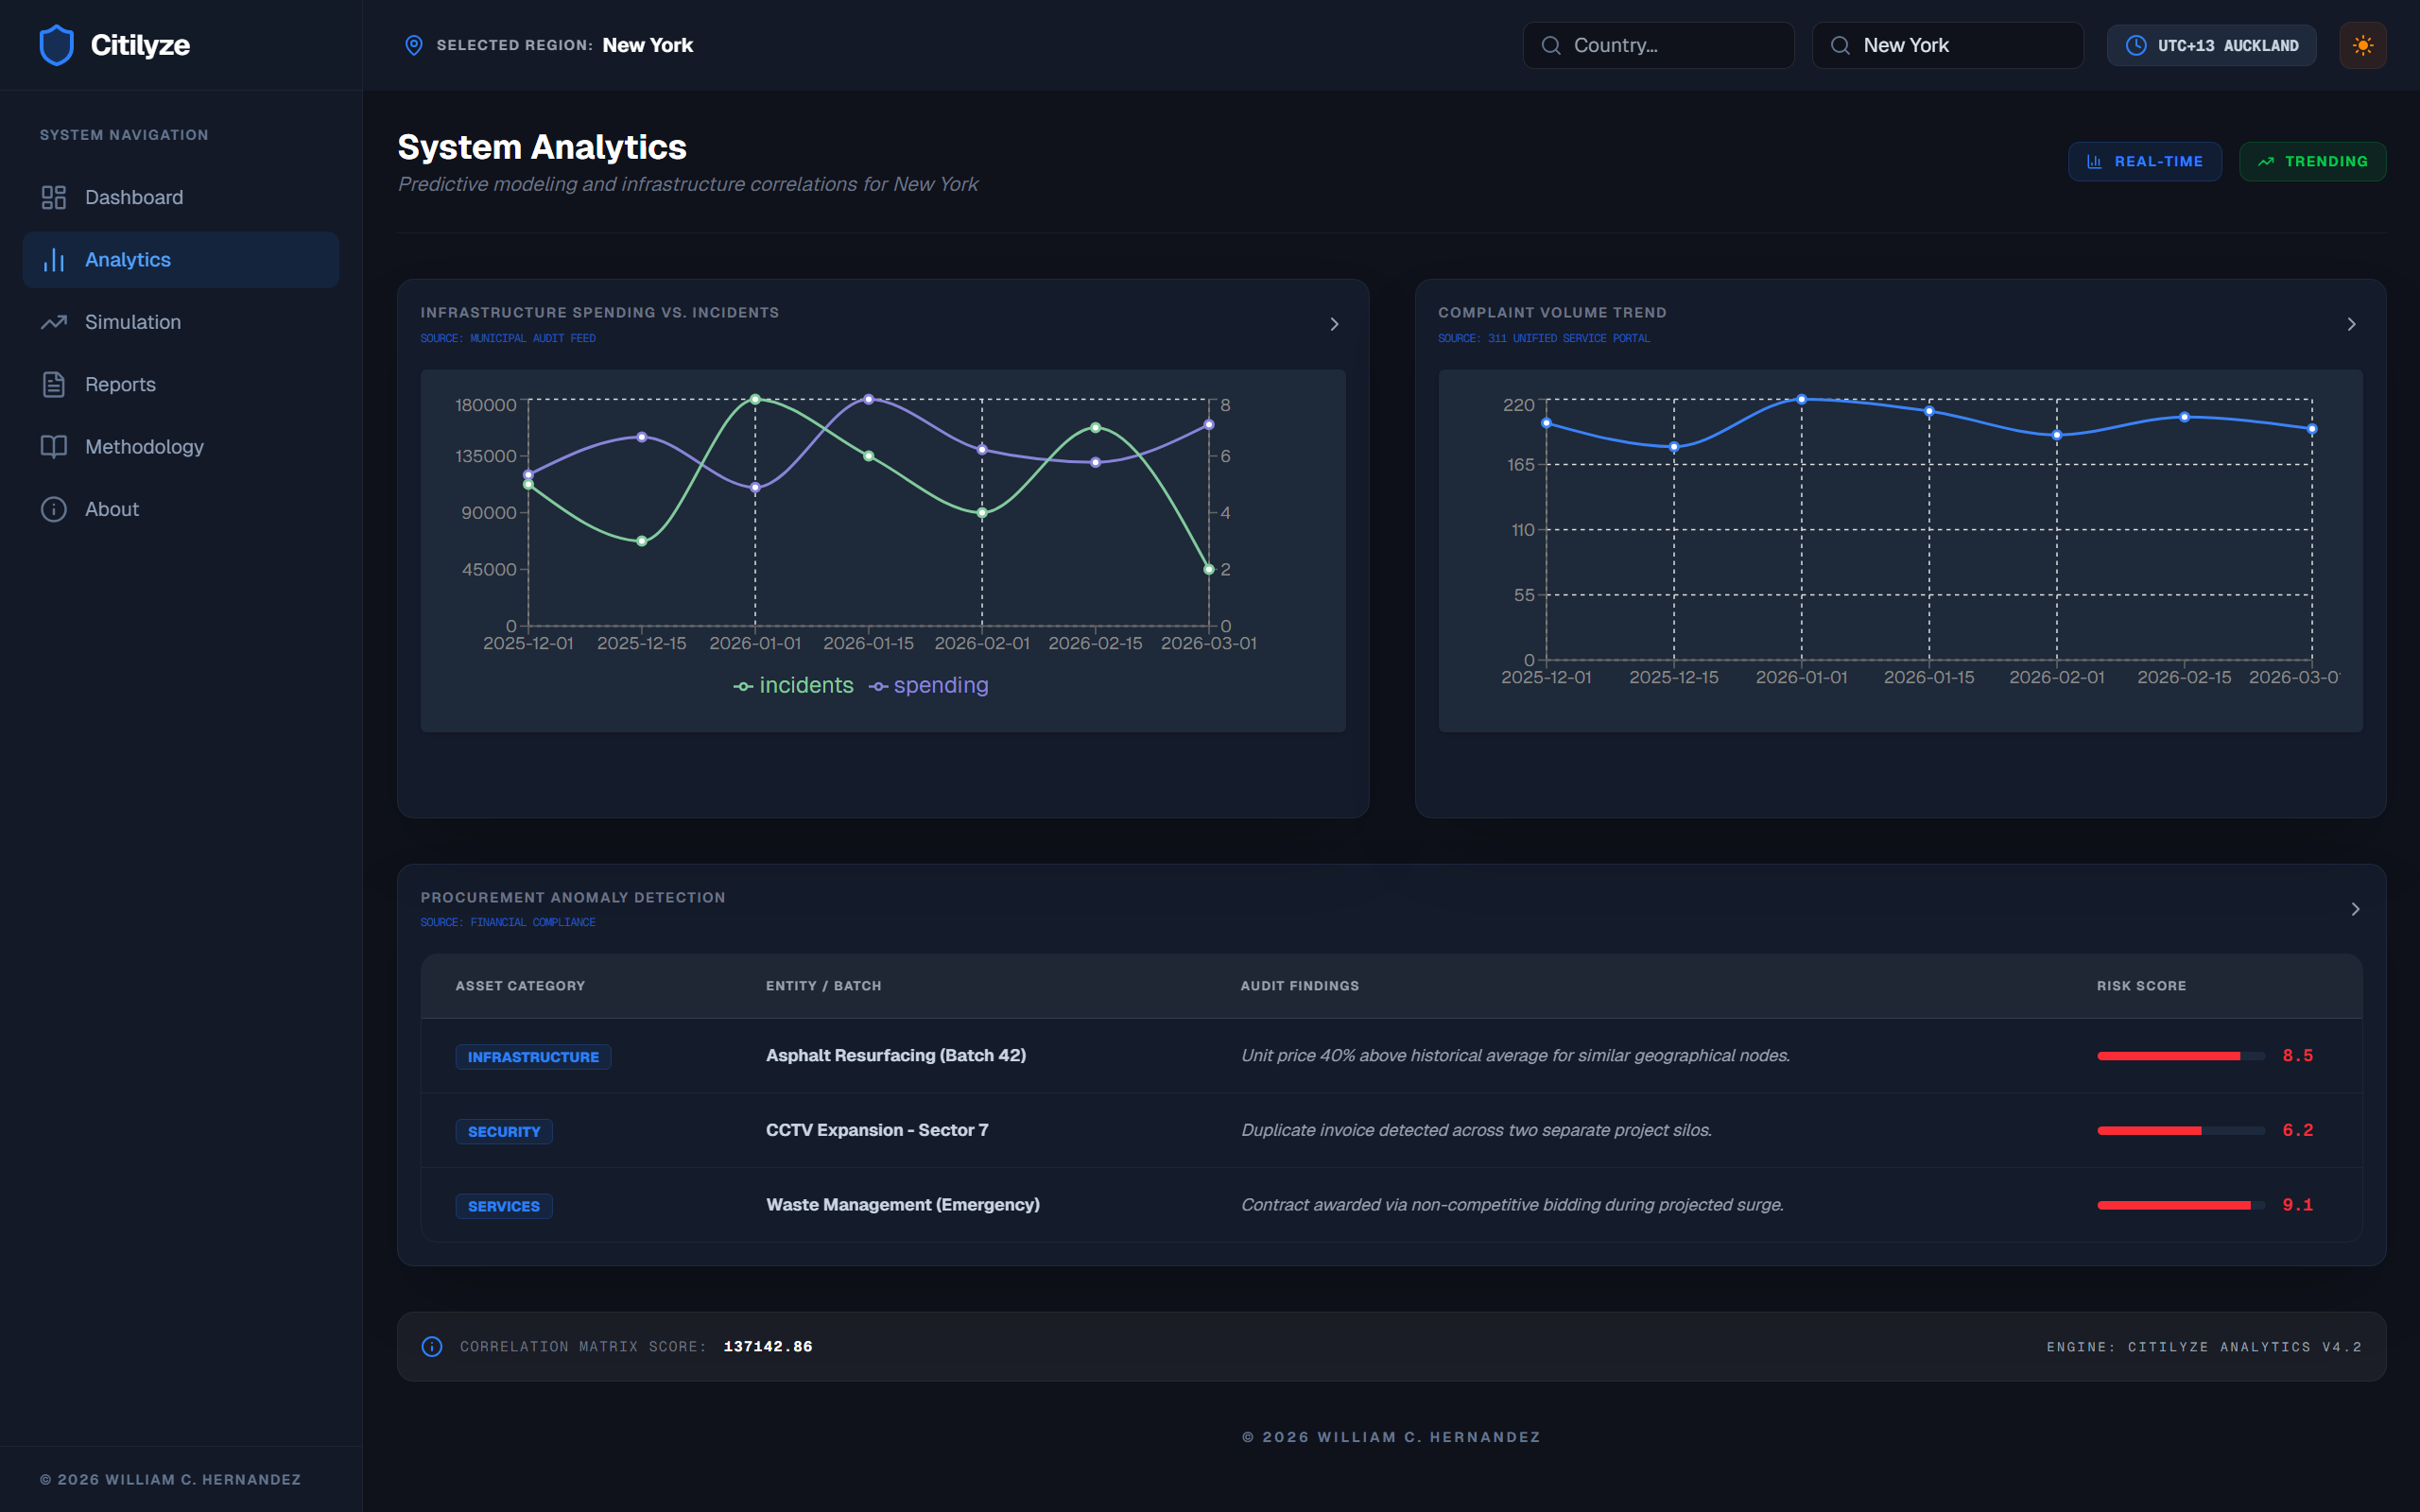
- Institutional Integrity Monitoring: An NLP-powered engine that analyzes social feeds for "Sentiment Divergence" and flags audit risks in procurement.
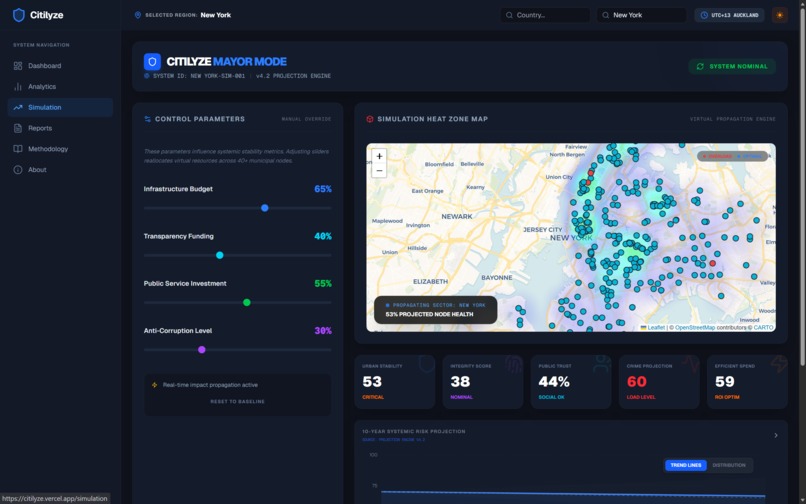
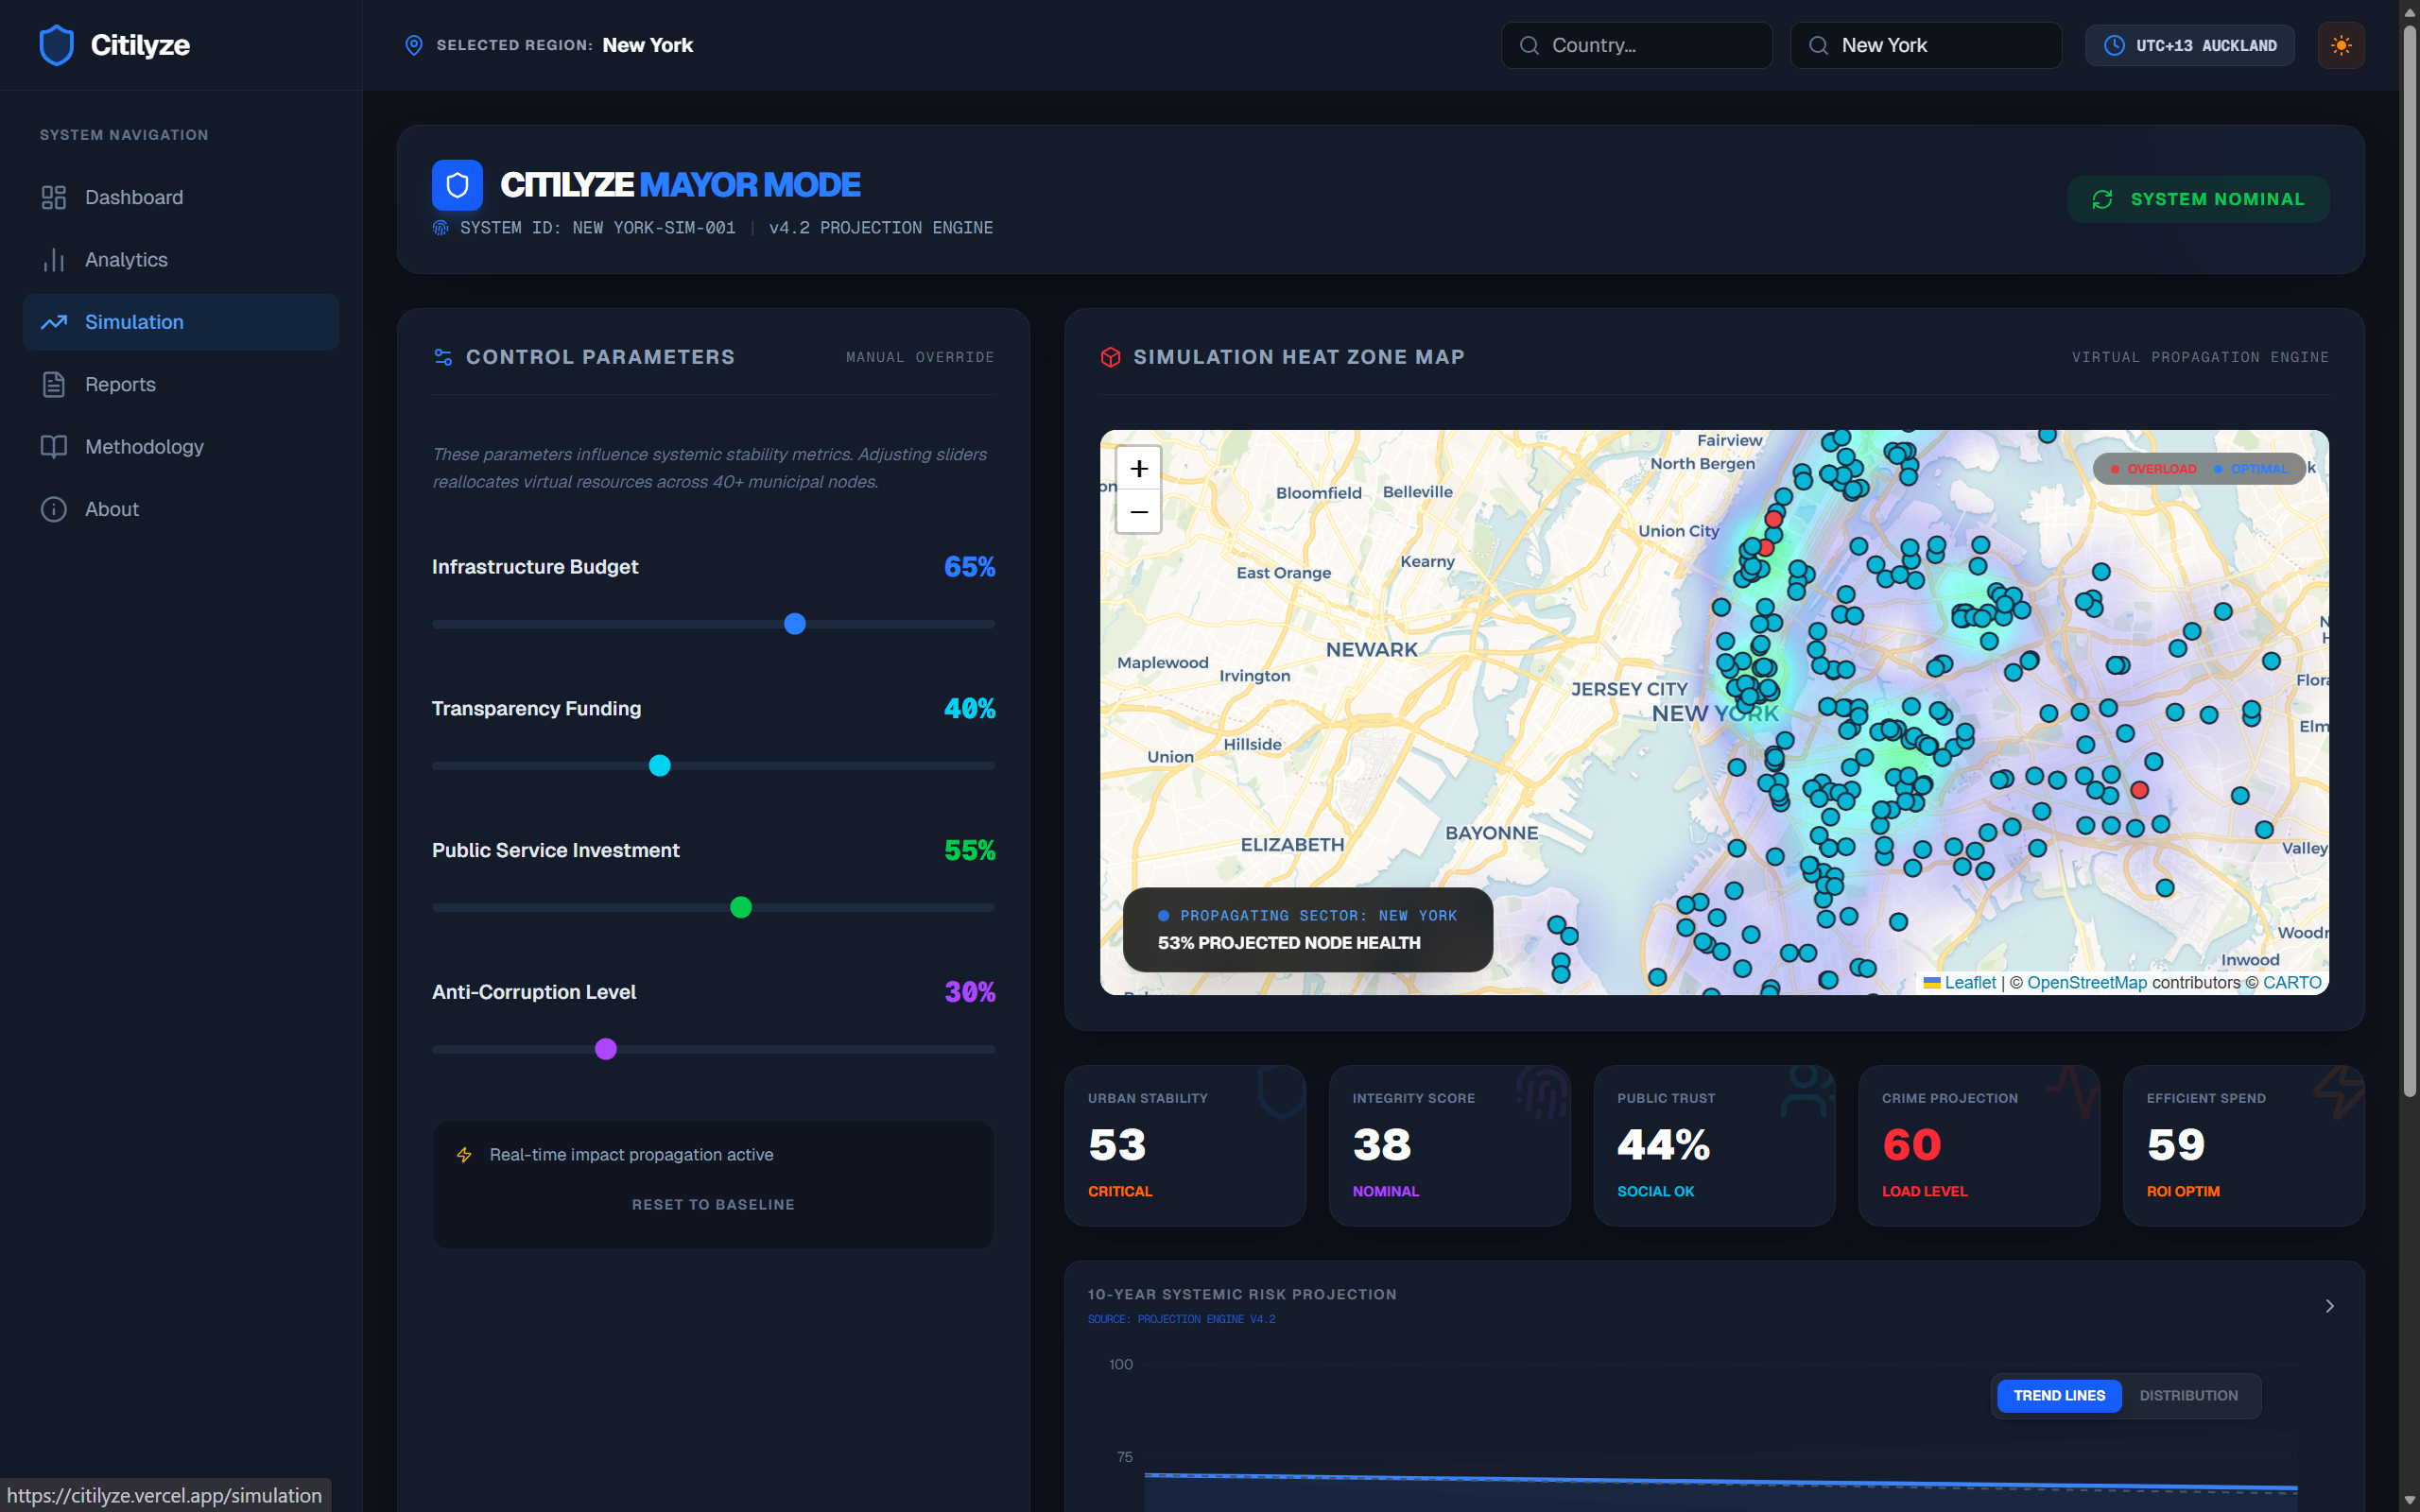
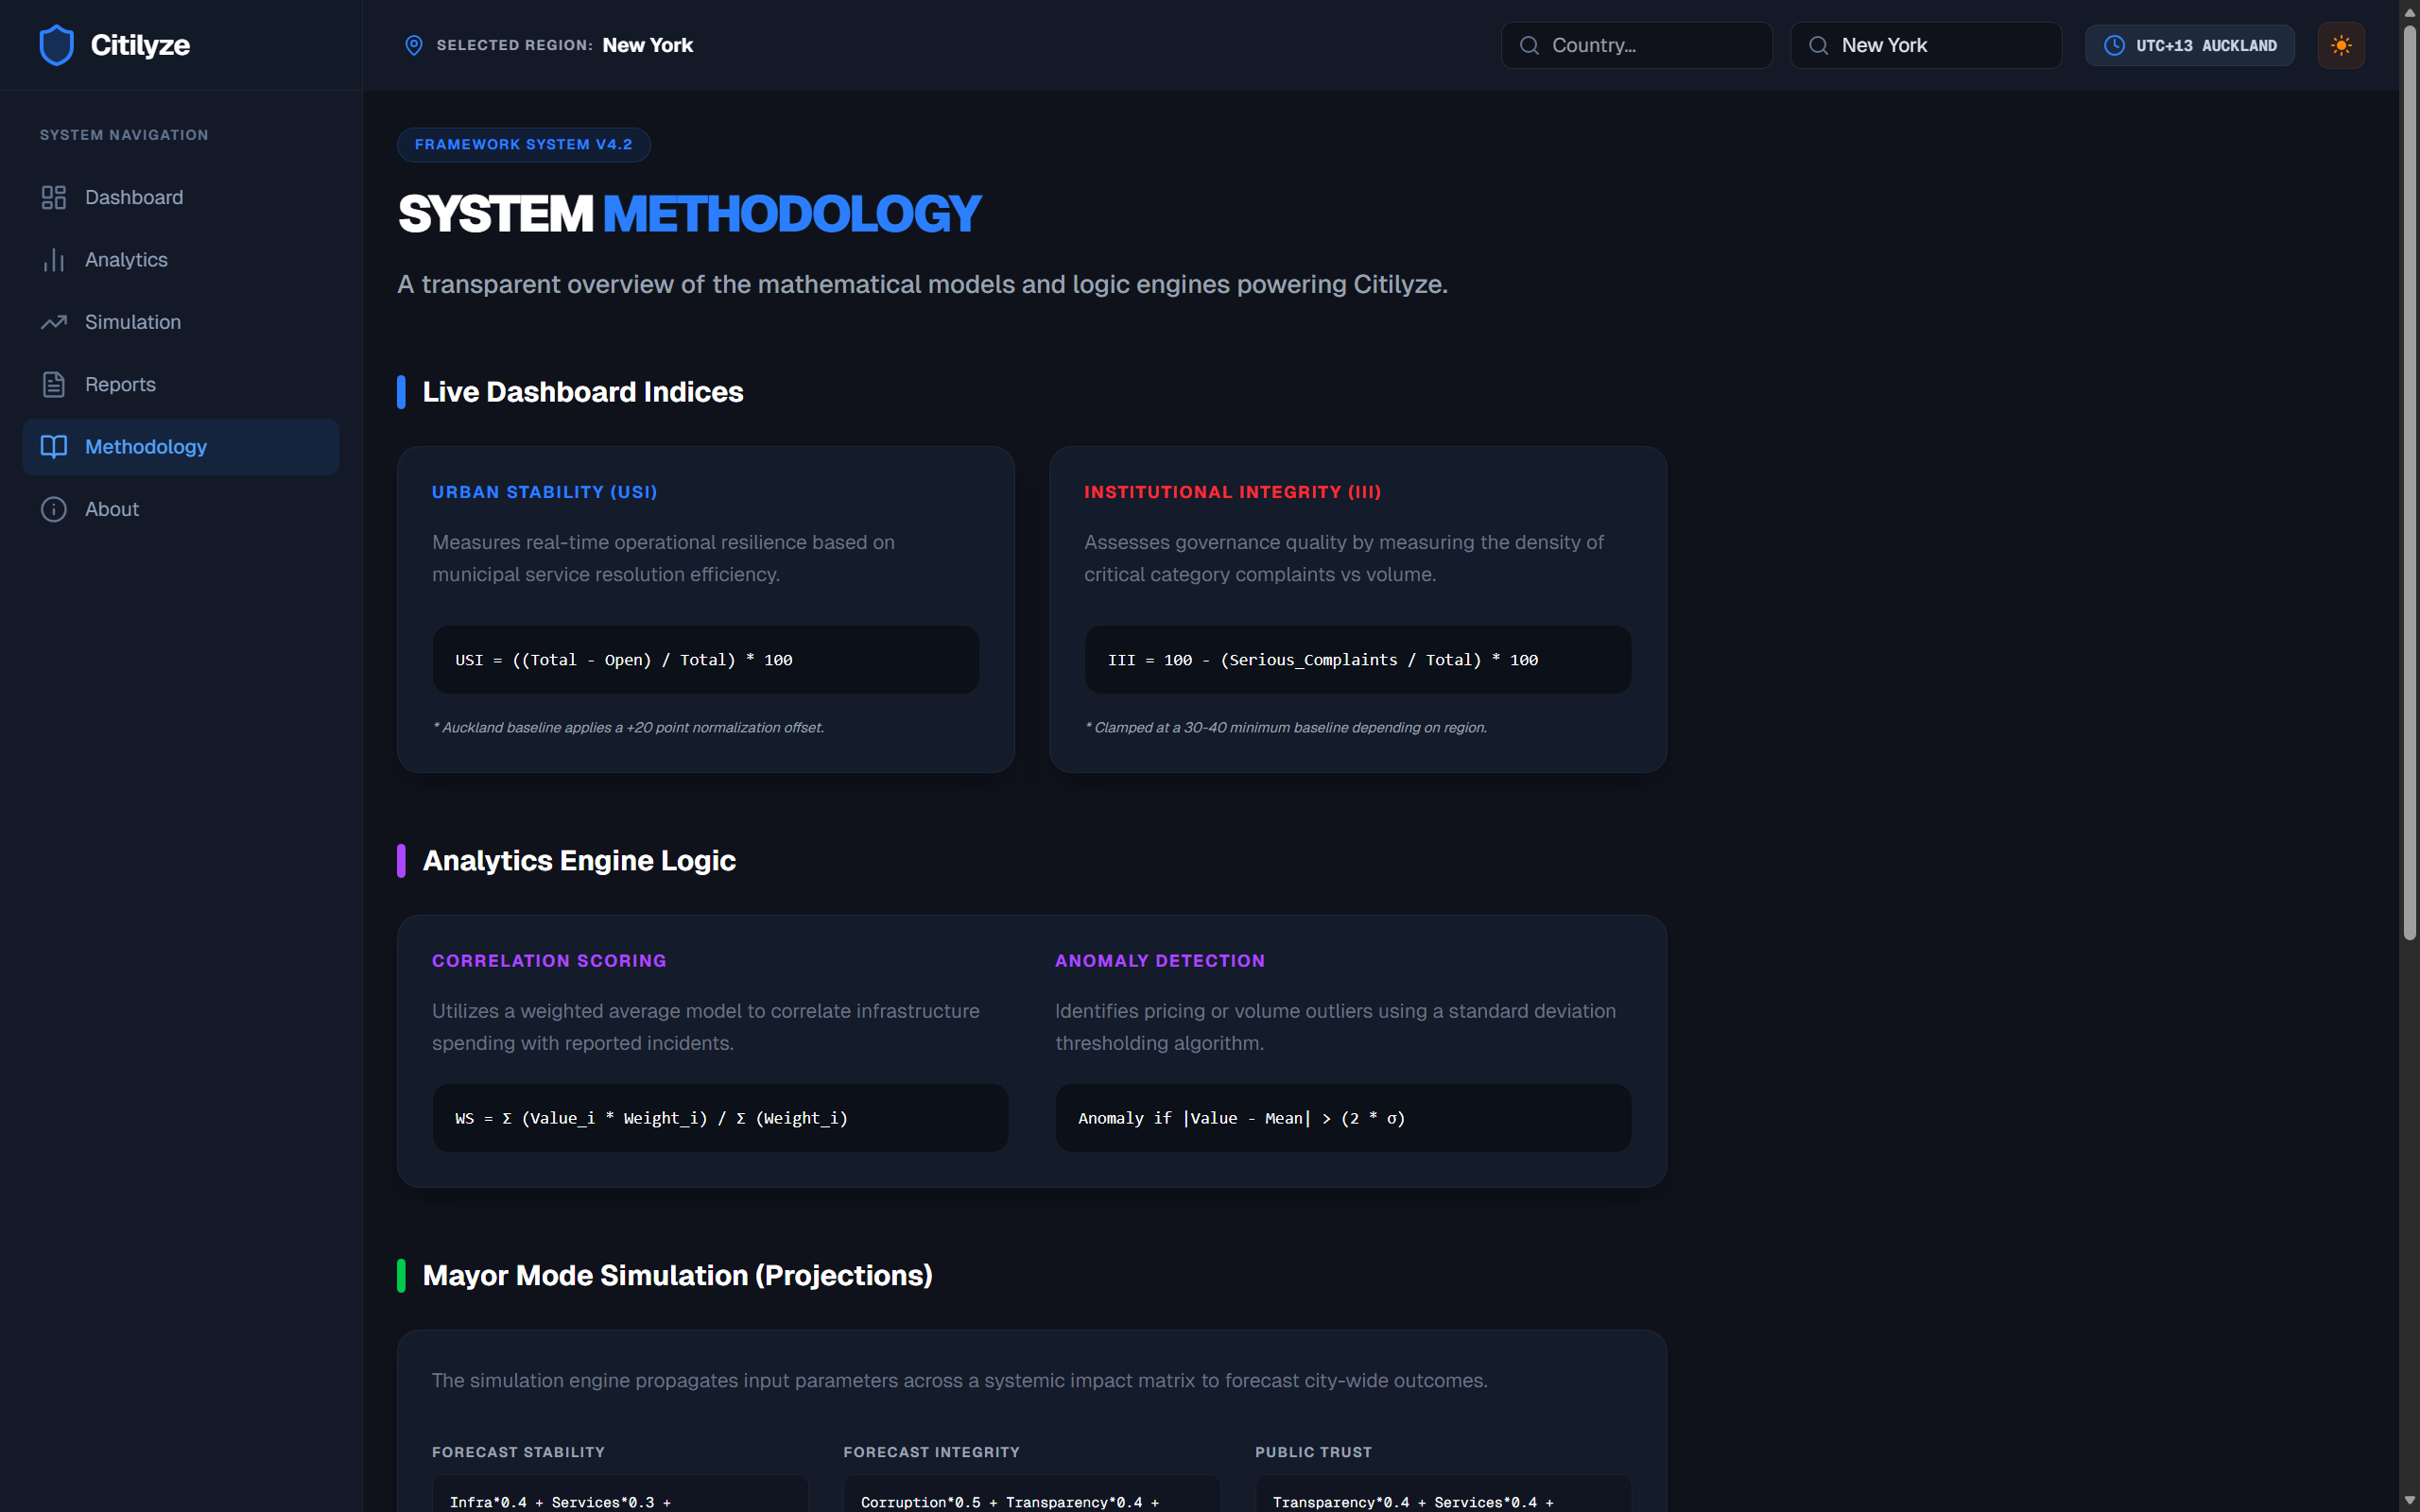
- Mayor Mode (Simulation): A "time machine" feature using a Virtual Propagation Engine to project 10-year systemic risks based on current policy and budget adjustments.
- Efficiency Scoring: Correlating every dollar spent against actual incident resolution to ensure tax-payer money actually hits the pavement.
🛠️ How I built it
The architecture was designed to handle high-velocity data ingestion:
- Frontend: Built with a modern stack (React/Next.js) to handle the cinematic "Command Center" UI and real-time data visualizations.
- Backend & Analytics: I implemented an Isolation Forest algorithm to scan thousands of line-item procurements for pricing outliers.
- Data Processing: Used Natural Language Processing (NLP) to quantify public trust by scraping and analyzing social sentiment regarding city services.
- Simulation Engine: Developed a logic layer that calculates spatial risk projections based on infrastructure nodes and budget variables.
🚧 Challenges I ran into
The biggest hurdle was data normalization. City data is notoriously "messy" and fragmented. Mapping "Sentiment Divergence" from social feeds to specific geographical "infrastructure nodes" required complex coordinate mapping and noise filtering. Additionally, creating a predictive "Mayor Mode" meant balancing historical decay rates with real-time budget variables without over-simplifying the socio-economic impact.
🏆 Accomplishments that I'm proud of
I successfully moved beyond a simple data "visualizer" to a "predictive engine." Seeing the Virtual Propagation Engine accurately project how a budget cut in infrastructure today could lead to systemic risk in 10 years was a "eureka" moment. I also take pride in the UI—it feels less like a spreadsheet and more like a high-stakes flight deck for city leaders.
🧠 What I learned
This project reinforced the idea that transparency is a technical challenge, not just a policy one. I learned a significant amount about anomaly detection in procurement data and how to use NLP to bridge the gap between "official reports" and the actual lived experience of citizens on the street.
🚀 What's next for Citilyze
The goal is to scale the Prophetic Audit features. I want to integrate IoT sensor data directly from smart-city grids to automate the "Urban Stability Index" without manual reporting. I also aim to open-source the "Efficiency Score" methodology so citizens can hold their local governments to a global standard of radical transparency.
I also want to include information around the world. At the moment, I only have live data feeds from New York, USA.
Built With
- git
- leaflet.js
- next.js
- tailwindcss
- vercel


Log in or sign up for Devpost to join the conversation.