Inspiration
Those who have undertaken any research project know the feeling when your supervisor first sends you a stack of publications to get up to date on what the project will be about. Once you start reading, the technical details can quickly cloud the bigger picture and obscure connections between different papers. This is a growing issue as interdisciplinary fields are growing rapidly and require researchers to enter new project spaces [1]. If only there was an assistant to help you keep track of the flow of ideas through the body of work!
What it does
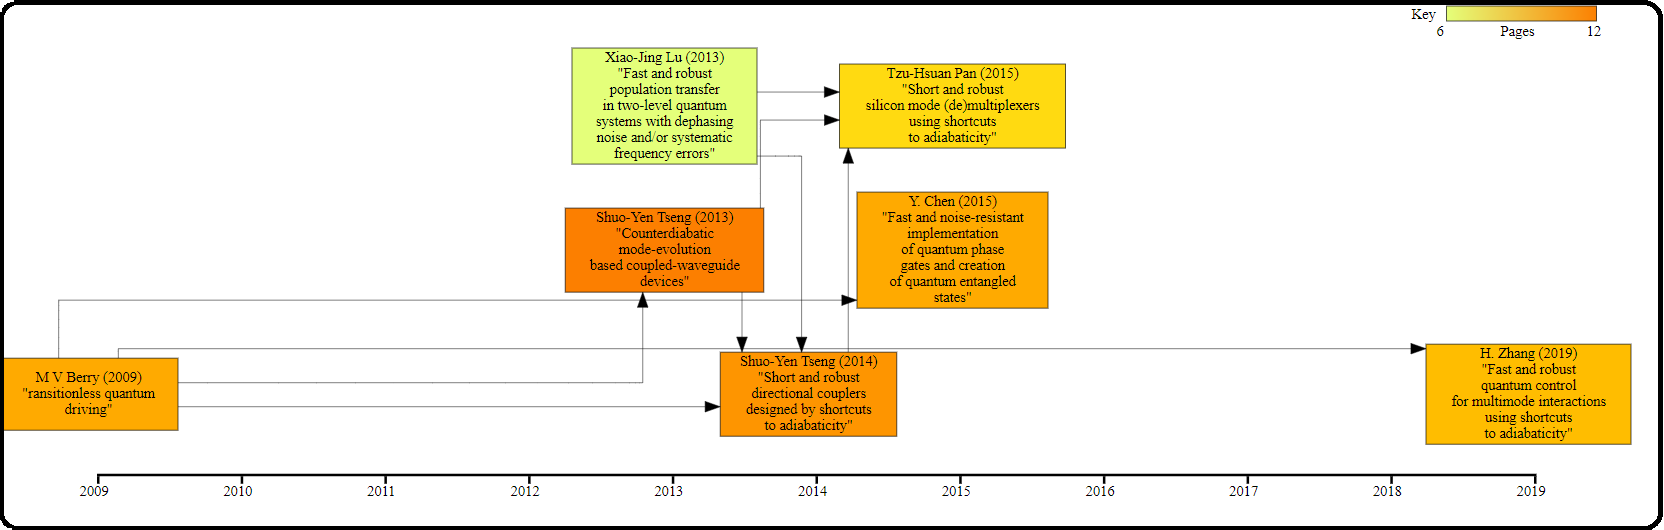
Citr.us focuses on the first and most critical step of understanding a new field - seeing connections in the temporal structure of different publications. Given a stack of PDFs and relevant titles through the Citr.us UI, we parse the documents looking for citations and other metrics. From here, a flowchart is generated.
Each publication is a node, with arrows indicating where citations are present. The x-axis illustrates the year of publication, giving a sense of the rate of progression of ideas. Also, the colour of the nodes represents the paper length, indicating the relative sizes of the works. Each node is clickable to open up the PDF in question. This is presented in an svg format, which is a staple in the research community, and can be easily manually edited to include personalised annotations as the project goes on.
Tech Stack
- UI: PySimpleGUI, which gives a visual representation of the working directory. Selections and manual inputs are taken from the user in this framework and sent to the PDF module.
- PDF Reading: PyPDF2 and pdfreader - Text is stripped from a PDF and the citations of each paper are found using a string matching algorithm. Other metrics relating to the size of the document are also extracted.
- Data Structure: PaperData class (written from scratch) - Data structures pertaining to publications are populated and passed to the graphing module.
- Graphing: PyGraphViz - When graphing, the years of publications determine the x coordinates, while the y coordinates are found by implementing a pattern similar to a wall of bricks. Standard colourmaps are used to fill the nodes with size data. The x axis and key are generated as separate SVGs and superimposed.
Challenges
We began by attempting to leverage Google Scholar’s inbuilt citation information. However, this goes against the ToS [2]. Furthermore, working with a PDF allows us to extract more information without breaching publication accessibility boundaries. This also allows the user to select the boundaries of the flowchart, which are limitless in the scope of Google. In addition, PDF parsing is non-trivial, and required a lot of technical skill! In some cases, characters in different fonts are read inconsistently, and whitespace characters aren't always detected. Our team spent hours devising workarounds and effective solutions, including combining the use of two Python PDF libraries in order to create a reliable, accurate product. Our app does still manually prompt the user for the publication title, in order to maintain accuracy when searching for this crucial field. This is something we would look to further automate in future.
Accomplishments that we're proud of
We're incredibly proud that we managed to build a working application from scratch, performing a useful functionality, within the short period of this hackathon!
As someone who has made a similar flowchart manually before, I’m proud of the level of automation we have been able to introduce. We are also happy with how unique and visual this solution is, compared to the current accepted practice of reading a review paper.
Citr.us' ability to assist researchers can have a huge impact, decreasing the turnaround time for significant papers that require large amounts of research, by reducing initial planning steps and allowing academics to focus on the technical details. Additionally, we are excited for the future prospects of this product - its scope for use in all areas of research is enormous as is the positive impact it can have on projects worldwide.
What's next for Citr.us
We are looking to develop our desktop app to be more customizable! Additional visual features such as a vertical axis and allowing for different colour schemes would give more agency to the user.
The PDF reader could be made more intelligent, perhaps through a Machine Learning solution. This would allow the user to generate deep dives into connections between publications whilst increasing reliability when extracting information such as the title.
An automatic search for commonly cited papers in between the input pdf’s, again allowing the user to easily delve deeper and aid their research.
Incorporation of a dedicated graphics engine before exporting a final figure would improve the users interaction with the space. This would include popups in the figure, the ability to highlight citations, follow particular authors etc.
References
[1] Battiston, Federico, et al. "Taking census of physics." Nature Reviews Physics 1.1 (2019): 89-97.
Built With
- pdfscraper
- pygraphviz
- python
- svgdraw
- ui


Log in or sign up for Devpost to join the conversation.