-
-
CineWatch
Inspiration
What it does
How we built it
Challenges we ran into
Accomplishments that we're proud of
What we learned
What's next for CinePulse
Real-Time Multi-Agent Film Set Monitoring System What Inspired Me Film production depends on precise coordination between people, schedules, equipment, and budgets. A small delay on set can quickly create overtime costs, increase equipment rentals, affect catering plans, and disrupt the entire shooting schedule. However, many production teams still rely on manually reviewed call sheets, voice notes, expense receipts, and end-of-day reports. I was inspired to build a system that could identify these problems while they were happening instead of reporting them days later. The goal was to give line producers and crew leads a real-time operational assistant that could answer questions such as: Is the production moving according to schedule? Which scene is currently delayed? Are overtime or rental costs increasing unexpectedly? Which department needs to take action? What is the most practical solution right now? This led to the idea of a real-time multi-agent monitoring system that combines AI-powered data extraction, budget analysis, scheduling intelligence, and targeted alerts. What I Learned This project helped me understand that building an AI system for real-world operations involves much more than connecting a language model to a user interface.
- Unstructured data needs structure Film-set data is created in many forms: Voice notes from assistant directors and crew members. Call sheets containing scenes, locations, actors, and timings. Expense records for catering, equipment, transport, and overtime. Informal progress logs describing delays or changes. Before agents could reason over this information, I needed to convert it into structured events such as: { "scene_id": "Scene 24", "status": "delayed", "delay_minutes": 35, "department": "camera", "reason": "equipment setup", "timestamp": "10:45" }
The project taught me that the quality of downstream analysis depends heavily on the reliability of this extraction layer.
- Contextual alerts are more useful than generic alerts A warning such as “The schedule is delayed” is not very actionable. A better alert includes the cause, impact, owner, and recommended response: Scene 24 is 35 minutes behind schedule because of camera setup. If the delay continues, projected overtime may increase by ₹18,000. Camera and assistant direction should prioritize setup or move to the next prepared shot. This made me think of alert quality as a combination of context and actionability: "Alert Value"="Context"+"Impact"+"Owner"+"Recommended Action"
- Real-time systems require event-driven thinking The system could not wait for a final daily report. Every new voice note, expense, or call-sheet update needed to be treated as an event that might change the production state. For example: [ Updated State Previous State + New Event Corrections ] This event-based approach helped the system continuously recalculate schedule progress, cost projections, and risk levels.
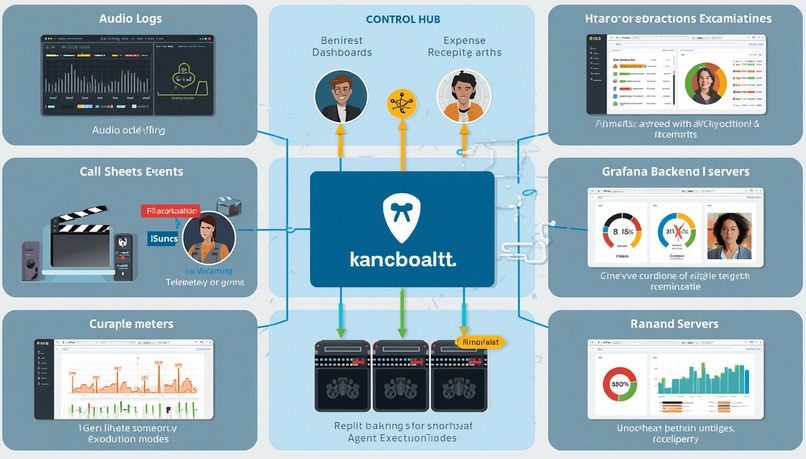
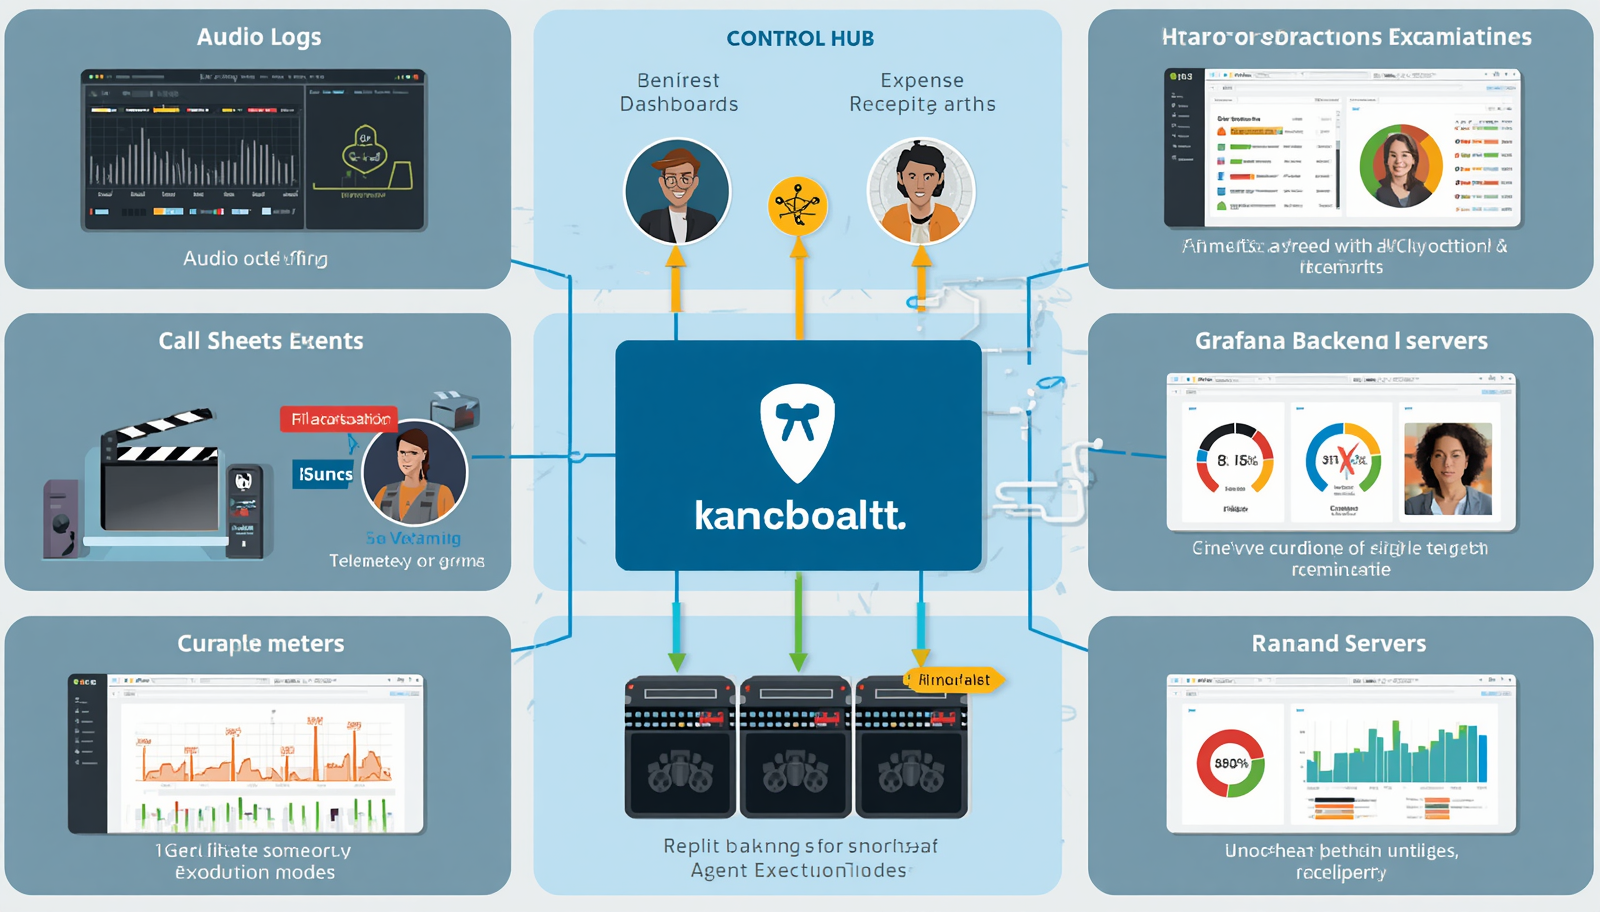
- Multi-agent systems need clearly defined responsibilities Instead of using one general-purpose agent for every task, I separated the workflow into specialized agents. This improved reliability because each agent had a focused responsibility and a well-defined output format. How I Built the Project The system was designed as a pipeline of specialized agents connected to a shared production state. High-Level Architecture Audio Logs ───────┐ │ Call Sheets ──────┼──> Ingestion Layer ──> Specialized AI Agents │ Expenses ────────┘ │ ▼ Event and State Store │ ┌─────────────────────┼─────────────────────┐ ▼ ▼ ▼ Risk Analysis Budget Tracking Alert Engine │ │ │ └─────────────────────┼─────────────────────┘ ▼ Grafana Telemetry │ ▼ Crew Dashboards
The backend agents were executed through Replit, while Grafana provided live telemetry dashboards for producers and department heads.
- Data ingestion The first layer collected information from different production sources: Audio logs and voice notes. Daily call sheets. Expense entries and receipts. Scene progress updates. Overtime and equipment records. Because these sources were inconsistent, I normalized them into common event types, for example: { "event_type": "expense_created", "department": "lighting", "category": "equipment_rental", "amount": 25000, "timestamp": "2026-08-08T10:30:00" }
Other events included scene_started, scene_completed, delay_reported, and overtime_recorded.
Audio and log parsing agent The audio-processing agent converted voice notes into structured production updates. It identified: Scene numbers. Current activity. Delays and their causes. Mentioned departments. People responsible for follow-up actions. Changes to the shooting plan. For example, a voice note such as: “We are still waiting for the lighting setup on Scene 18, and the actors will be unavailable after lunch.” could be transformed into: { "scene_id": "Scene 18", "issue": "lighting_setup_delay", "actor_availability_risk": true, "priority": "high", "recommended_action": "prioritize Scene 18 before lunch" }
Schedule monitoring agent The schedule agent compared actual shooting progress with the planned call sheet. It monitored: Planned scene start time. Actual scene start time. Expected scene duration. Actual scene duration. Remaining scenes. Available shooting time. A basic schedule variance calculation was: [ Schedule Variance Actual Elapsed Time Planned Elapsed Time ] If the variance crossed a configured threshold, the system classified the delay as low, medium, or high risk.
Budget tracking agent The budget agent monitored expenses and compared current spending with expected production costs. It focused on categories such as: Overtime. Equipment rentals. Catering. Transportation. Additional crew requirements. The projected cost was estimated using the current spending rate: [ Projected Cost Current Cost + Expected Remaining Cost ] The system flagged unusual increases, such as a sudden equipment rental spike or repeated overtime entries from the same department.
Risk analysis agent The risk agent combined schedule and budget signals. A delay alone might be manageable, but a delay combined with actor unavailability and rising overtime could become critical. A simplified risk score could be represented as: R=w_s S+w_b B+w_a A+w_d D Where: S represents schedule deviation. B represents budget pressure. A represents actor or resource availability risk. D represents department dependency risk. w_s,w_b,w_a, and w_d are configurable weights. The final score was used to determine whether the event should be shown as an informational update, warning, or urgent alert.
Autonomous alert routing The alert engine avoided broadcasting every warning to everyone. Instead, it routed alerts based on department ownership and severity. Examples included: Camera setup delays routed to the camera department and assistant director. Catering overspending routed to production management. Actor availability risks routed to assistant direction and the production coordinator. Equipment cost spikes routed to the line producer. Each alert included the event, business impact, responsible team, and suggested action.
Grafana dashboards Grafana was used to display the system’s live operational state. Important dashboard metrics included: Scenes completed versus scenes planned. Current schedule variance. Average scene duration. Overtime accumulated. Spending by category. Budget consumption percentage. Active production risks. Number of unresolved alerts. For example, budget utilization could be monitored as: [ Budget Utilization \frac{Actual Spending}{Allocated Budget} \times 100 ] This gave producers a visual way to understand whether production was progressing normally or approaching a potential cost overrun.
Replit backend execution Replit was used to develop and run the backend agent services quickly. It allowed me to iterate on: Agent prompts and workflows. Event-processing logic. API endpoints. Data transformation functions. Alert-routing rules. Dashboard data generation. The backend exposed the processed production information in a format that Grafana could consume for live monitoring. Challenges I Faced
Handling messy and incomplete data Audio logs were not always clear. Speakers could use abbreviations, omit scene numbers, or describe problems informally. Expenses could also be missing categories or contain inconsistent descriptions. To address this, I added validation and normalization steps. The system assigned confidence levels to extracted information and avoided generating high-priority alerts when critical fields were uncertain.
Avoiding false alarms A production environment changes constantly. A short delay does not necessarily mean that the schedule is at risk. If the system produced too many warnings, crew members would start ignoring them. I addressed this by introducing: Severity thresholds. Duplicate-alert suppression. Cooldown periods. Confidence checks. Correlation between multiple events. Escalation only when a problem remained unresolved. For example, one delayed update might create a warning, but repeated delays combined with rising overtime would trigger an urgent escalation.
Connecting technical events to business impact It was not enough to detect that a scene was late. The system needed to estimate what that delay meant operationally. A delay could affect: Overtime expenses. Actor availability. Equipment bookings. Catering schedules. Location permits. Scenes planned later in the day. This required combining information from multiple agents rather than analyzing each event independently.
Maintaining consistent agent outputs Different AI agents could produce slightly different formats for similar inputs. That made it difficult for downstream services to process their responses reliably. I solved this by enforcing structured schemas for agent outputs. Each agent had to return predictable fields such as: { "status": "success", "confidence": 0.91, "events": [], "risks": [], "recommended_actions": [] }
This made the system easier to validate, debug, and connect to Grafana.
- Managing real-time updates The dashboard needed to reflect new events without becoming unstable or overwhelming the user. I had to carefully manage refresh intervals, event timestamps, duplicate records, and updates to existing production states. This taught me that real-time monitoring is not simply about processing data quickly. It is also about maintaining a consistent and understandable view of the current state.
- Balancing autonomy with human control The system could recommend actions and route alerts, but production decisions still required human judgment. An agent might identify a schedule risk, but a line producer may know about a negotiation, backup location, or creative decision that is not present in the data. Therefore, I designed the system as a decision-support tool rather than a fully independent replacement for production staff. It highlights risks and suggests responses while keeping final decisions with the responsible people. Final Outcome The project brought together AI agents, event-driven processing, budget analytics, and real-time observability into one production-monitoring system. Instead of waiting for end-of-day reports, line producers and crew leads could see emerging bottlenecks and cost risks as they developed. The most important lesson was that successful AI automation depends on the complete workflow: [ Useful Automation Reliable Data + Specialized Reasoning + Real-Time Monitoring + Actionable Communication ] By combining Replit for backend agent execution with Grafana for live telemetry, the system transformed scattered production information into timely, department-specific insights that could help prevent small problems from becoming expensive setbacks.
Built With
- api-servers
- apis
- ci/cd
- data-processing-python-(agents
- fastapi-(python-apis)
- gin-or-echo-(go-services)
- github-actions-/-gitlab-ci
- go-(high-throughput-ingestion)
- grafana-cloud-or-self-hosted-grafana-+-prometheus-cloud-services-compute
- ml)
- monitoring-replit-(agent-hosting-via-replit-deployments-or-replit-mcp)
- recommended-tech-stack-layer-purpose-recommended-technologies-languages-core-agent-logic
- socket.io-or-websockets-(real-time-updates)-platforms-execution
- storage
- streaming-langgraph-or-crewai-(multi-agent-workflows)
- typescript/node.js-(replit-backend
- webhooks)-frameworks-agent-orchestration

Log in or sign up for Devpost to join the conversation.