-

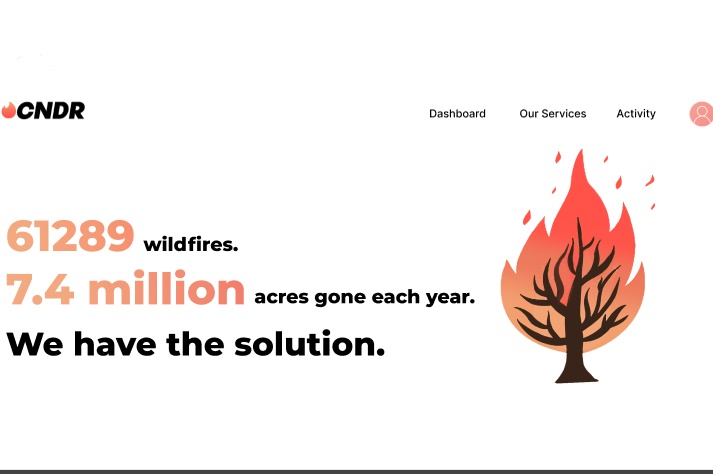
Home Page
-
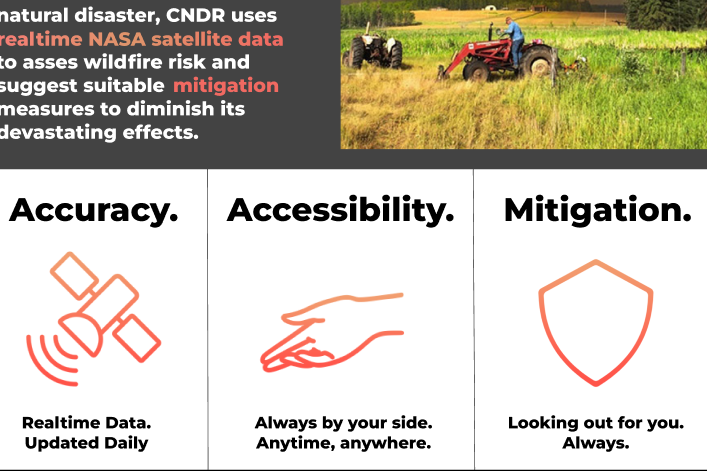
Who are we?
-

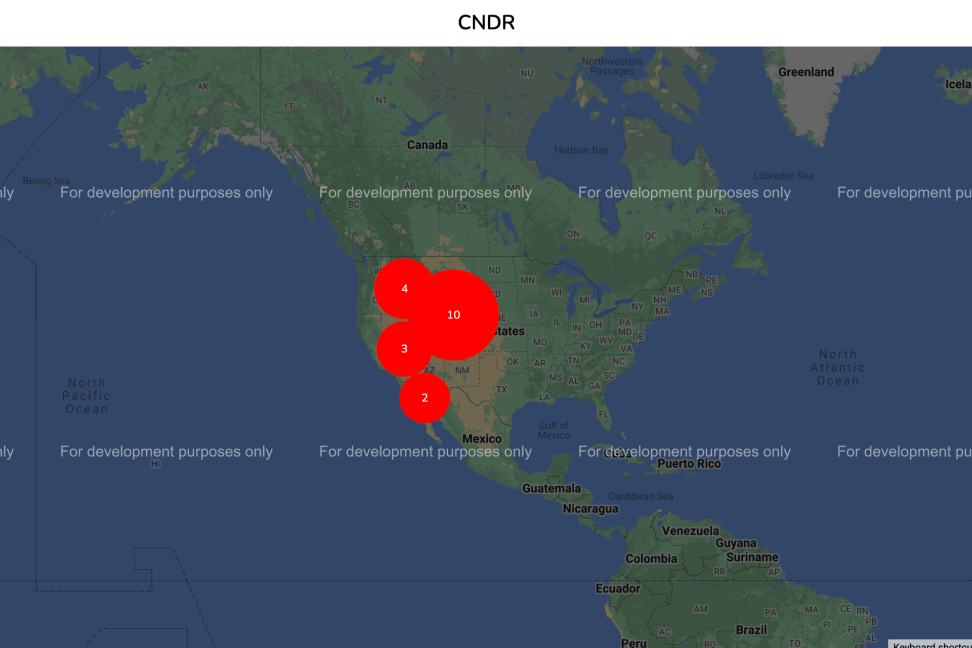
Map
-
Info-graphic
-
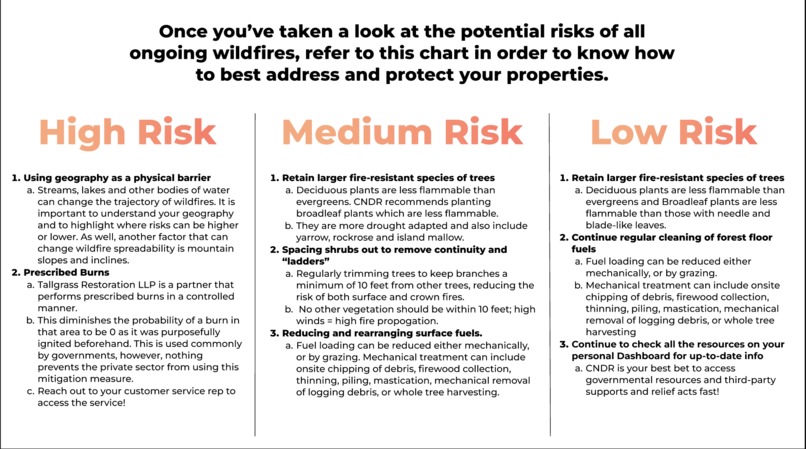
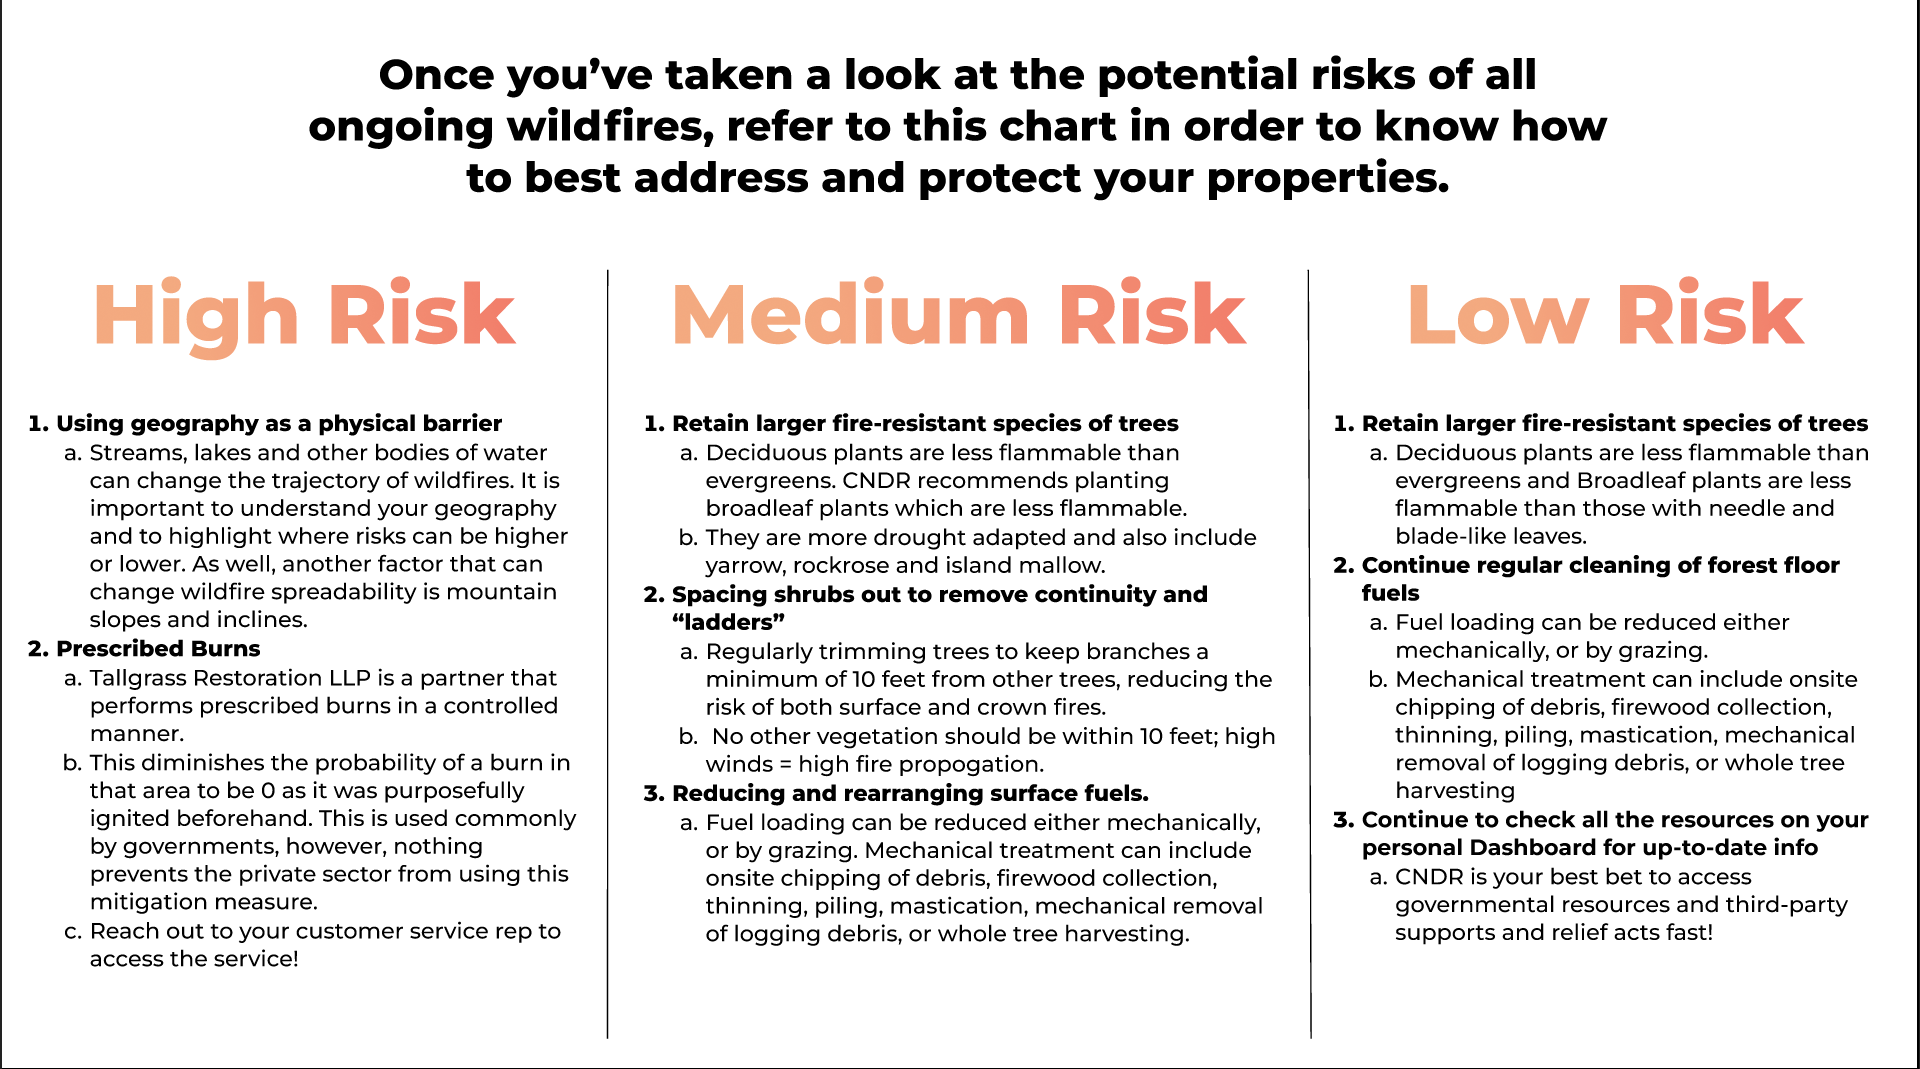
Mitigation Methods
-
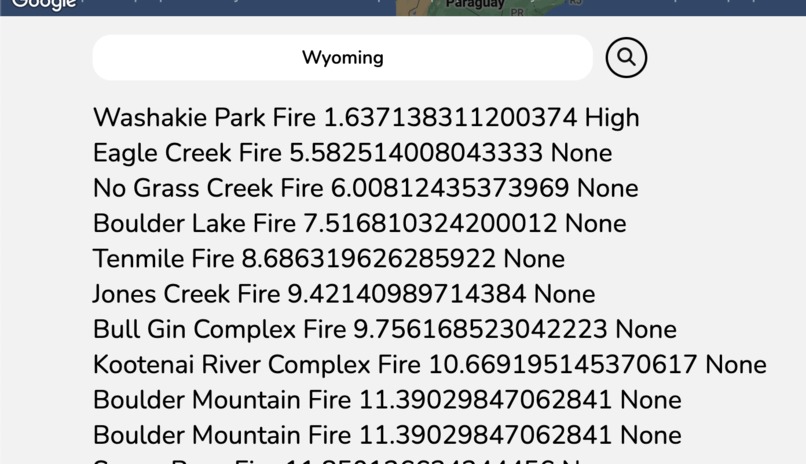
Search Feature


Inspiration
Wildfires around the world have destroyed billions of square feet of forestry and fertile land, causing irreversible environmental and economic damage. While there exists a plethora of government agencies in Canada and around the world that track and manage wildfires for public property, relevant data and mitigation strategies continue to remain inaccessible to the agricultural and lumber sectors.
We thought to ourselves, there has to be a better way. How can we connect the private and public sectors? How can we make relevant information as openly accessible as possible? And most importantly, how can we make a tangible impact through tech?
Ever since a young age, we have all been passionate about fighting climate change in our own ways. Our group has especially been fascinated with leveraging tech to solve tomorrow’s problems. With bushfires in Australia and recent wildfires in BC, counteracting the impact on real people is needed now more than ever. As proactive high school students, it is now our responsibility to help shape the world we wish to inherit. We cannot sit idle while entire ecosystems are getting wiped out and hardworking lumber and agriculture workers are unable to put food on the table. Introducing CNDR.
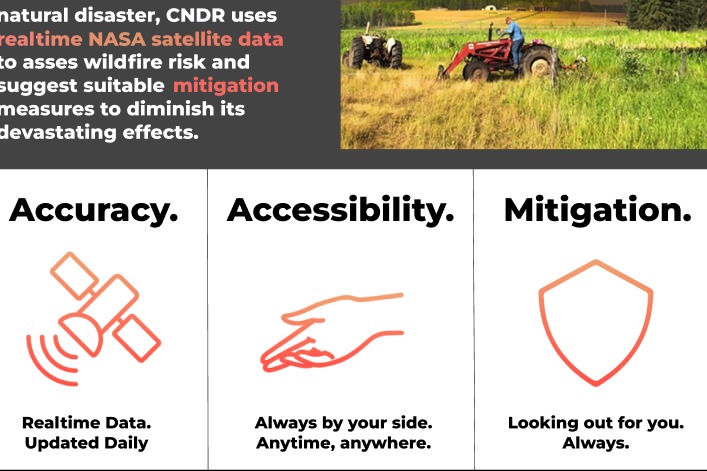
What it does
CNDR uses satellite data from NASA through their EONET (Earth Observatory Natural Event Tracker) API to (1) display the risk level of their land, (2) tailor mitigative measures for landowners to protect their livelihoods and (3) connect clients with wildfire relief initiatives and support systems. With a clean UI/UX, we’re able to display relevant information to the user, hoping to improve ecosystems and safeguard businesses.
How we built it
In order to enhance the backend and UX, CNDR uses React, Figma (incl. CSS). We imported 3 APIs into our program. NASA’s EONET API is in charge of determining where wildfires are. The data is displayed using the Google Maps API. Statistics as well as longitude latitude calculations necessary to determine the wildfire risk radii are done mainly on OpenWeatherAPI.
Challenges we ran into
As high school first-time hackers with 0 knowledge of React and Figma, a lot of the format was foreign to us and the distinct documentation of all 3 APIs made it harder to create a fluid experience where data is seamlessly shared between all 3 APIs to calculate the varying threats of wildfires based on location data. This was especially pronounced in our calculations to determine how much of a threat a wildfire is.
Accomplishments that we're proud of
As a group, we are extremely proud of what we were able to create in such a small amount of time given our previous experience, which was next to nothing. In only 36 hours we were able to adapt and learn new languages, create visually pleasing and efficient UX/UI, and most importantly merge our passions for environmental activism and tech. Whether we win or not, looking at where we started and where we ended, we could not be prouder of the difference our project can make and the experiences made along the way.
What we learned
(1) The short and long-term effects of high caffeine and low sleep. (2) Splitting obligations and playing to strengths (3) Machine Learning & Pitching (HTN Workshops) And much more…
What's next for CNDR
Floods. (And calling it SWMP)
Built With
- figma
- google-maps
- html
- javascript
- nasa-eonet-api
- node.js
- openweathermap
- react


Log in or sign up for Devpost to join the conversation.