Inspiration
We were inspired by the Tactical Computing Lab's challenge: create a file system observability tool for network administrators building clusters of Apple devices.
Managing one Mac's storage is straightforward. Understanding storage across a cluster is much harder. We wanted to bring capacity, performance, and health observations into one place so administrators can investigate problems before they disrupt their work.
What it does
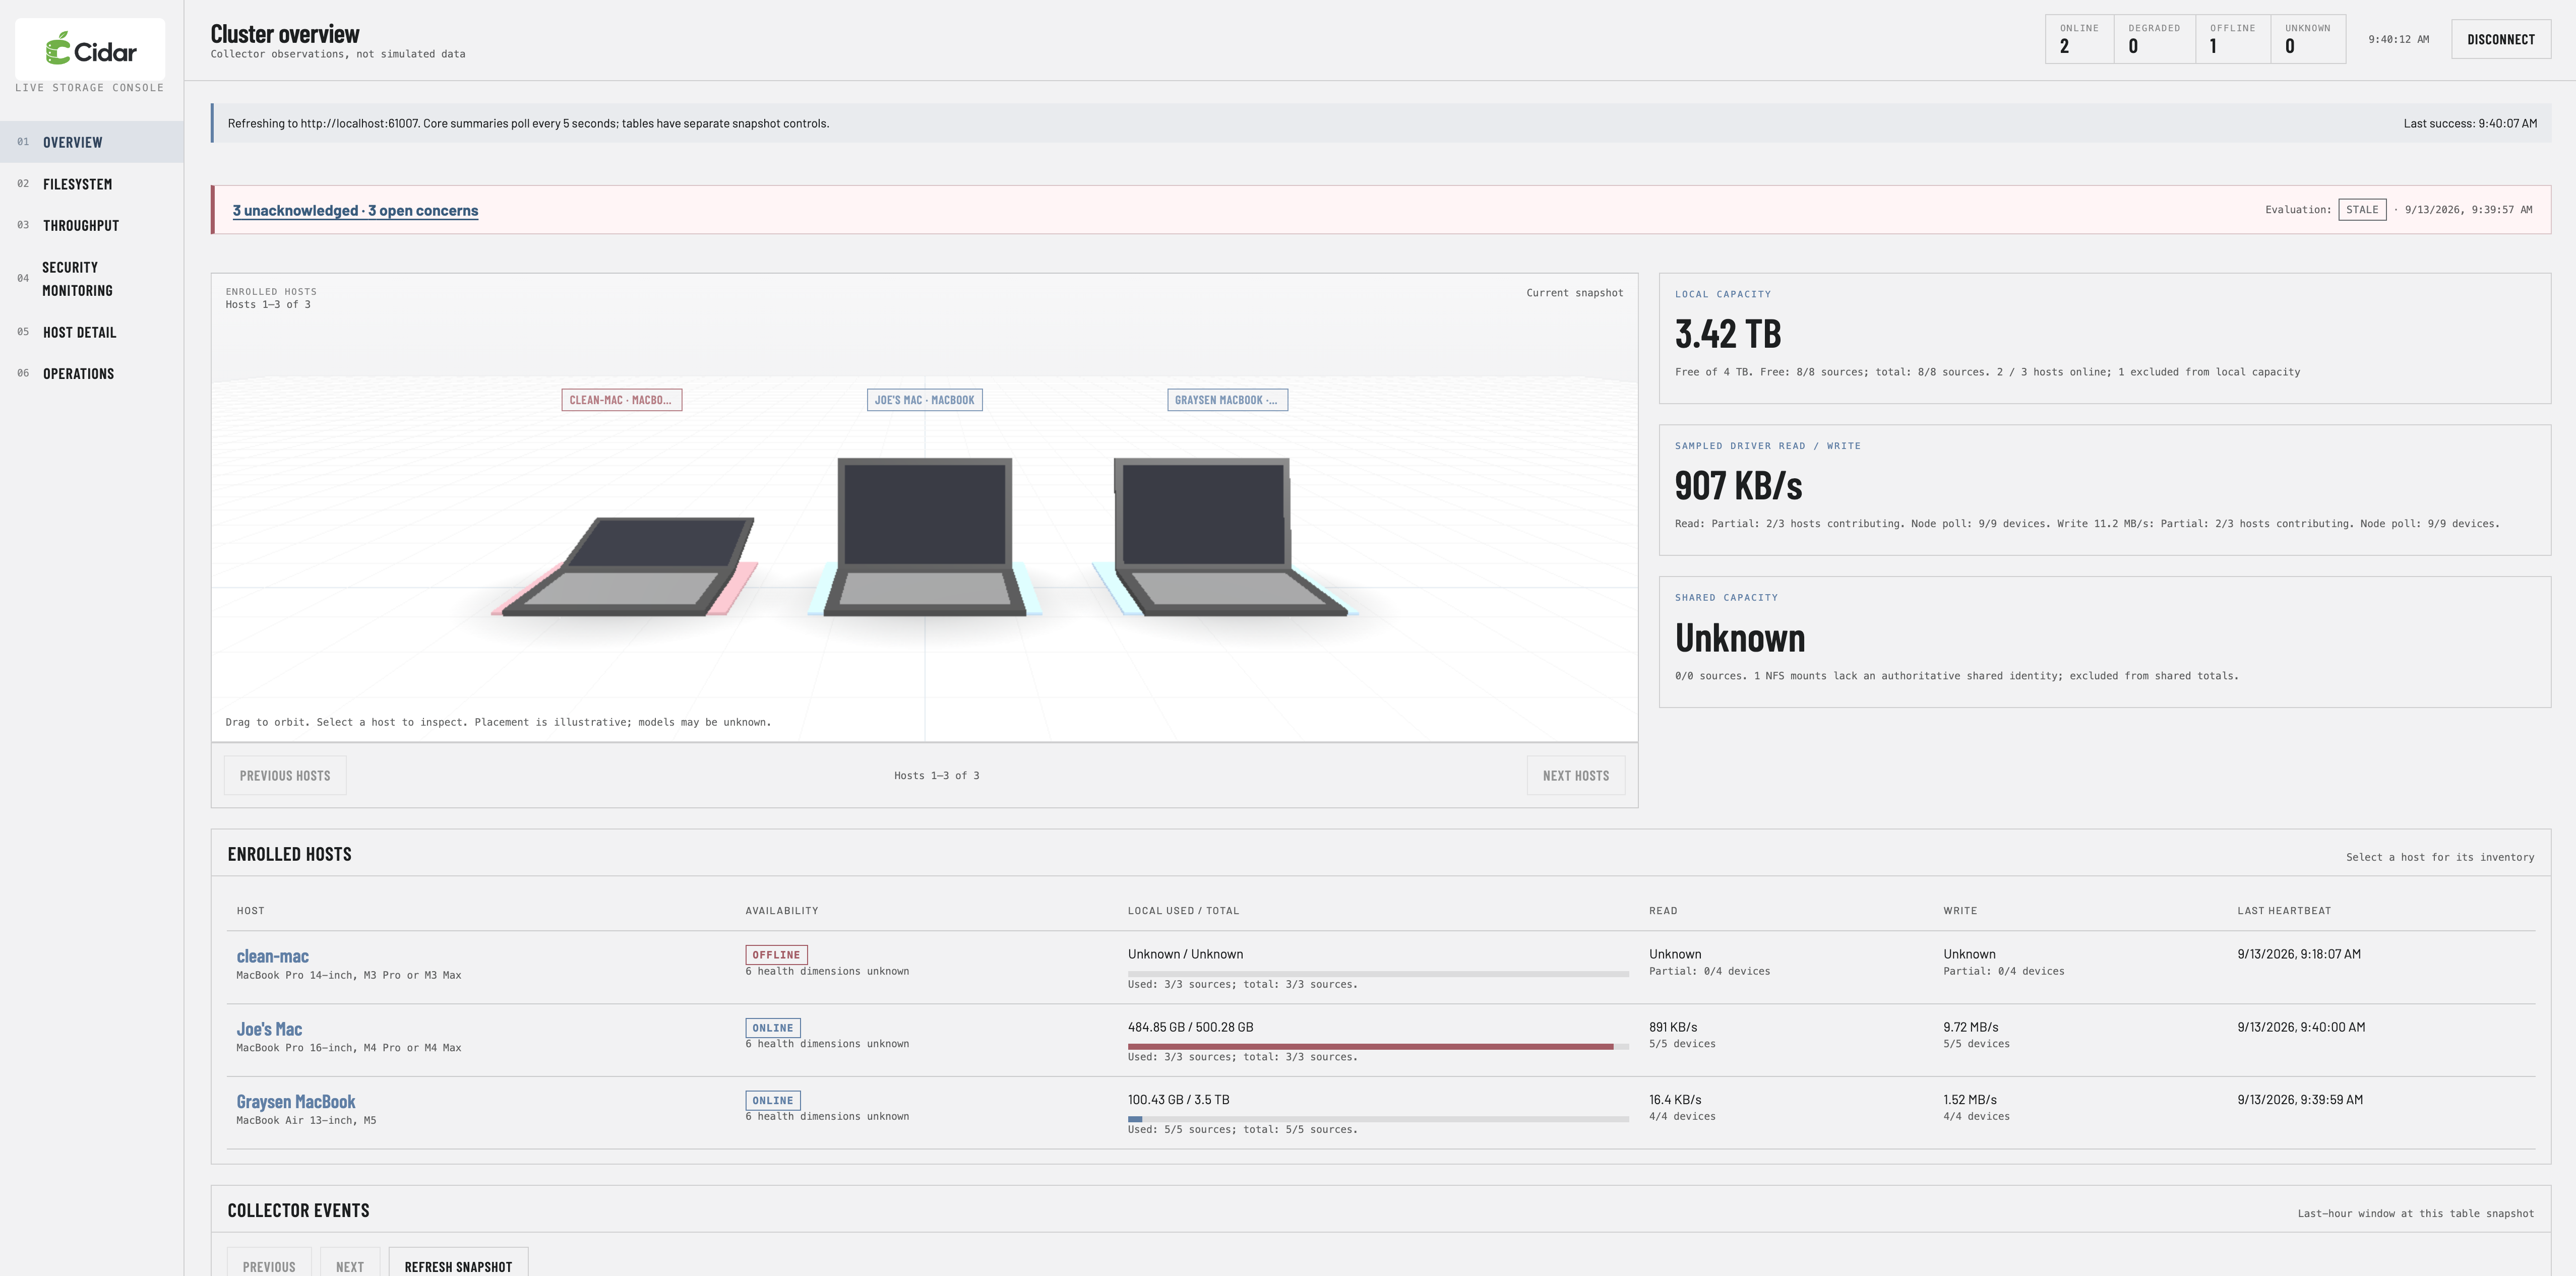
Cidar provides a centralized view of storage across connected Macs.
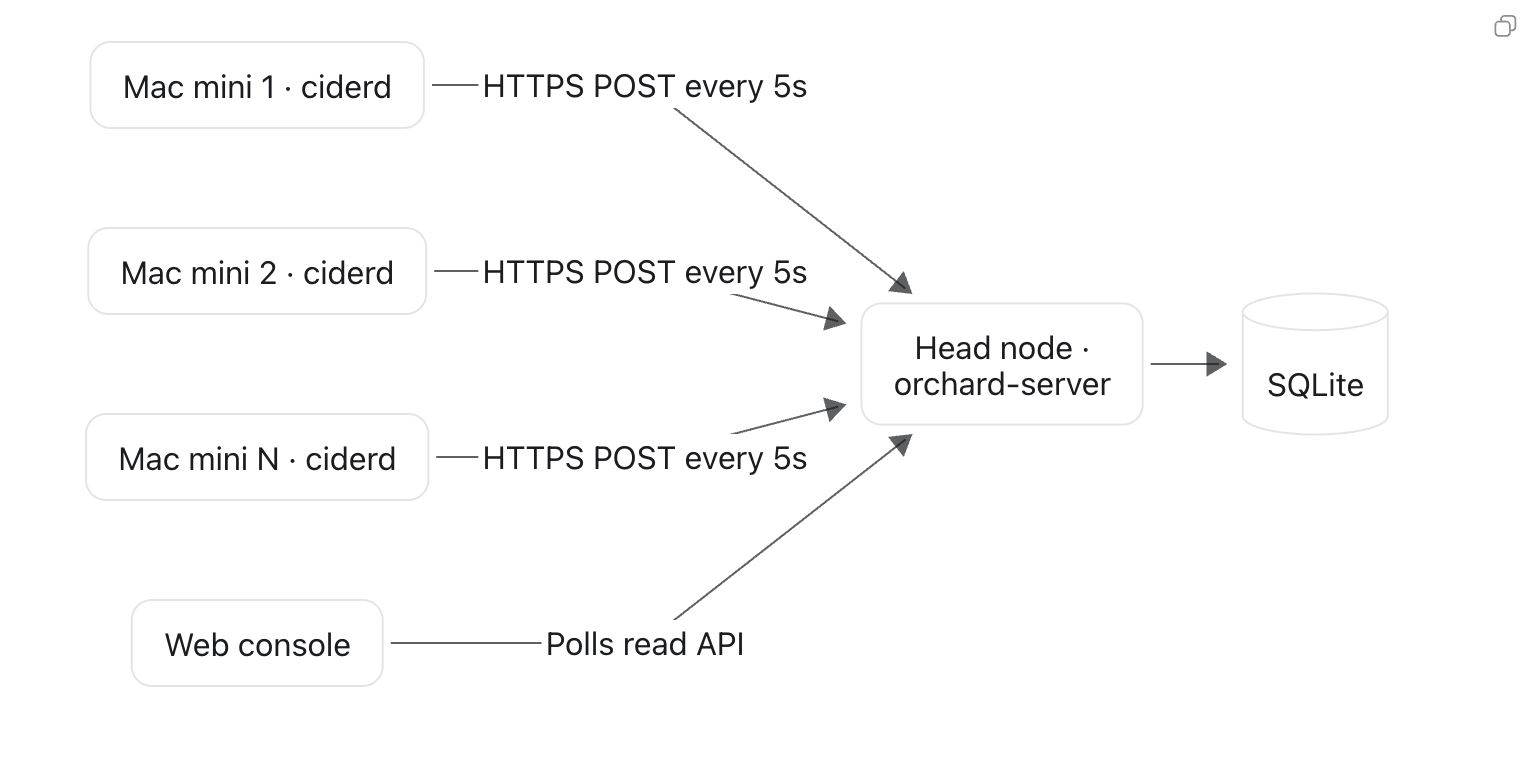
A lightweight daemon on each device collects telemetry and sends heartbeats every five seconds. Administrators can explore devices, inspect disks and file systems, review historical measurements, and investigate storage activity and reliability findings through a web dashboard.
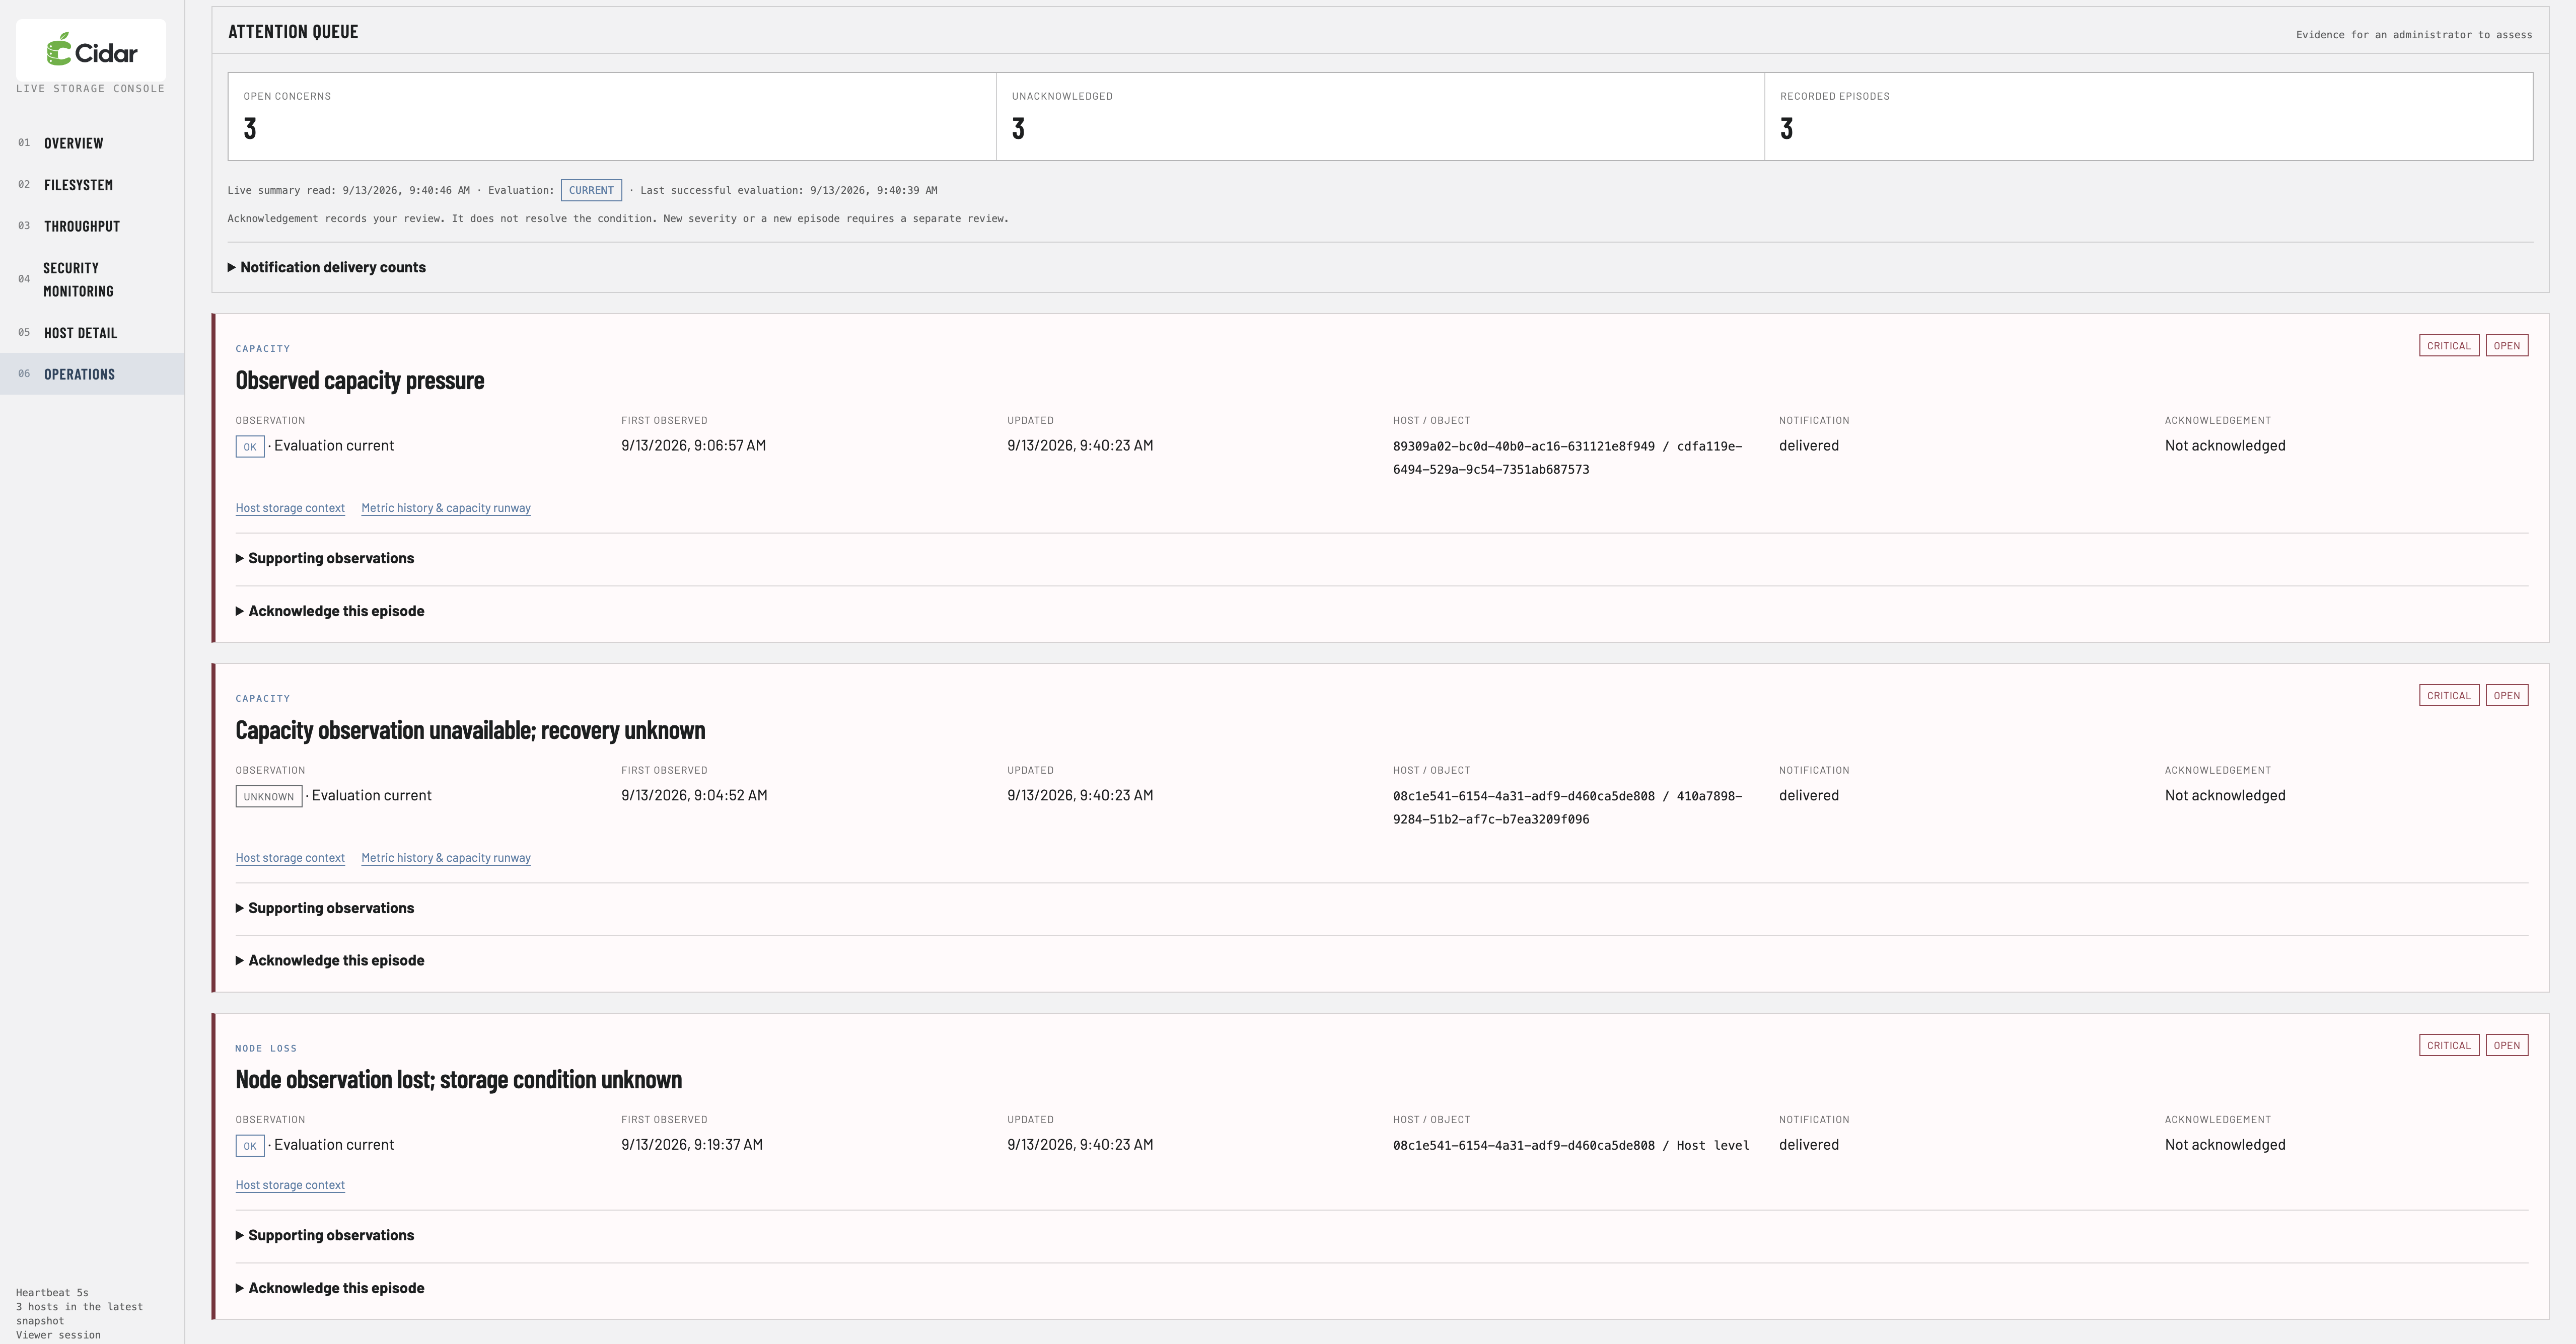
The system tracks capacity pressure and lost connections, supports NFS observations and configured user quotas, and exposes authenticated APIs for other applications. An attention queue helps administrators review and acknowledge concerns, while Twilio SMS notifications bring important alerts beyond the dashboard.
Unavailable data is explicitly marked unknown rather than presented as healthy.
How we built it
We built the collector and central server in Rust. The collector, ciderd, gathers macOS storage observations and sends them to the server over authenticated HTTPS.
The central server stores telemetry in SQLite, evaluates incoming observations, and exposes APIs for the web dashboard. A native macOS application provides server controls, enrollment tokens, and viewer credentials.
We built the dashboard with JavaScript and integrated Twilio for SMS notifications. Each collector receives its own identity and credential during enrollment, while separate viewer credentials provide read-only dashboard access.
Challenges we ran into
One major challenge was interpreting storage correctly. Physical disks, APFS containers, volumes, and network mounts represent different layers, and simply adding their capacities together can double-count storage.
Another was distinguishing missing evidence from an actual fault. A disconnected collector does not prove a disk has failed, and an old measurement should not appear current just because the dashboard refreshed.
Connecting multiple Macs also exposed practical deployment challenges: LAN addresses, certificate trust, persistent device identities, and the difference between viewing a dashboard and enrolling a collector.
SMS integration required us to distinguish a message accepted by Twilio from one confirmed delivered.
Accomplishments that we're proud of
We built an end-to-end path from real macOS storage collection to a centralized dashboard and delivered SMS alerts.
We also created a shared API contract so the collector, server, and frontend could be developed together. The system preserves measurement provenance and freshness, supports persistent device identities, and gives administrators evidence to investigate rather than unsupported claims about hardware health.
What we learned
Observability is about more than collecting numbers. It requires understanding what those numbers represent, when they were measured, and how much confidence an administrator should place in them.
We learned how important enrollment, certificate management, and clear setup instructions are to a multi-device system. We also learned that reliable notifications need explicit delivery states and careful retry behavior.
What's next for Cidar
Our next priority is making deployment easier: streamlined collector installation, simpler certificate setup, and clearer device enrollment and lifecycle management.
We also want to refine alert policies, expand historical analysis, improve the dashboard's investigation workflows, and validate the system across more Macs and network storage configurations.
Our goal is to make Cidar a practical tool for administrators operating Apple device clusters, from initial setup through everyday monitoring.


Log in or sign up for Devpost to join the conversation.