Inspiration
What it does
How we built it
Challenges we ran into# RetainIQ — About the Project
Inspiration
Clinical trials are the backbone of modern medicine. Every approved drug, every treatment breakthrough, passed through years of rigorous human trials. Yet one of the most persistent and costly failures in this process isn't scientific — it's operational: patients drop out.
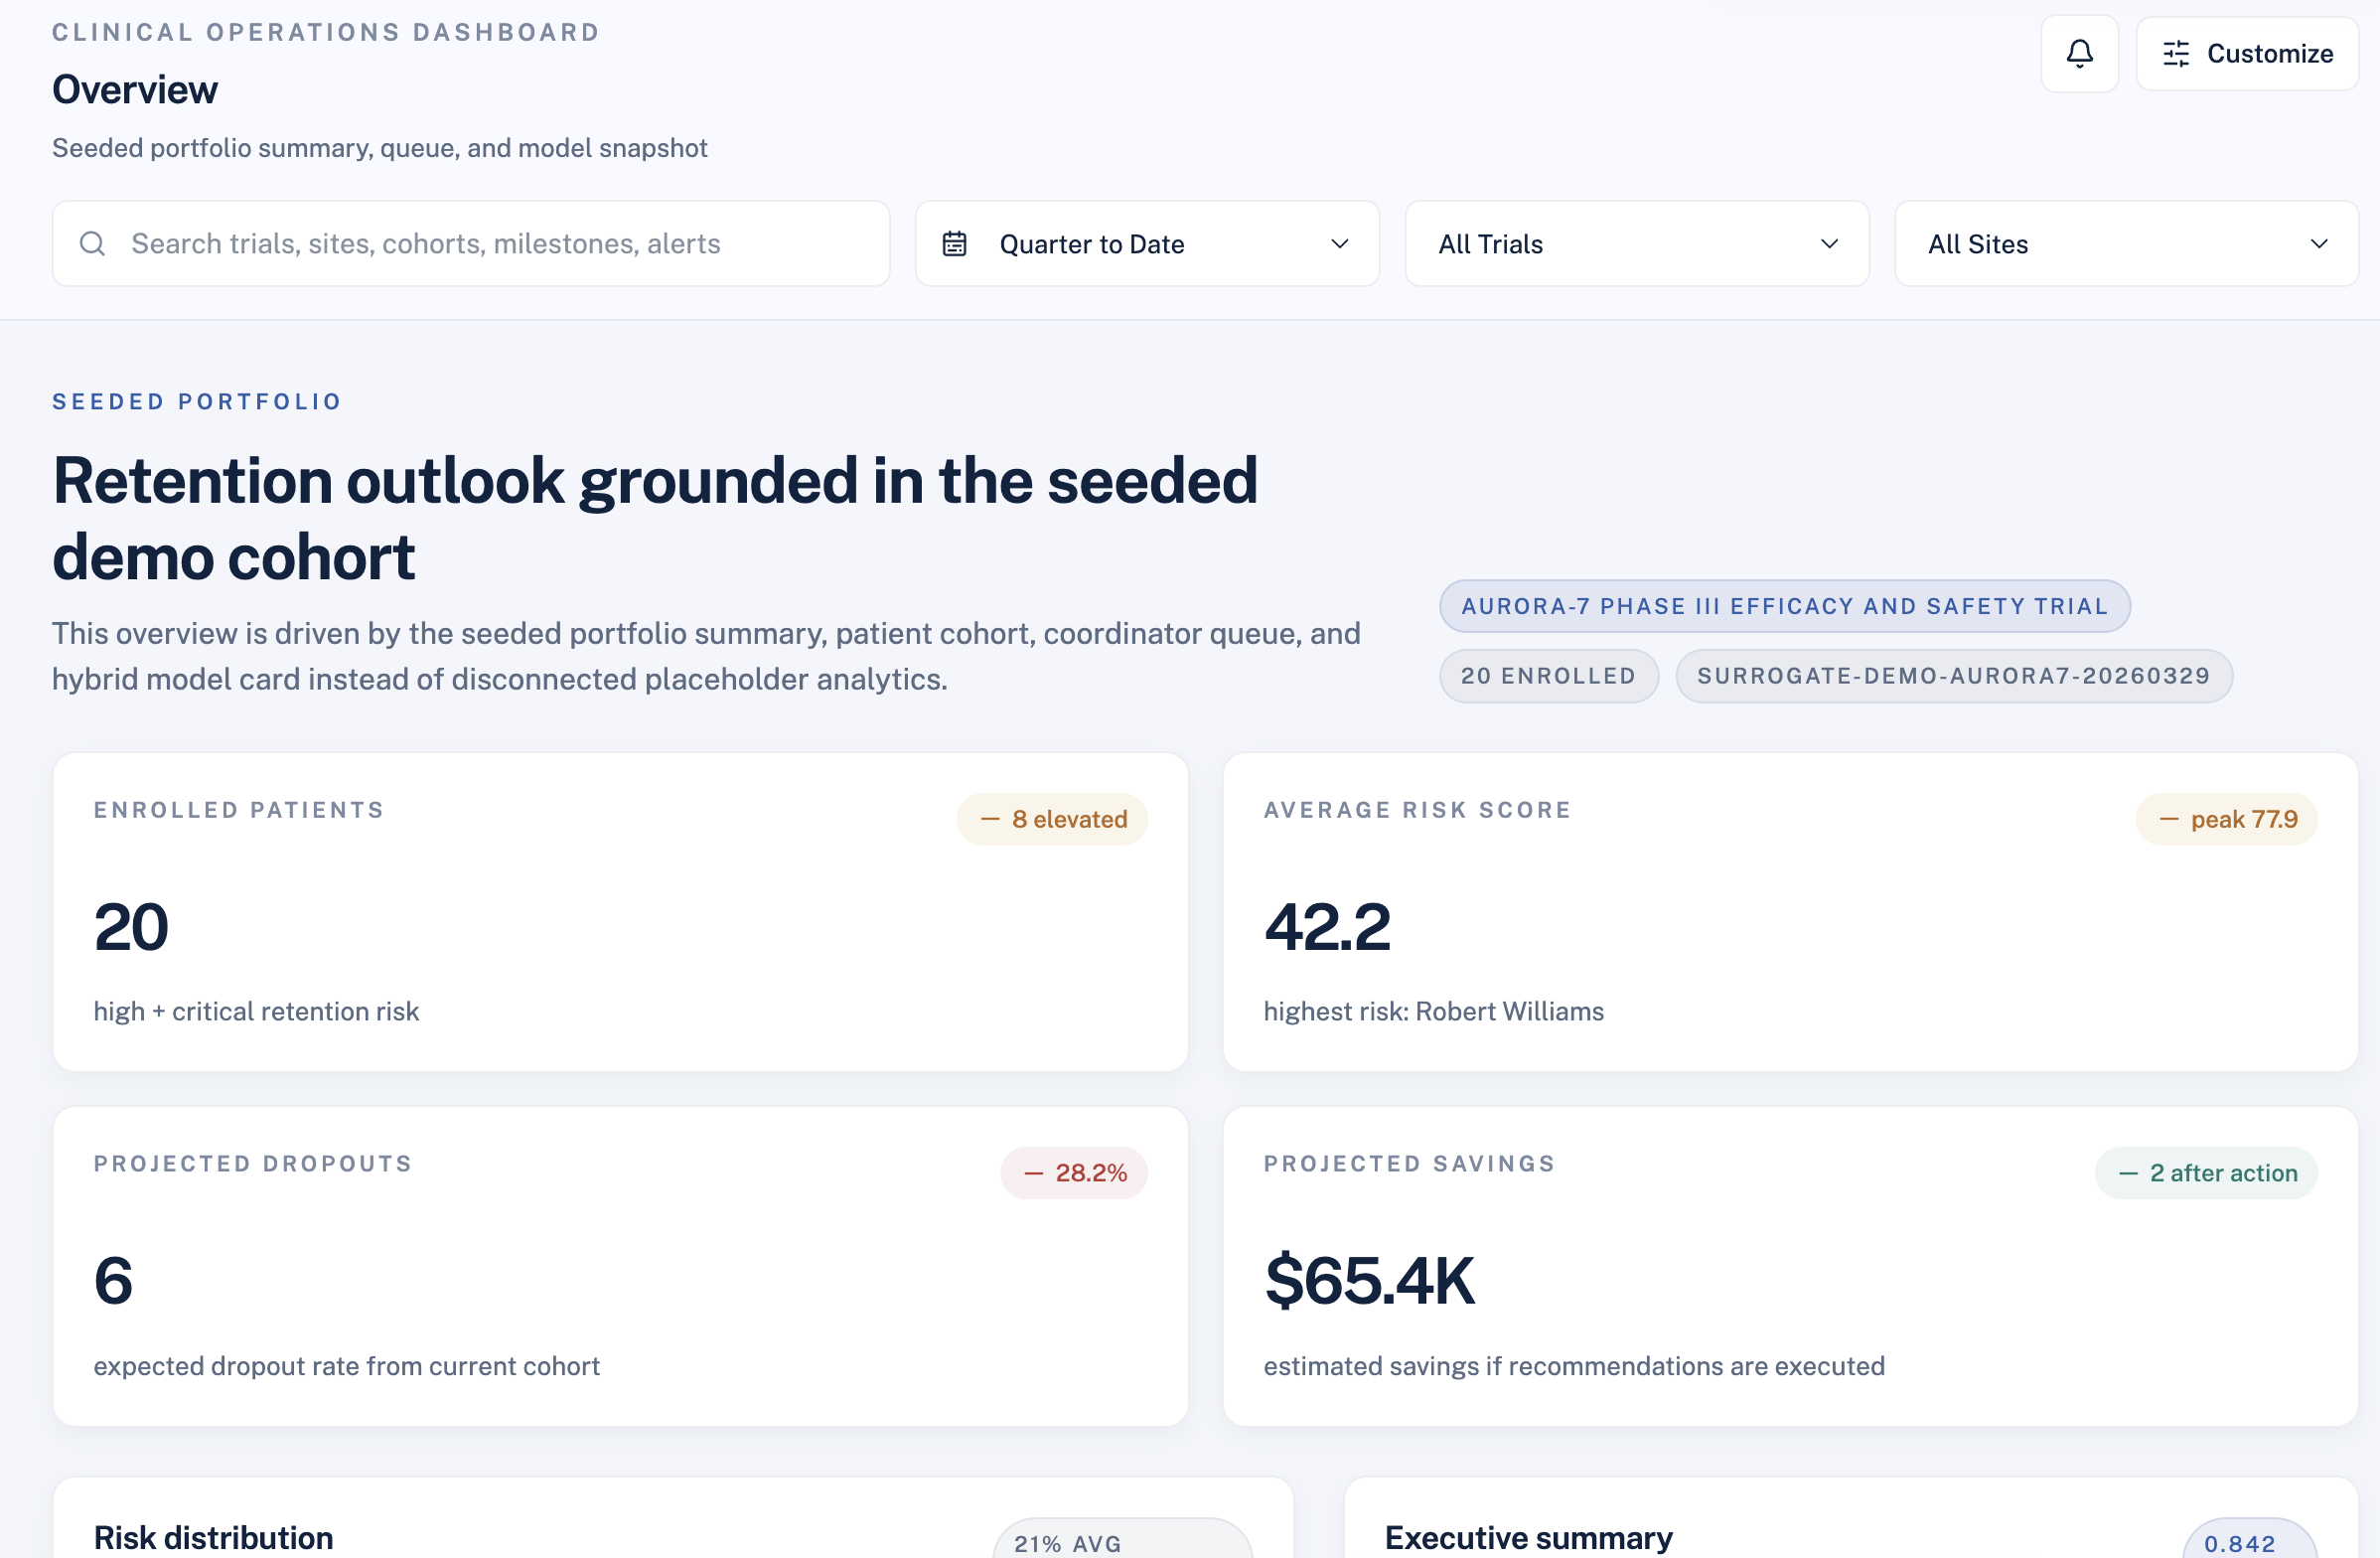
The numbers are stark. Industry-wide dropout rates average 30–40%, and a single lost participant in a Phase III trial can cost upwards of $60,000–$100,000 when accounting for lost data, potential re-recruitment, and extended timelines. More troubling: most of these dropouts are not random. They are predictable. A patient who commutes 45 miles, works an hourly job, and has already missed two visits is not a surprise — they are a signal that went unread.
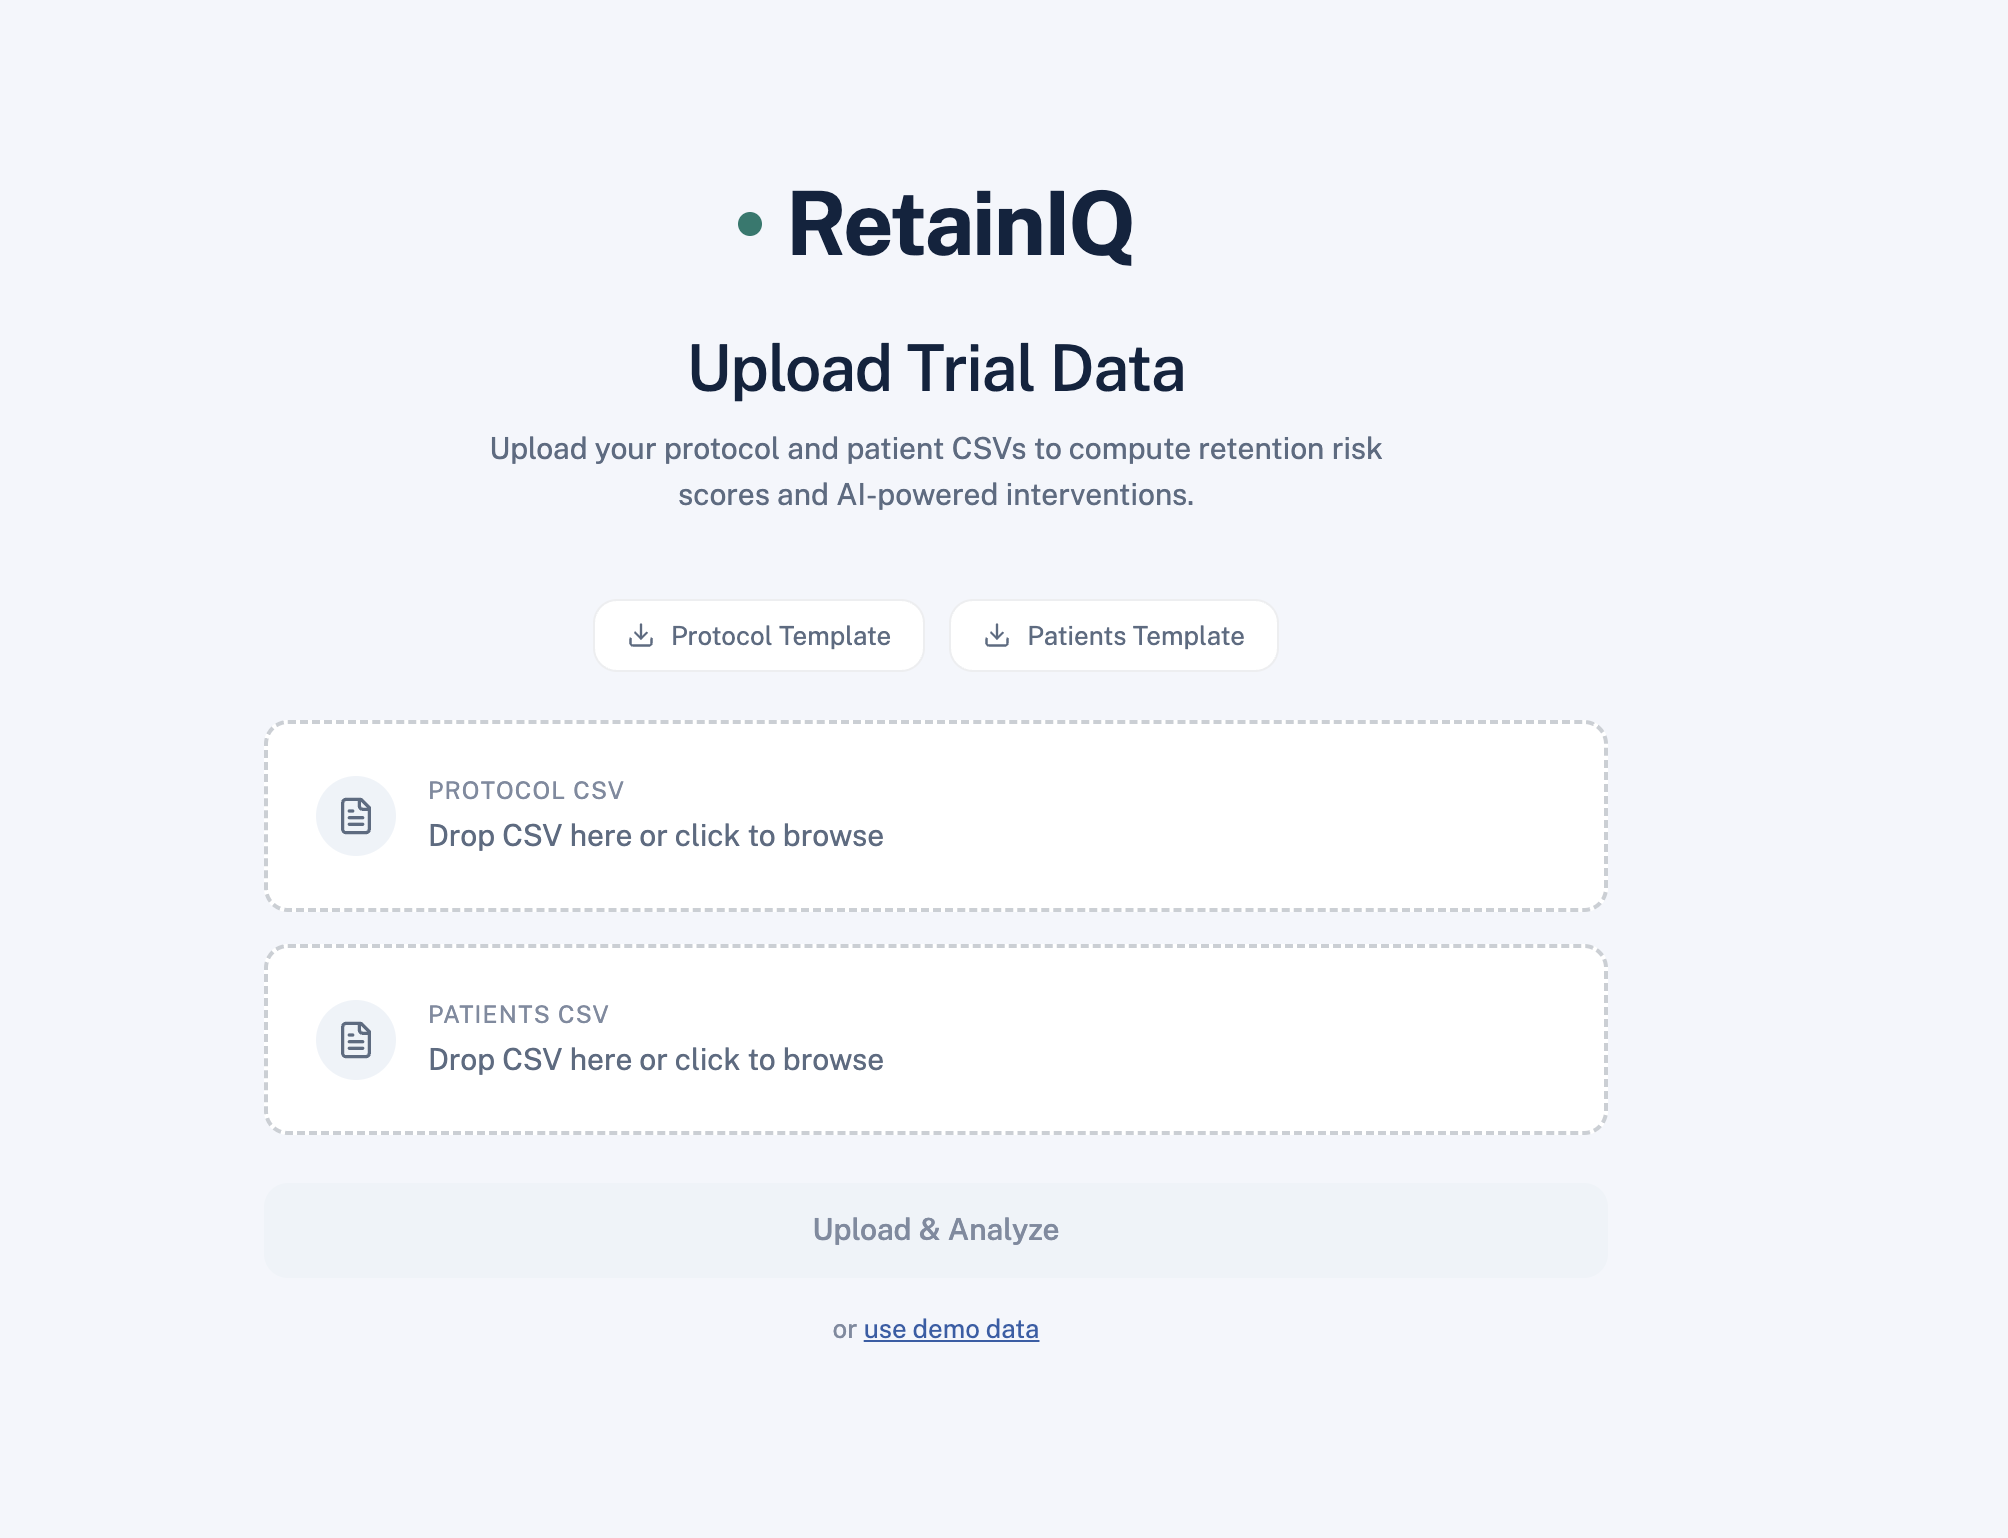
The inspiration for RetainIQ came from a simple observation: coordinators already know which patients are struggling, but they are overwhelmed. Managing 50+ enrolled participants manually, without systematic triage, means the loudest problems get attention and the quietest ones become dropouts. We wanted to build a tool that does the triage for them — and goes further, telling them not just who is at risk, but what to do about it and what that action is worth.
How We Built It
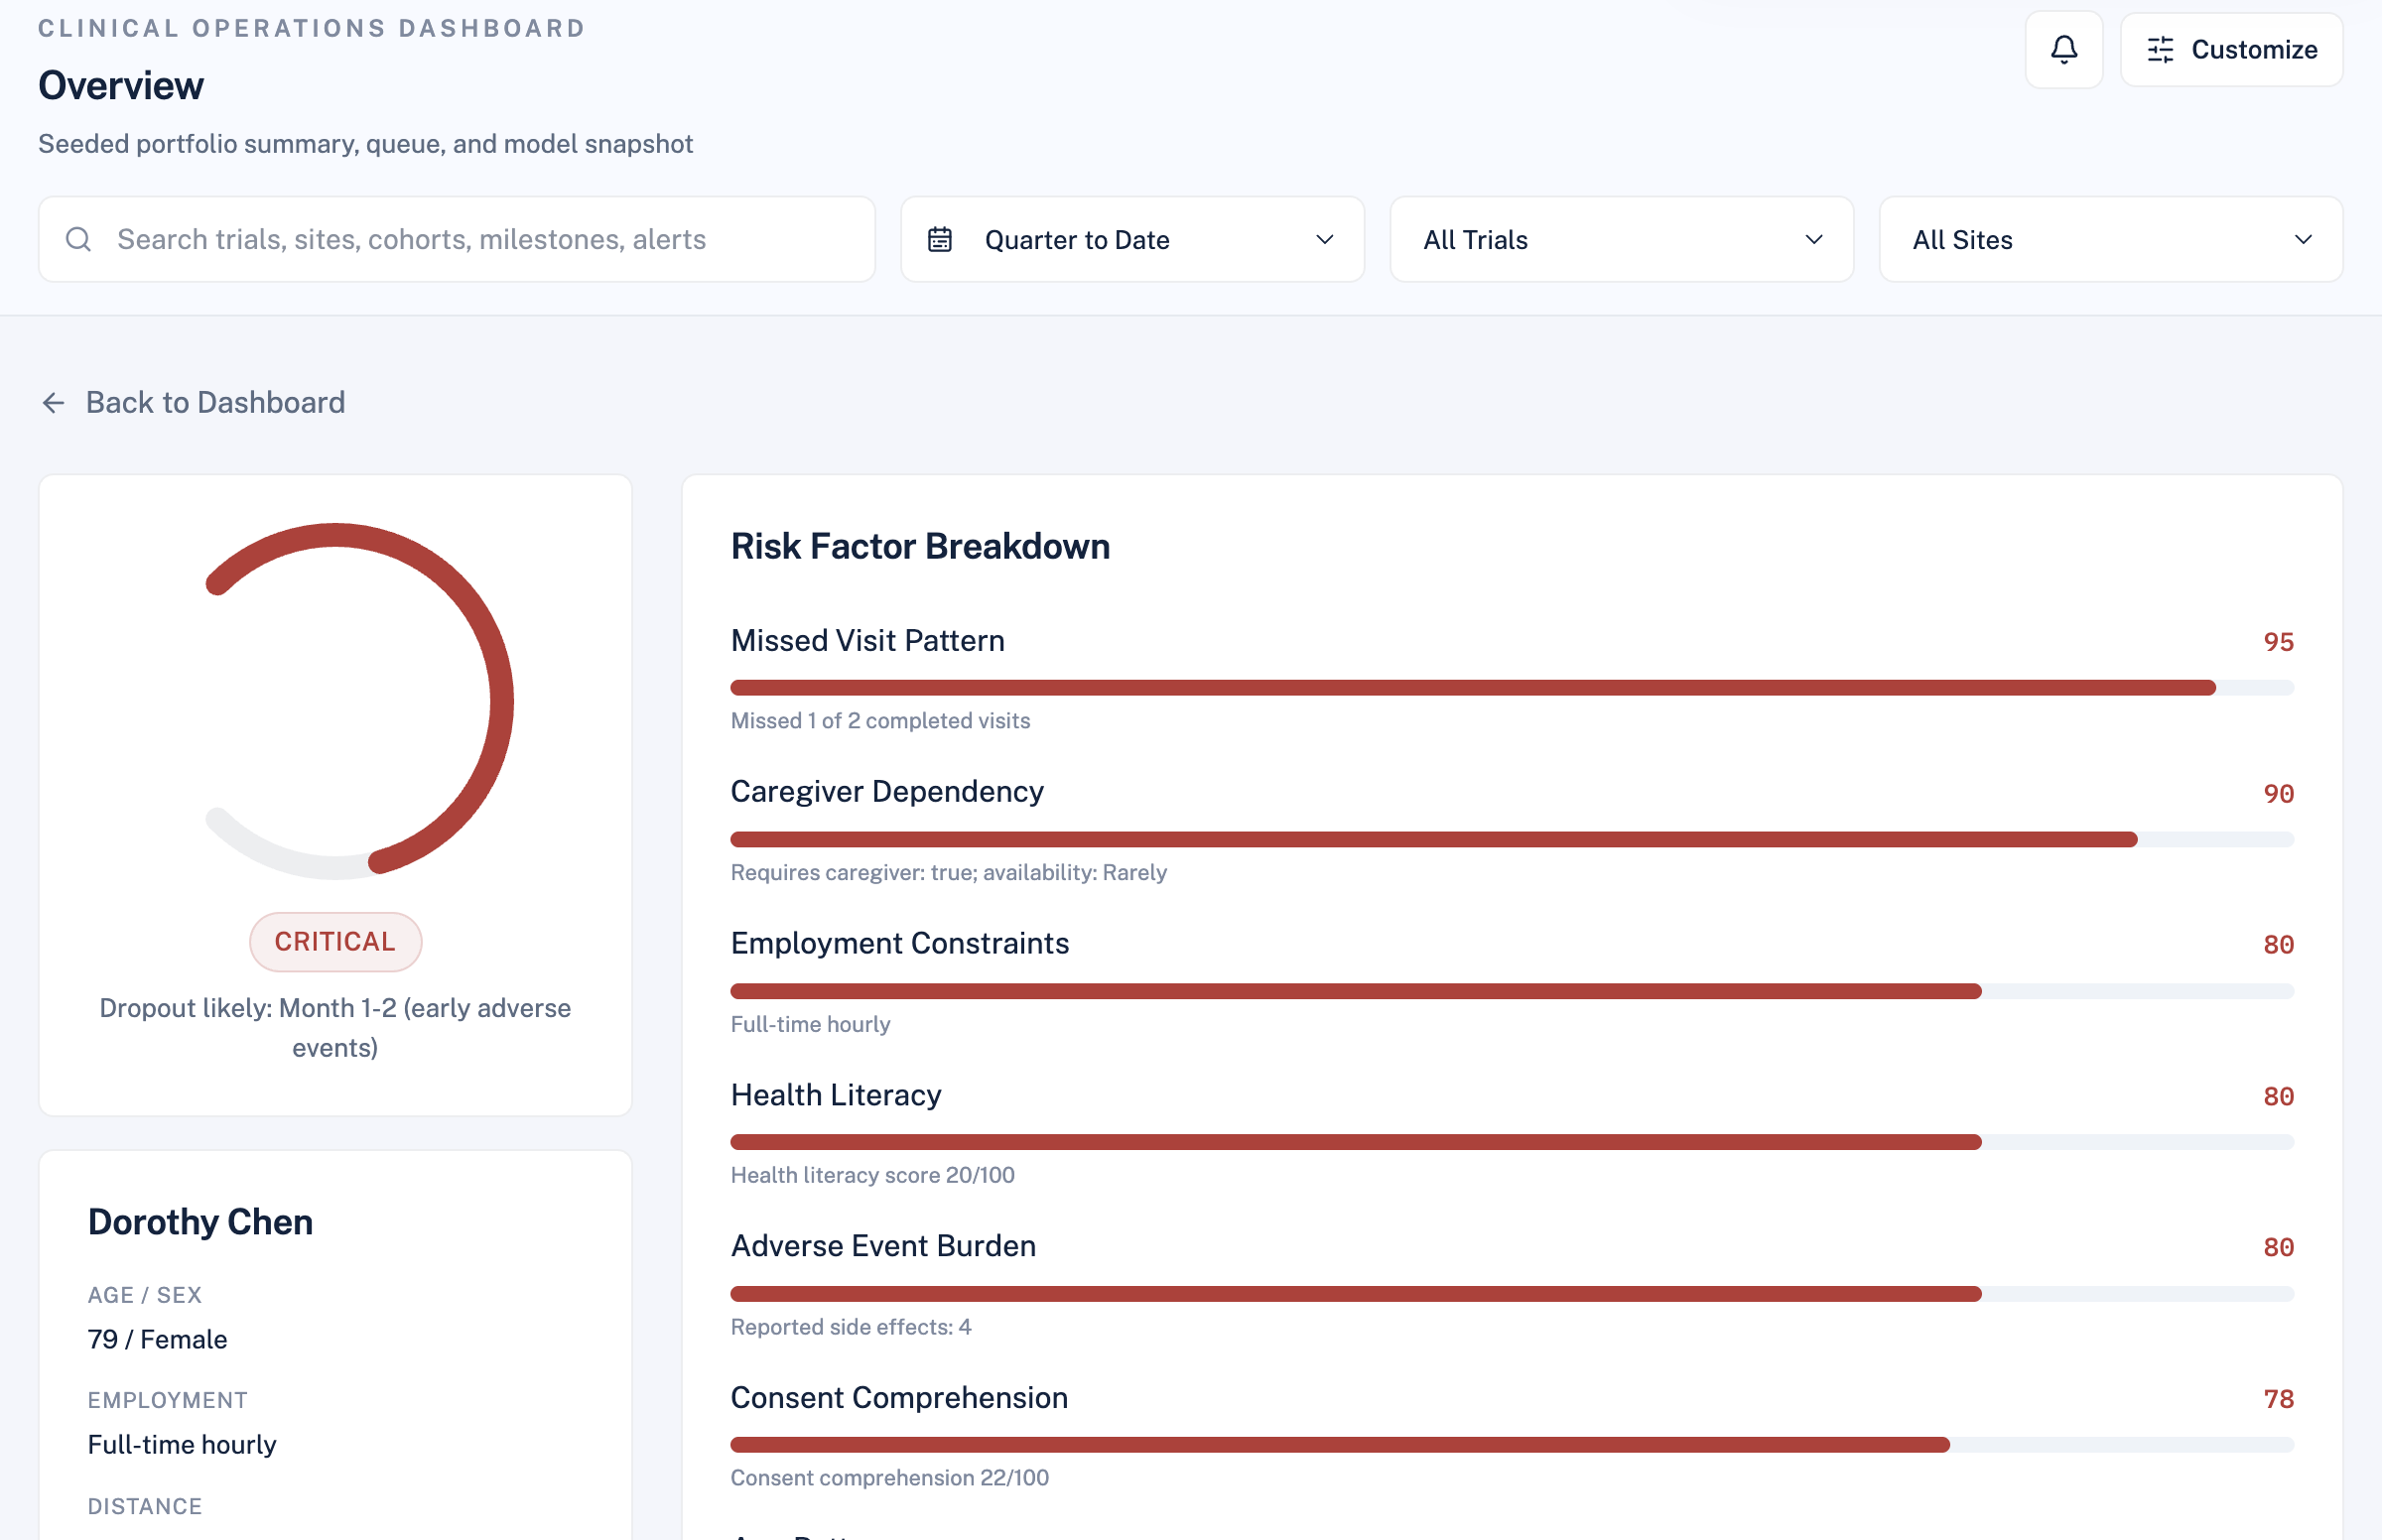
RetainIQ is a deliberately hybrid system. We made an early architectural decision that shaped everything: the core score must be explainable, not a black box. Clinical coordinators and sponsors need to trust the output. A neural network saying "this patient will drop out with 73% probability" is not actionable. A system saying "this patient scores 68/100 because they live 38 miles away, work full-time hourly, and have missed 2 of 6 visits" is.
The Deterministic Risk Engine
The foundation is a weighted scorecard across 11 clinical and logistical factors:
$$ \text{RiskScore} = \sum_{i=1}^{11} w_i \cdot f_i(x) $$
Where $w_i$ are fixed domain-informed weights and $f_i(x)$ maps raw patient/protocol fields to a normalized 0–1 sub-score. The weights were designed to reflect real operational drivers of dropout:
| Factor | Weight $w_i$ |
|---|---|
| Distance to site | $0.18$ |
| Visit burden | $0.15$ |
| Employment constraints | $0.12$ |
| Health literacy | $0.10$ |
| Caregiver dependency | $0.09$ |
| Prior trial experience | $0.08$ |
| Adverse event burden | $0.08$ |
| Missed visit pattern | $0.07$ |
| Consent comprehension | $0.05$ |
| Age pattern | $0.04$ |
| Transportation reliability | $0.04$ |
This produces a score in $[0, 100]$, bucketed into four risk categories:
$$ \text{Category} = \begin{cases} \text{Low} & \text{if } s < 31 \ \text{Moderate} & \text{if } 31 \leq s < 51 \ \text{High} & \text{if } 51 \leq s < 75 \ \text{Critical} & \text{if } s \geq 75 \end{cases} $$
The Hybrid ML Overlay
The deterministic score is precise but rigid — it doesn't capture population-relative uncertainty. To address this, we built a surrogate ML layer on top.
For each active cohort, the system:
- Generates a synthetic reference population via perturbation of real patient features
- Assigns probabilistic dropout labels using the deterministic score as a prior
- Trains a logistic regression surrogate:
$$ P(\text{dropout}) = \sigma\left(\beta_0 + \sum_{j} \beta_j x_j\right) = \frac{1}{1 + e^{-z}} $$
- Blends the model output with the rule-based probability using a weighted combination
- Produces calibrated confidence intervals via bootstrap sampling
The result is not just a point estimate but an uncertainty band — giving coordinators and managers a more honest picture:
$$ \hat{p} \pm z_{\alpha/2} \cdot \hat{\sigma}_{\hat{p}} $$
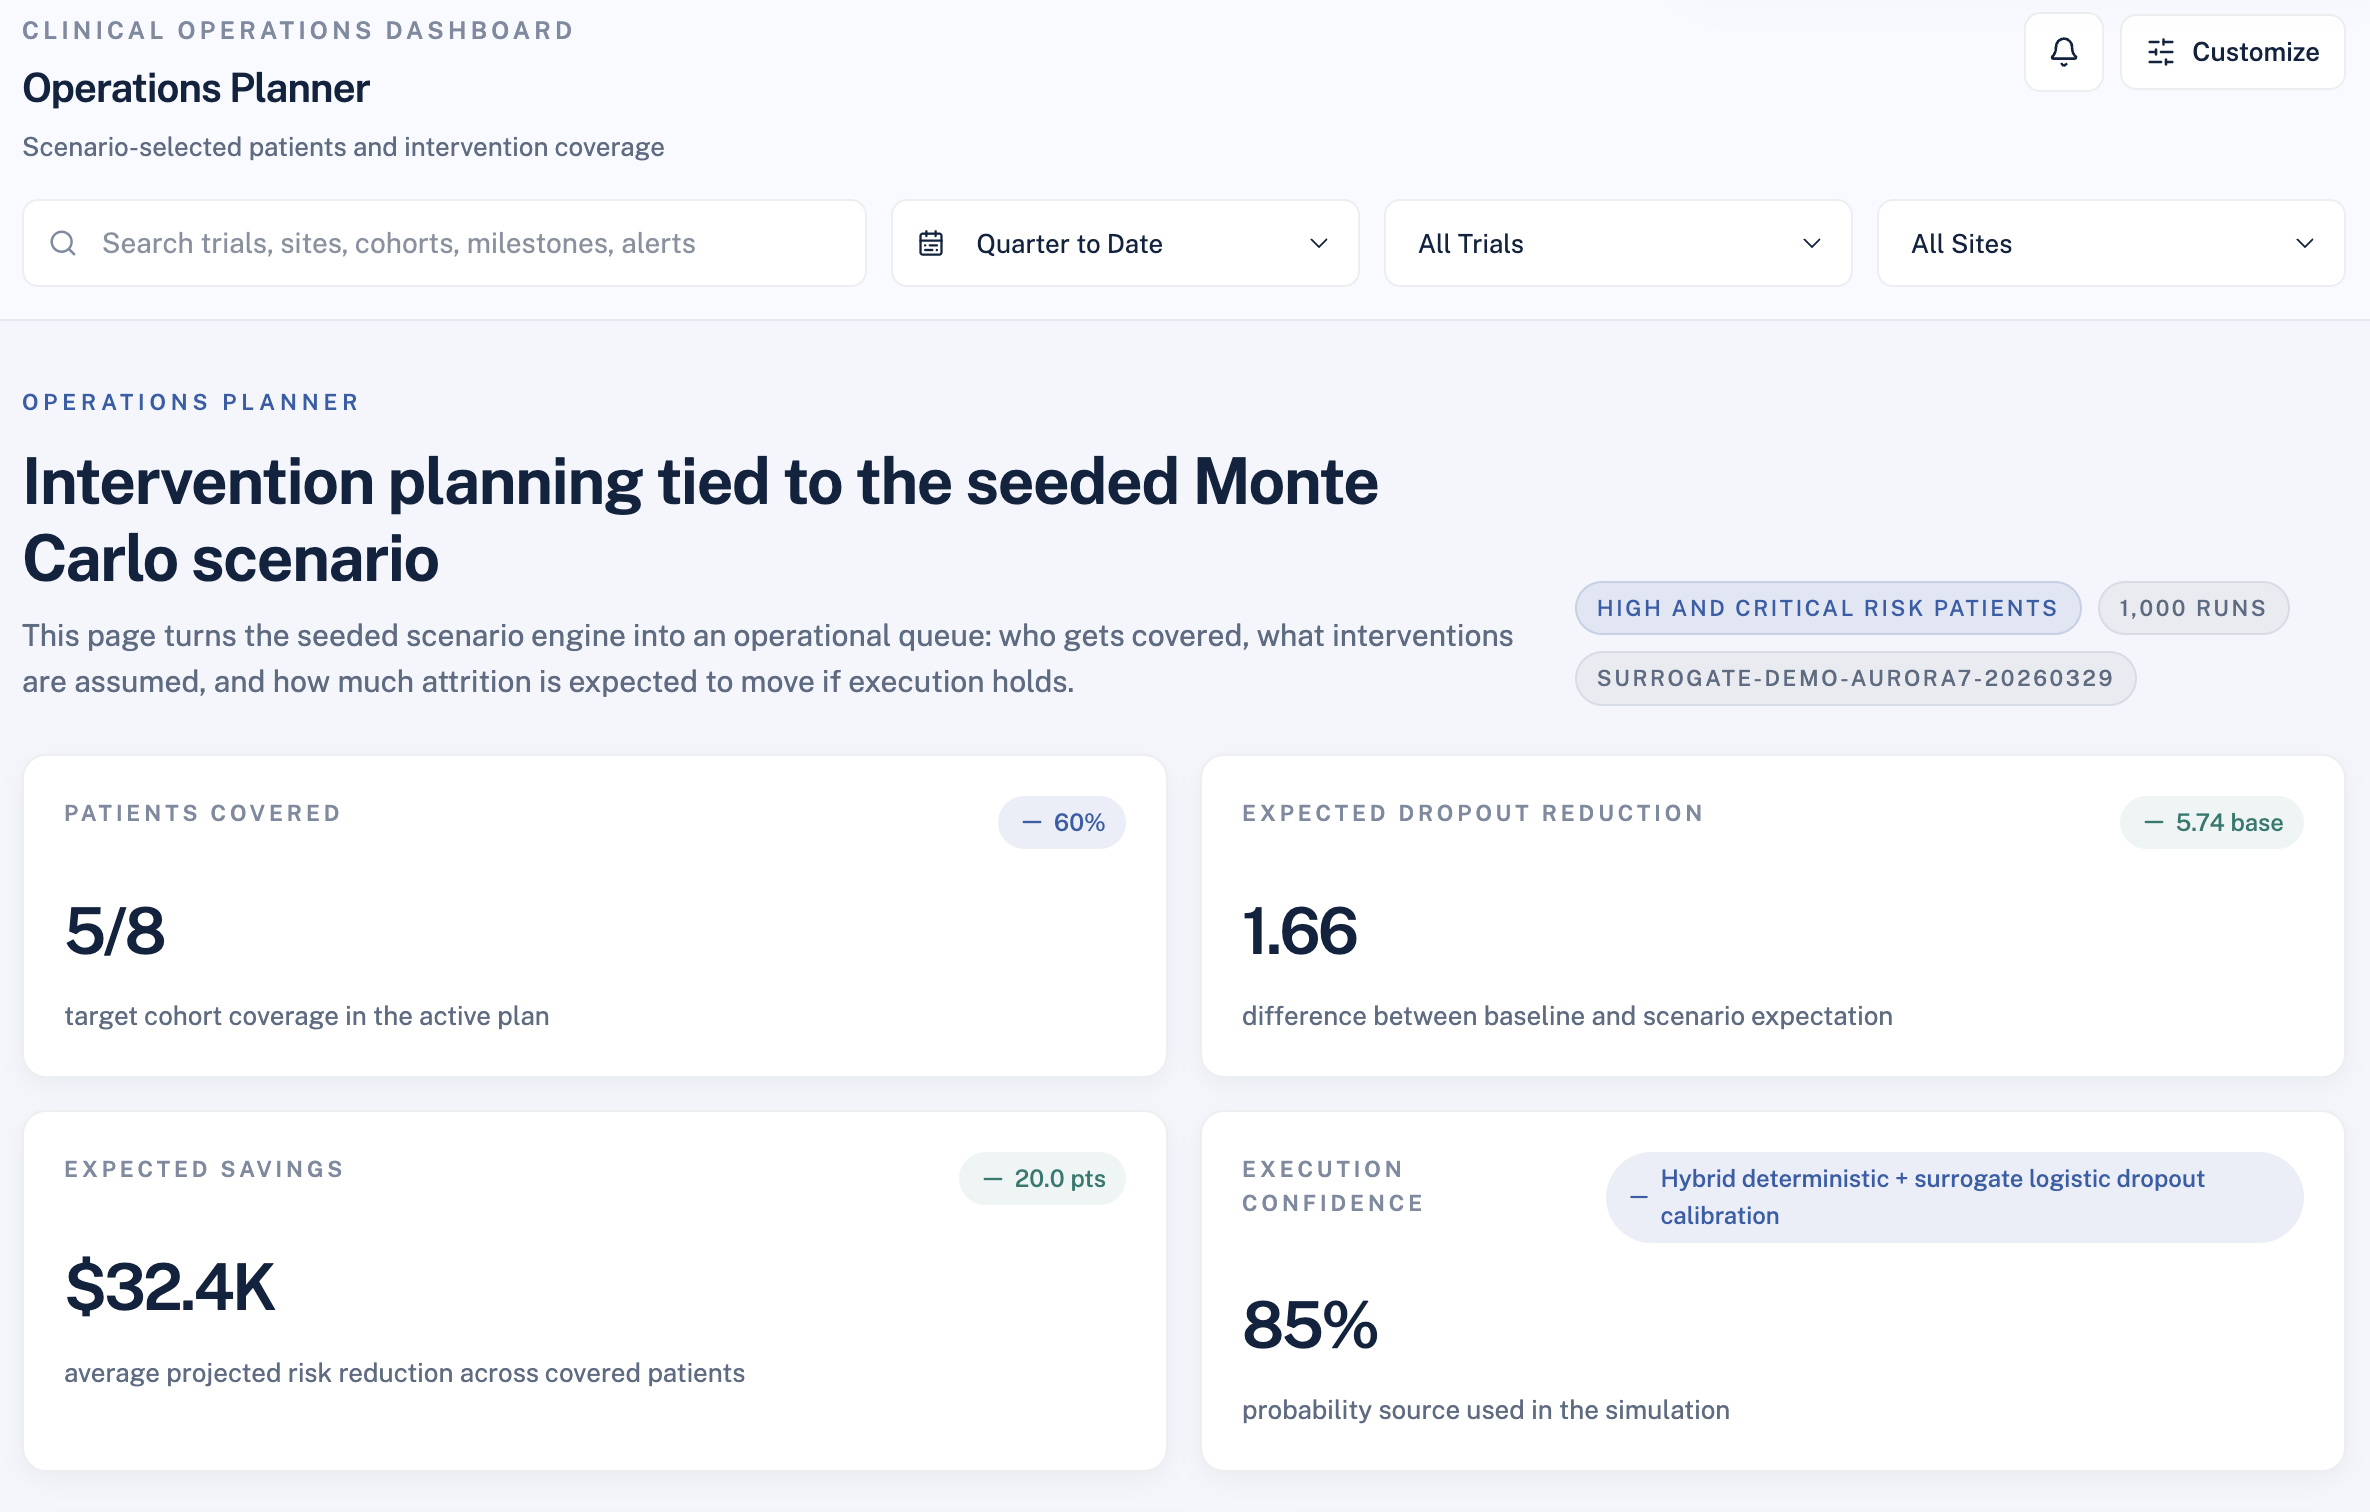
Portfolio Monte Carlo Simulation
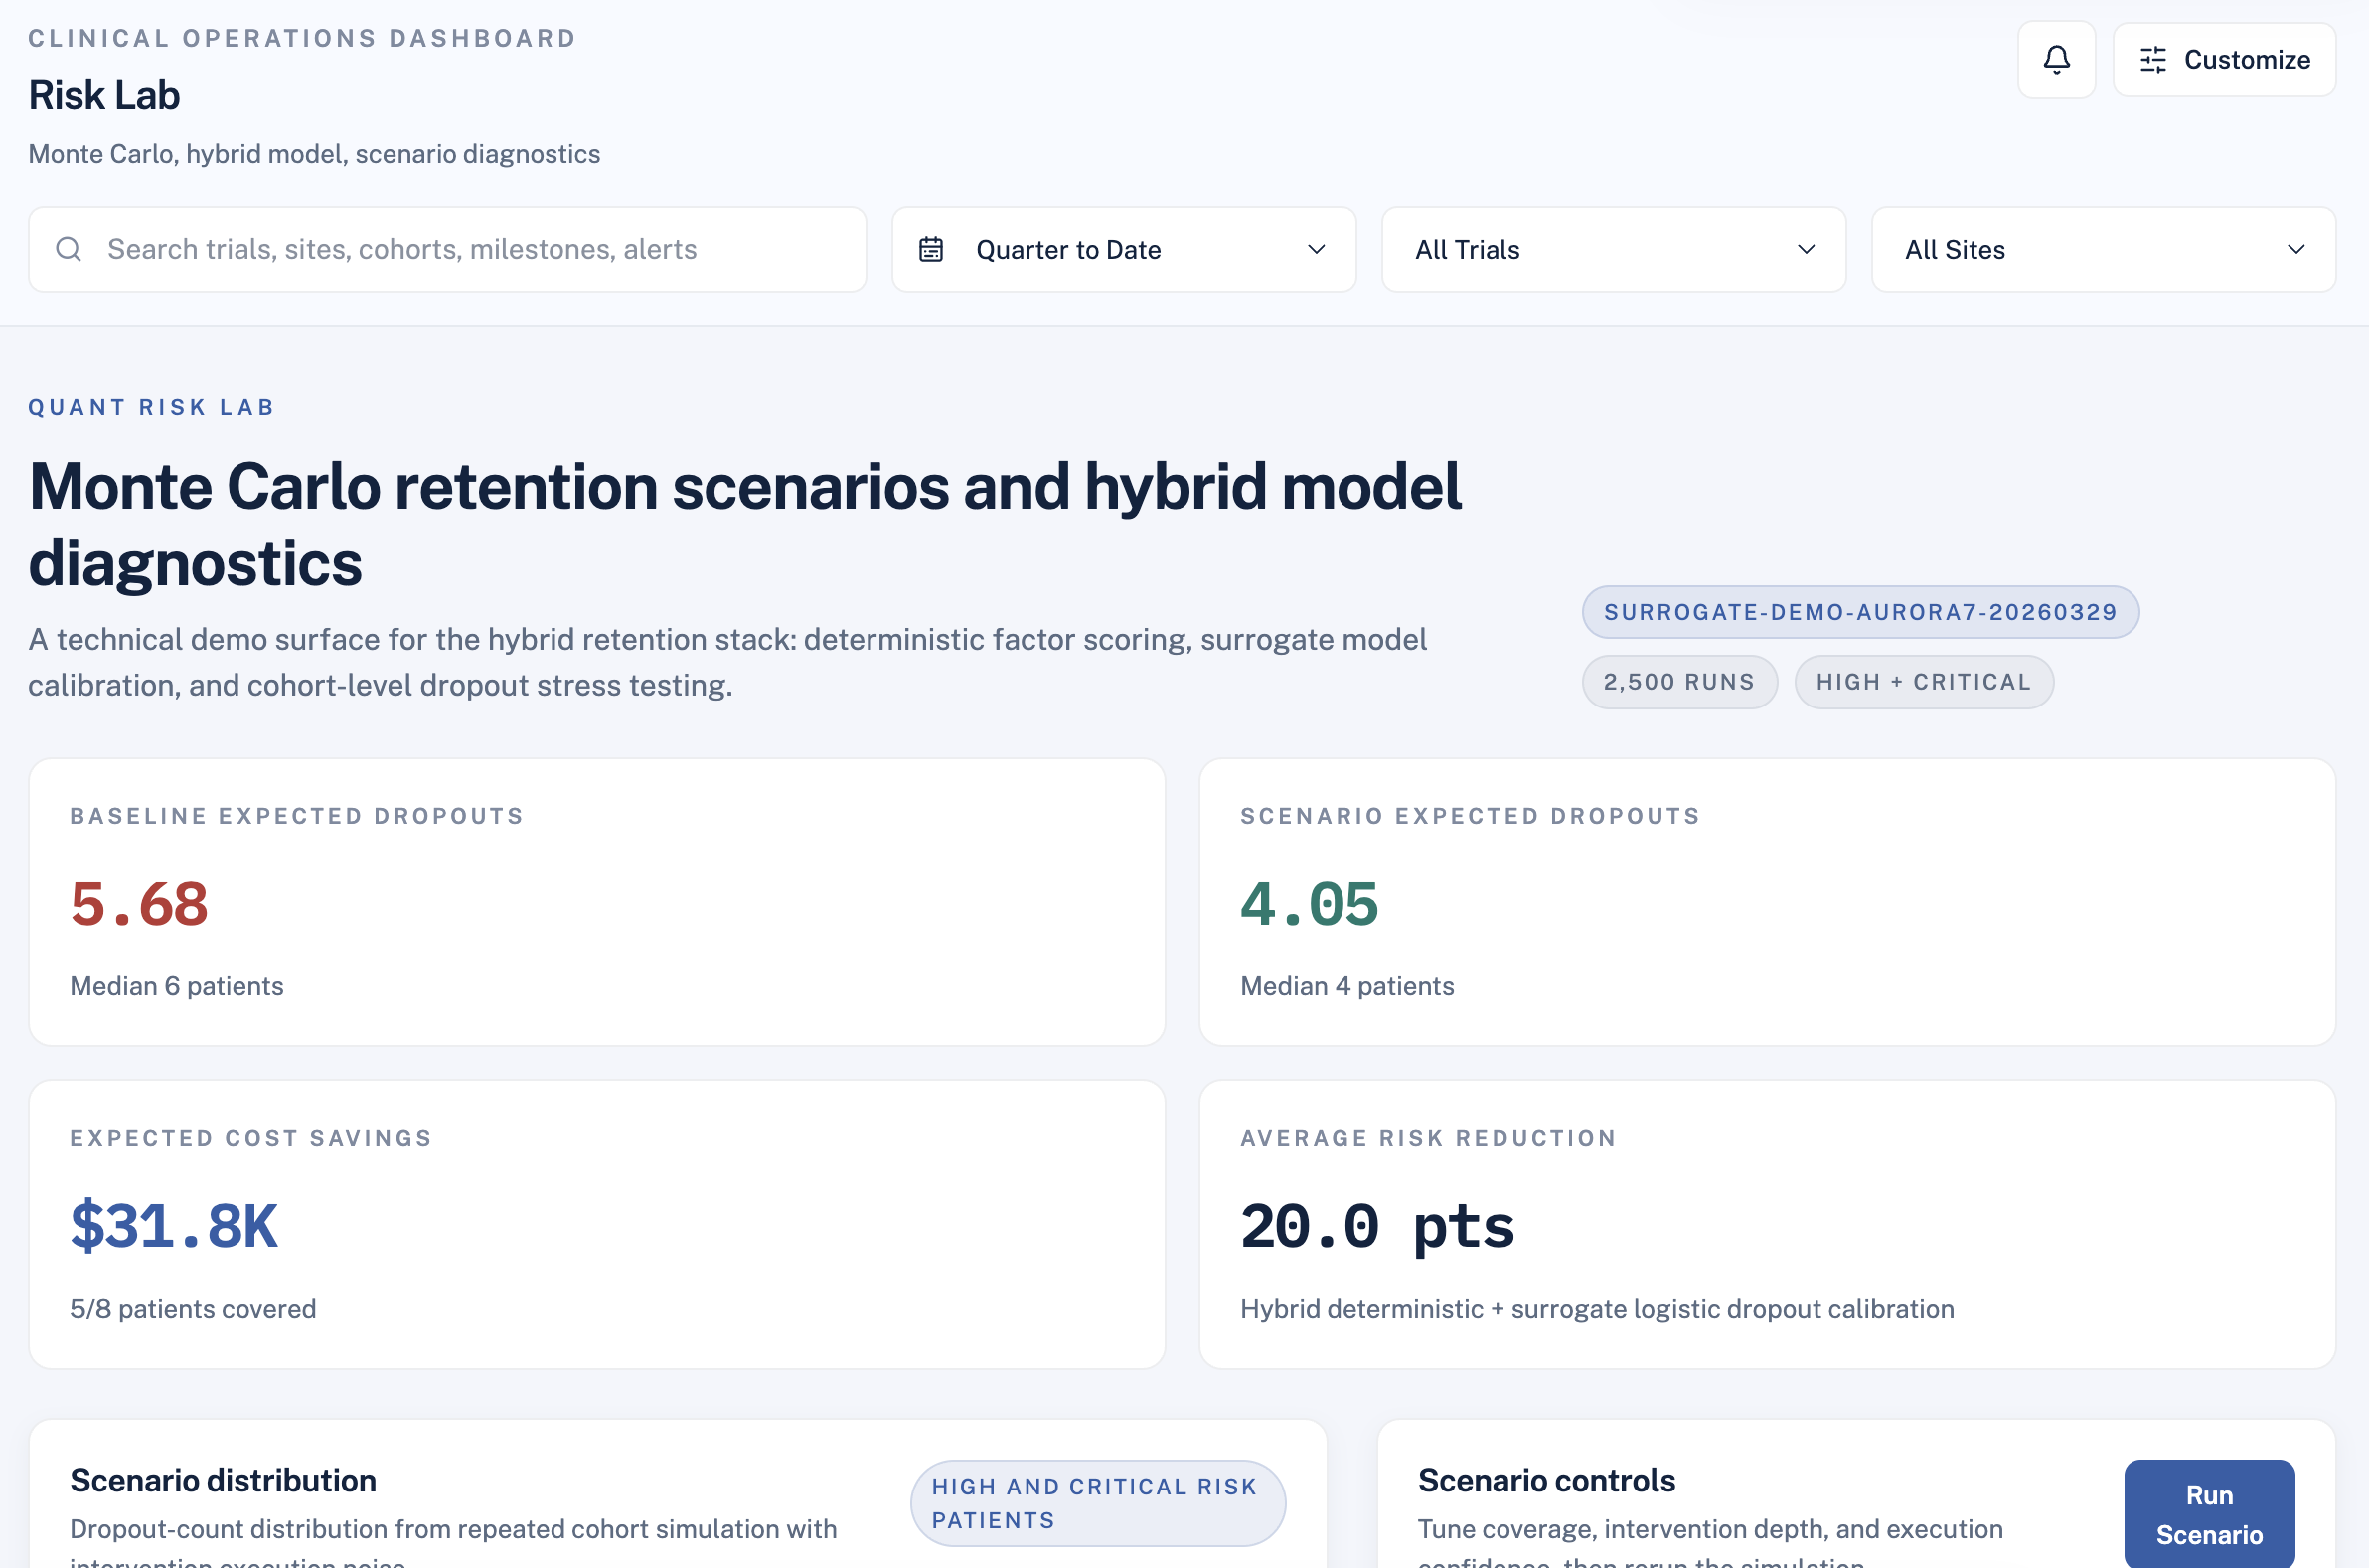
For operations leads and sponsors, point estimates aren't enough. We built a Monte Carlo engine that asks: if we deploy interventions across X% of high-risk patients, what is the realistic range of outcomes?
For each simulation run $k$ of $N$ total iterations:
$$ D_k = \sum_{i \in \text{cohort}} \mathbf{1}\left[u_i > \text{InterventionEffect}_i(\theta)\right] $$
Where $u_i \sim \text{Uniform}(0,1)$ introduces execution randomness and $\theta$ captures coverage rate, intervention count, and execution confidence. After $N$ runs:
$$ \mathbb{E}[D] = \frac{1}{N}\sum_{k=1}^{N} D_k, \qquad \text{Savings} = \left(\mathbb{E}[D_{\text{baseline}}] - \mathbb{E}[D_{\text{scenario}}]\right) \times C_{\text{dropout}} $$
This gives sponsors a defensible range — not a false-precise single number.
The Intervention Engine
We designed a library of 10 operational interventions mapped to specific risk drivers. Interventions are patient-eligible (not all apply to all patients) and stack with diminishing returns:
$$ \text{PostInterventionRisk} = \text{BaseRisk} \times \prod_{j} (1 - r_j \cdot \delta_j) $$
Where $r_j$ is the estimated risk reduction for intervention $j$ and $\delta_j < 1$ is a diminishing-returns discount for each additional stacked intervention.
The Stack
- Backend: Python + FastAPI + SQLite + Pydantic v2
- Frontend: React 18 + Vite + Tailwind CSS + Recharts
- AI layer: Anthropic Claude for narrative generation only — scores and decisions remain fully deterministic
Challenges
Explainability vs. power. The hardest tension throughout was resisting the urge to let the ML model take over the score. A pure ML output would have been harder to explain to a coordinator who needs to justify an intervention to a sponsor. We spent significant time designing the hybrid architecture so the deterministic engine stays authoritative and the ML layer adds calibration without replacing transparency.
Diminishing returns modeling. Getting the intervention stacking math right was surprisingly tricky. Naively combining multiple risk reductions leads to implausible outcomes — a patient whose risk drops to near zero after three interventions. The multiplicative discount model was the simplest formulation that produced credible results.
Monte Carlo parameter sensitivity. Early versions of the simulation were too sensitive to the execution confidence parameter — small changes produced wildly different expected savings. Stabilizing the output required careful normalization of the intervention effect distribution before sampling.
Keeping the frontend honest. The executive dashboard views are still partially mock/demo surfaces. We made the deliberate decision not to fake a complete product — the routes that show real data are real, and the ones that are still presentational are clearly noted. Shipping a polished-looking demo that lies about its data source felt worse than shipping an honest one with clearly labeled gaps.
What We Learned
The most important lesson was that the model is not the product. The scoring engine took days. The harder work was the operational framing: what does a coordinator actually need to see at 8am before a clinic day? What does a sponsor need to feel confident approving a $50K intervention budget? Those questions shaped the architecture far more than any modeling decision.
We also learned that uncertainty is a feature, not a bug. Early stakeholder feedback pushed back on the confidence interval display — "why not just show one number?" But a single number implies false precision. Showing a range builds trust, because it's honest. The Monte Carlo output exists for the same reason.
Finally: AI should support decisions, not make them. We were deliberate about using Claude only for narrative generation. The risk score, the intervention shortlist, the scenario math — all deterministic. This keeps the system auditable, defensible, and trustworthy in a domain where those properties matter enormously.
Accomplishments that we're proud of
What we learned
What's next for Churnless
Built With
- claude
- fastapi
- javascript
- material
- pandas
- pydantic
- python
- radix
- react
- sqlite
- tailwind
- typescript
- uvicorn
- vite

Log in or sign up for Devpost to join the conversation.