-
-

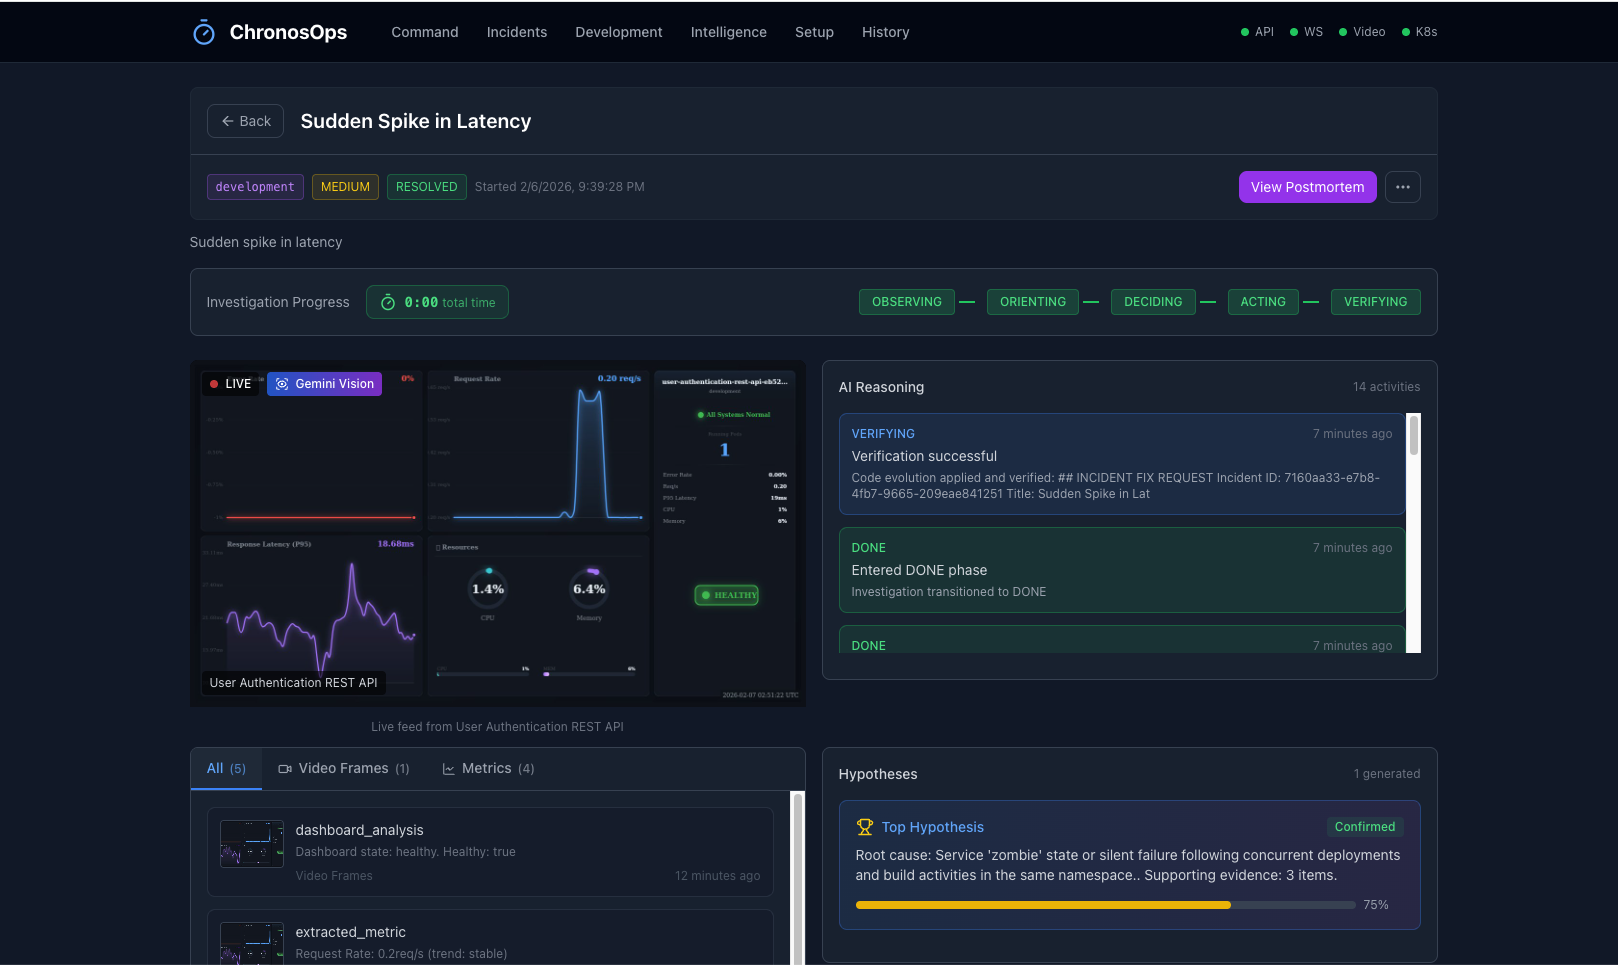
Autonomous Incident Response
-
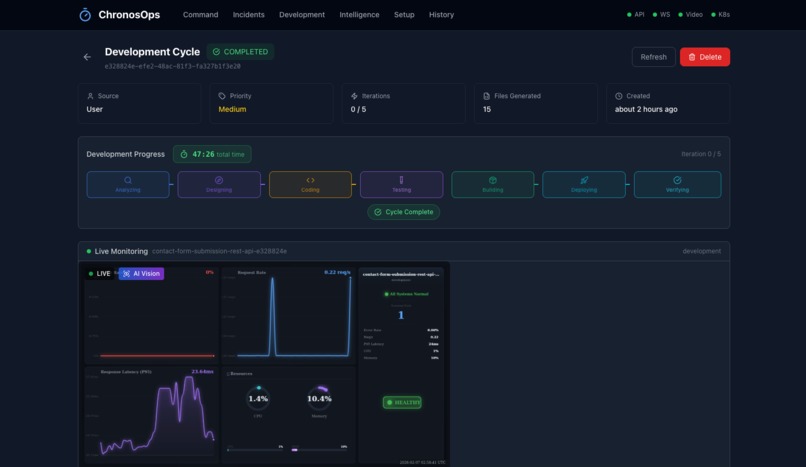
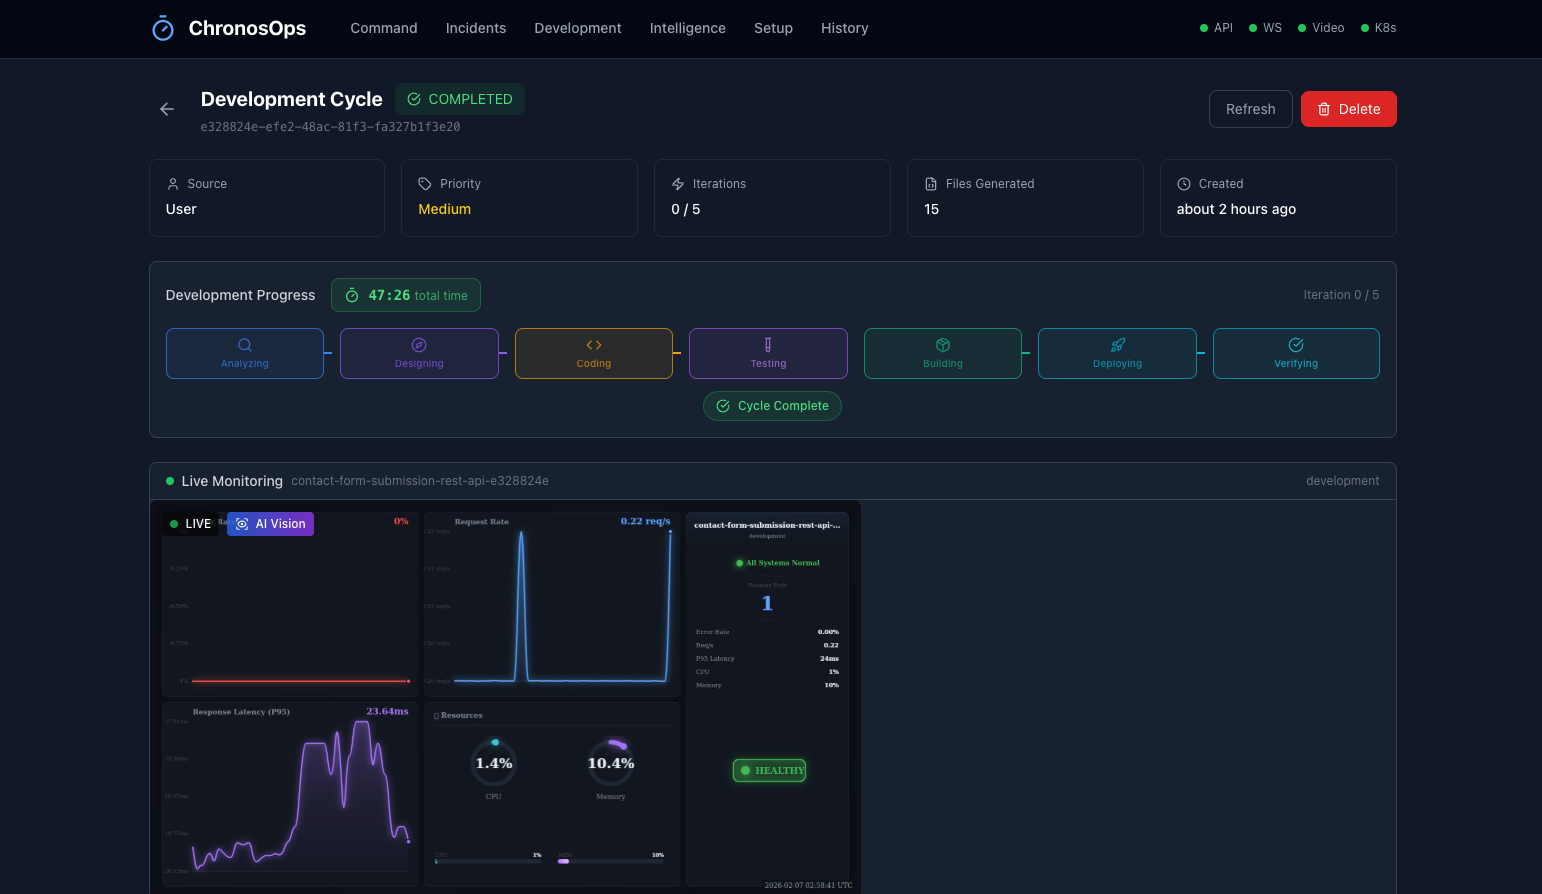
Self-Regenerating App Development
Inspiration
It's 3 AM. Your phone screams. Production is down.
Every software engineer knows this nightmare. You're ripped from sleep, adrenaline surging, scrambling to open six different dashboards while thousands of dollars burn every minute. By the time you identify the root cause it's 45 minutes later and the fix is often a simple rollback that any tool could have done automatically.
This scenario plays out tens of thousands of times daily across the tech industry.
The numbers are staggering. Industry research shows downtime now costs enterprises an average of $14,056 per minute and for Fortune 500 companies, losses can reach $1.43 million per hour. The January 2024 CrowdStrike incident alone caused $5.4 billion in Fortune 500 losses from a single faulty software update. Meanwhile, 70% of SREs report that on-call stress directly impacts burnout and attrition, with replacement costs ranging from $66K-$336K per departure.
I observed a senior SRE debug a production incident. Her process was completely logical: look at the dashboard, check recent deployments, correlate timing, form a hypothesis, test it, act, verify. If an expert's debugging process is deterministic and repeatable why can't AI do it?
But this time we went even further. We asked: what if AI could not only fix the immediate problem, but evolve the code to prevent it from happening again? What if infrastructure could learn from every incident and regenerate itself to be more resilient?
We analyzed the competitive landscape. Every major Artificial Intelligence for IT Operations (AIOps) vendor, specifically PagerDuty, Datadog, BigPanda, Splunk stops at the same point of anomaly detection and suggested remediation remains a naunced and largely accurate characterization of the enterprise software market as of January 2026. That means they can detect anomalies and suggest fixes, but none of them actually execute autonomous remediation with code-level fixes.
Datadog's Bits AI released late 2025 can create pull requests, but engineers must review and merge it. PagerDuty's AI agents, announced in Spring 2025, explicitly state the company is being "deliberate in defining how far these agents can act autonomously by prioritizing human in the loop approvals."
The industry operates at what we call Level 3 autonomy, i.e. AI-recommended remediation with human approval. As of February 2026 the competitive lanscape is defined by a push for "Autonomous IT" but No production tool has achieved Level 5: fully autonomous self-healing with code evolution.
That gap became our mission.
ChronosOps was born, not just as another dashboard or alerting tool, but as the world's first Self-Regenerating Autonomous Incident Response Platform. A system that doesn't just detect problems it fixes them, learns from them, and evolves the underlying code to prevent recurrence.
This shift towards autonomous IT operations is not a binary transition but a progression through a hierarchy of observability and response maturity that couldn't exist before Gemini 3. The combination of 1M token context windows, spatial-temporal video understanding, thought signatures for multi-hour reasoning, and tool use for real execution creates capabilities that simply weren't possible with any previous AI system. For the first time, we can build an AI SRE that truly thinks and acts, not one that suggests while humans do the work.
This is the Action Era. This is ChronosOps. And we built it at BroadComms.
What it does
ChronosOps is the AI SRE that never sleeps.
It transforms how IT engineering teams respond to production incidents by implementing two interconnected OODA (Observe-Orient-Decide-Act) loops powered by Gemini 3's most advanced capabilities. Where other tools stop at alerting, ChronosOps sees, heals, learns, and regenerates creating the industry's first truly autonomous self-healing infrastructure.
🔍 SEES - Spatial-Temporal Vision Understanding
ChronosOps literally watches your dashboards using Gemini 3's revolutionary video understanding. Unlike traditional monitoring systems that only reads API metrics, our VisionService renders real-time dashboards server-side at 2 FPS and streams them to Gemini for continuous visual analysis.
The AI sees your CPU spikes, error rate changes, memory pressure, and visual anomalies just like a human SRE would, but does it 24/7, without any fatigue.
Our HybridAnomalyDetector combines:
- Prometheus polling (every 15-second interval) for numerical precision
- Vision polling (every 30-second interval) for pattern recognition
- Correlation engine that merges both sources to reduce false positives
When a human SRE squints at a Grafana dashboard and says, "that doesn't look right" ChronosOps can now do the same, autonomously.
⚡ HEALS - Autonomous Escalating Remediation
When anomalies are detected, ChronosOps doesn't just alert it acts. Our ExecutorFactory implements an escalating remediation pipeline that starts with the safest actions and progressively increases intervention:
| Priority | Action | Risk Level | Duration |
|---|---|---|---|
| 1 | Rollback deployment | Very Low | ~10 seconds |
| 2 | Restart pods | Low | ~30 seconds |
| 3 | Scale replicas | Low | ~1 minute |
| 4 | Code Evolution | Medium | ~5-15 minutes depending on complexity |
Each action includes verification steps. If verification fails, the system automatically escalates to the next level. Real kubectl commands execute against your Kubernetes cluster. ChronosOps does the fix, not just recommends it.
The OODA state machine drives this behavior:
IDLE → OBSERVING → ORIENTING → DECIDING → ACTING → VERIFYING → DONE/FAILED
🧠 LEARNS - Intelligence Platform
Every resolved incident becomes institutional knowledge. Our Intelligence Platform leverages Gemini 3's 1M token context to perform incident reconstruction by analyzing complete incident bundles including logs, metrics, deployment history, video frames, and past incidents in a single reasoning session.
The platform extracts four types of patterns from resolved incidents:
- Detection patterns: Identify similar incidents early
- Diagnostic patterns: Accelerate root cause analysis
- Resolution patterns: Recommend proven remediation actions
- Prevention patterns: Suggest proactive measures
The next time a similar pattern emerges, it's recognized instantly. Tribal knowledge becomes encoded intelligence.
🔄 REGENERATES - Self-Healing Applications
This is where ChronosOps becomes revolutionary. Our Development OODA Loop creates a complete autonomous development pipeline:
Natural Language → Analyze → Design → Code → Test → Build → Deploy → Verify
                                                                    ↓
            ← Code Evolution ← Incident ← Anomaly Detection ← ←←←←←
From Sentence to Production: A single natural language prompt like "Create a REST API for managing users with CRUD operations" triggers autonomous:
- Requirement analysis and architecture design via Gemini 3
- TypeScript + React code generation with Zod schemas
- Automated Vitest test suite execution
- Docker multi-stage image building
- Kubernetes deployment with health checks
- Auto-registration with Prometheus monitoring
Code Evolution: When traditional remediations methods fail, ChronosOps escalates to the capability no other tool offers - autonomous code fixes.
The CodeEvolutionEngine:
- Analyzes the codebase using Gemini's extended thinking
- Identifies the root cause at the code level
- Generates a targeted fix with diff preview
- Executes with safety guardrails (edit locking, git versioning, auto-revert on failure)
- Rebuilds, redeploys, and verifies
The Complete Flow: Deploy an application → ChronosOps monitors it → Anomaly detected → Investigation runs → If operational fixes fail → AI evolves the code → Deploys fix → Verifies resolution → Generates postmortem → Learns pattern for future.
📋 Automated Documentation
Every investigation produces compliance-grade documentation:
- Real-time timeline with evidence links
- Hypothesis tracking showing tested and rejected theories
- Root cause analysis with supporting evidence
- Complete postmortem ready for team review
Documentation that typically takes hours is generated in seconds.
The Transformation
| Before ChronosOps | With ChronosOps |
|---|---|
| 3 AM phone calls | Autonomous resolution |
| 1-4 hour MTTR | 2-20 minute MTTR |
| Manual investigation | AI-driven correlation |
| Reactive fixes | Self-healing + prevention |
| Tribal knowledge | Learned patterns |
| Engineer burnout | Engineers sleeping |
| Level 3 autonomy | Level 5 autonomy |
ChronosOps isn't an incremental improvement, it's the leap from AI that assists to AI that ACTS.
How we built it
ChronosOps is built as a TypeScript monorepo with clean separation of concerns across 10+ packages, implementing approximately 36,000+ lines of code with comprehensive testing.
Architecture Overview
┌─────────────────────────────────────────────────────────────────────────┐
│                    INVESTIGATION OODA LOOP                              │
│   OBSERVE → ORIENT → DECIDE → ACT (rollback/restart/scale) → VERIFY     │
│                                   ↓ (if actions fail)                   │
│                       Escalate to Code Fix - EVOLUTION                  │
└─────────────────────────────────────────────────────────────────────────┘
                                    ↓
┌─────────────────────────────────────────────────────────────────────────┐
│                    DEVELOPMENT OODA LOOP                                │
│   ANALYZE → DESIGN → CODE → TEST → BUILD → DEPLOY → VERIFY              │
│                                   ↑                                     │
│                     Auto-register for monitoring                        │
└─────────────────────────────────────────────────────────────────────────┘
Core Packages
| Package | Lines | Responsibility |
|---|---|---|
@chronosops/core |
~15,000 | OODA state machines, orchestrators, detection, generation |
@chronosops/gemini |
~3,000 | Gemini 3 API client, prompts, structured output schemas |
@chronosops/vision |
~2,500 | Server-side dashboard rendering, MJPEG streaming |
@chronosops/kubernetes |
~1,500 | K8s client for rollback, restart, scale, apply, deployment |
@chronosops/database |
~2,000 | SQLite schemas, Drizzle ORM repositories |
@chronosops/git |
~1,000 | Local git + GitHub integration for code versioning |
apps/api |
~4,000 | Fastify REST API (40+ endpoints) + WebSocket handlers |
apps/web |
~8,000 | React + Tailwind + Monaco Editor UI |
Gemini 3 Integration (Critical to Our Approach)
We leverage every major Gemini 3 capability; this project couldn't exist with any other model:
| Feature | How We Use It | Why It's Essential |
|---|---|---|
| 1M Token Context | Load entire incident bundles - logs, metrics, deployment history, past incidents, ad full codebases in a single prompt | No RAG chunking = holistic reasoning. We can analyze 50,000 lines of code, 12 months of incident history, and complete runbook documentation simultaneously |
| Spatial-Temporal Video | Watch rendered dashboard frames over time, detecting visual anomalies and trend changes | ChronosOp SEES your dashboards the way humans do, identifying patterns that threshold-based alerts miss |
| Thinking Levels | Escalate reasoning depth dynamically based on evidence confidence | LOW (1,024 tokens) for simple correlations, MEDIUM (8,192) for multi-factor analysis, HIGH (24,576) for complex root cause |
| Thought Signatures | Maintain investigation state across hours remember rejected hypotheses, build on observations | True marathon agent behavior. Failed hypotheses are remembered, reasoning builds on prior context |
| Tool Use | Execute kubectl commands, generate K8s manifests, modify source files | ChronosOps ACTS, not just suggests. Real remediation through function calling |
| Structured Output | JSON schema responses for consistent parsing | Reliable hypothesis generation, action planning, architecture design |
Key Technical Implementations
OODAStateMachine (packages/core/src/state-machine/):
// State transitions driving autonomous behavior
IDLE → OBSERVING → ORIENTING → DECIDING → ACTING → VERIFYING → DONE/FAILED
All transitions are logged with timestamps. Event emitter broadcasts to WebSocket for real-time UI updates.
HybridAnomalyDetector (packages/core/src/detection/):
- Prometheus polling every 15 seconds for numerical precision
- Vision polling every 30 seconds for pattern recognition
- Correlation engine merges both detection modalities
- Automatic incident creation on threshold breach
- Deduplication and cooldown management
VisionService (packages/vision/):
- Server-side dashboard rendering using
@napi-rs/canvas - Direct Prometheus queries → Canvas rendering → MJPEG streaming at 2 FPS
- Frame history buffer for temporal analysis
- AI annotation overlay showing Gemini's analysis
- Zero external dependencies that works anywhere Node.js runs
CodeEvolutionEngine (packages/core/src/evolution/):
- Edit locking with 30-minute heartbeat mechanism
- Diff preview with approve/reject workflow
- Git versioning with rollback capability (local + GitHub)
- Auto-approve mode (
CODE_EVOLUTION_AUTO_APPROVE=true) for fully autonomous operation - Links
codeEvolutions.triggeredByIncidentIdfor traceability
InvestigationOrchestrator (packages/core/src/orchestrator/):
- Coordinates all OODA phases
- Dynamic thinking budget calculation based on evidence confidence:
- Confidence < 0.5 → HIGH budget (24,576 tokens)
- Confidence 0.5-0.7 → MEDIUM budget (8,192 tokens)
- Confidence > 0.7 → LOW budget (1,024 tokens)
- Escalating remediation from rollback through code evolution
DevelopmentOrchestrator (packages/core/src/orchestrator/):
- 7-phase autonomous pipeline: ANALYZING → DESIGNING → CODING → TESTING → BUILDING → DEPLOYING → VERIFYING
- Generated apps include
/healthendpoint,/metrics,/docsOpen API documentation, with prom-client, Zod schemas - Auto-registration with MonitoringConfigService on deploy
- Bidirectional linking between development cycles and incidents
Tech Stack Summary
| Layer | Technology | Justification |
|---|---|---|
| Runtime | Node.js 20 + TypeScript | Type safety, async handling |
| API | Fastify + WebSocket | Performance, schema validation, real-time updates |
| AI | Gemini 3 via @google/genai |
1M context, video understanding, thought signatures |
| Vision | @napi-rs/canvas |
High-performance server-side rendering |
| Metrics | Prometheus + prom-client | Industry-standard metrics collection |
| Orchestration | Kubernetes via @kubernetes/client-node |
Real kubectl execution |
| Database | SQLite + Drizzle ORM | Type-safe, portable for demo (PosgreSQL for production) |
| UI | React 18 + Vite + Tailwind + Monaco Editor | Modern stack, code editing |
| Testing | Vitest | Fast, TypeScript-native |
Models Used
| Model | Use Case |
|---|---|
gemini-3-flash-preview |
Frame analysis, hypotheses, quick operations |
gemini-3-pro-preview |
Postmortem generation, incident reconstruction, complex reasoning |
API Surface
The system exposes 40+ REST endpoints plus WebSocket channels:
/api/v1/incidents/*— Incident lifecycle management/api/v1/investigations/*— OODA loop control/api/v1/development/*— Development cycle management/api/v1/evolution/*— Code evolution workflow/api/v1/intelligence/*— Pattern learning, reconstruction/api/v1/vision/*— Dashboard streaming/api/v1/services/*— Service registry- WebSocket: Real-time investigation updates, thinking log streaming
Challenges we ran into
1. Vision Without Screen Recording
The Problem: Our original approach was to use external screen recording of Grafana dashboards. This was fragile dependent on browser rendering, screen resolutions, window positioning, and external recording tools. The system would break if someone resized a window or changed display settings, making impossible to dynamically registet monitoring for numerous generated apps at the same time.
The Solution: We built VisionService from scratch, rendering dashboards entirely server-side using @napi-rs/canvas. The architecture:
Prometheus API → PromQL queries → Canvas rendering → MJPEG streaming
This gave us:
- Zero external dependencies
- Consistent output regardless of display configuration
- Works anywhere Node.js runs
- Frame buffer for temporal analysis
- Direct integration with Gemini's frame analysis API
The VisionService now includes line charts for time-series data, gauge charts for status indicators, and a compositor that assembles multiple charts into coherent dashboard frames at 2 FPS.
2. Maintaining Reasoning Continuity Across Hours
The Problem: Traditional LLMs have no memory. Each API call starts fresh. For complex investigations spanning multiple hours where the AI might test a hypothesis, reject it, try another approach, and gradually narrow down the root cause, this stateless behavior is catastrophic. The AI would forget what it already tried.
The Solution: We leveraged Gemini 3's Thought Signatures to persist ThoughtState across the entire investigation cycle. Our implementation:
- Stores thought signatures in the database via
thoughtStateRepository - Passes signatures between all OODA phases
- Failed hypotheses are explicitly remembered and excluded from future attempts
- Observations accumulate, building a coherent reasoning chain
This enabled true marathon agent behavior through investigations that span hours while maintaining logical continuity. The AI doesn't just remember what happened; it remembers why it made each decision and what it learned from failures.
3. Balancing Autonomous Action with Safety
The Problem: Executing kubectl rollback commands automatically is powerful but risky. What if the AI misdiagnoses the problem and makes things worse? An autonomous system without guardrails could turn a minor incident into a catastrophe.
The Solution: Escalating remediation with confidence thresholds. The system implements a risk-ordered pipeline:
| Order | Action | Risk | Reversibility |
|---|---|---|---|
| 1 | Rollback | Very Low | Instant |
| 2 | Restart | Low | Fast |
| 3 | Scale | Low | Adjustable |
| 4 | Code Evolution | Medium | Git revert |
Each action has verification steps that confirm success before proceeding. Only if low-risk actions fail does the system escalate. The confidence-based thinking budget also plays a role, low confidence triggers deeper analysis before action.
Additionally, we implemented action cooldowns to prevent rapid-fire remediation attempts, and dry-run mode for environments where autonomous execution isn't appropriate.
4. Code Evolution Without Breaking Production
The Problem: AI-generated code fixes deployed directly to production? That sounds terrifying and for good reason. One wrong fix could cascade into a worse outage than the original incident.
The Solution: We implemented a comprehensive safety architecture:
- Edit Locking: Pessimistic locking with 30-minute heartbeat prevents concurrent modifications. Only one entity (human or AI) can modify code at a time.
- Diff Preview: All proposed changes are shown with full diff before application. The UI displays exactly what will change.
- Approve/Reject Workflow: Human review is available when needed. Auto-approve mode is opt-in for trusted environments via
CODE_EVOLUTION_AUTO_APPROVE=true. - Git Versioning: Every change is committed with a meaningful message. Allowing instant rollback to any previous version.
- Health Check Verification: After deployment, the system verifies
/healthendpoint returns 200 before marking success. - Auto-Revert on Failure: If health checks fail after code evolution, the system automatically reverts to the previous working version.
5. Correlating Multi-Modal Data
The Problem: A production incident generates signals across multiple domains. Prometheus metrics showing latency spikes, application logs with error traces, Kubernetes events indicating pod restarts, video frames showing visual anomalies in dashboards. How do you merge all these signal types into coherent reasoning without losing context?
The Solution: Gemini 3's 1M token context window. Instead of fragmenting data through RAG pipelines, we load everything into a single prompt:
- Complete logs from the incident window
- All relevant metrics with timestamps
- Dashboard frames as base64 images
- Kubernetes events and deployment history
- Relevant patterns from previous incidents
The Timeline Builder creates a unified chronological view across all data sources. Gemini can then perform holistic correlation spotting that the CPU spike in the video frame occurred 8 seconds before the error logs started, which correlates with the deployment event 2 minutes earlier.
This "everything in context" approach eliminates the information loss that plagues traditional chunking strategies.
6. Making DevOps Visually Compelling
The Problem: DevOps demos can be dry. Terminal windows and log files do not create the "wow" moment that hackathon judges could remember. Seeing a backend terminal window with logs and a line of code is less visually stimulating and boring than other types of demos.
The Solution: We invested heavily in visualization:
- Real-time dashboard streaming with visible AI annotations
- Thinking log visualization showing hypothesis generation and testing
- OODA phase indicators with clear state transitions
- Dramatic red-to-green transformations when remediation succeeds
- Split-screen view: Dashboard on left, AI reasoning on right
The demo tells a story: healthy system → anomaly appears → AI notices → AI thinks → AI acts → system heals → postmortem generates. Each step is visually distinct and engaging.
Accomplishments that we're proud of
🏆 World's First Visual AI for Infrastructure Monitoring
ChronosOps is the first tool that can literally watches dashboards using AI vision. Every other monitoring tool in the market including PagerDuty, Datadog, New Relic, Splunk typically reads metrics via APIs. They query numbers. They set thresholds, but non are capable of watching dashboards like an SRE would
We have implemented AI that SEES your dashboards the way humans do.
Our VisionService renders real-time metrics server-side and streams them to Gemini 3's spatial-temporal video understanding. The AI identifies patterns, anomalies, and correlations that threshold-based alerts miss the subtle visual cues that make an experienced SRE say "something doesn't look right" before any metric actually breaches a threshold.
This is a paradigm shift: from "is CPU > 80%?" to AI questioning "does this pattern look concerning?"
🏆 Level 5 Autonomous Remediation
We have mapped the Artificial Intelligent for IT Operations, AIOps market by autonomy level:
- Level 1: Automated alerting
- Level 2: AI-assisted triage
- Level 3: AI-recommended remediation
- Level 4: Human-approved autonomous actions
- Level 5: Fully autonomous self-healing infrastructure with code evolution
Every major vendor today operates at Level 3 or below. Datadog's Bits AI creates pull requests, the engineers still merge. PagerDuty's spring 2025 released AI agents explicitly require human approval for actions.
ChronosOps achieves Level 5. When configured for autonomous operation, it detects the anomaly, investigates the root cause, executes remediation (escalating from rollback through code evolution), verifies the fix, and documents everything all without human intervention.
No other production tool in the market does this.
🏆 Self-Regenerating Applications
The Development OODA Loop can generate complete applications from a single sentence:
"Create a REST API for managing users with CRUD operations"
This triggers autonomous:
- Requirement analysis via Gemini
- Architecture design with component diagrams
- TypeScript + React code generation
- Automated test suite creation and execution
- Docker multi-stage image building
- Kubernetes deployment with health checks
- Auto-registration with Prometheus monitoring
Every generated application is born self-aware with /health endpoints for liveness probes, /metrics endpoints with prom-client for observability, and automatic integration with ChronosOps monitoring.
When incidents occur, the system can evolve the code to fix them, creating a true self-healing loop.
🏆 Dual OODA Loop Architecture
We didn't just implement one autonomous loop, we implemented two interconnected loops that create emergent capabilities:
Investigation OODA: OBSERVE → ORIENT → DECIDE → ACT → VERIFY
                                              ↓ (escalates to EVEOLUTION)
Development OODA:   ANALYZE → DESIGN → CODE → TEST → BUILD → DEPLOY → VERIFY
When the Investigation loop's operational fixes (rollback, restart, scale) fail to resolve an incident, it escalates to the Development loop for code evolution. The fixed code deploys, re-registers for monitoring, and the Investigation loop verifies the resolution.
This bidirectional linking with database relationships tracking, which incidents triggered which code evolutions creates a self-improving system.
🏆 Intelligence Platform with Pattern Learning
Every resolved incident becomes institutional knowledge. Our Intelligence Platform:
- Learns patterns from resolved incidents using Gemini's analysis
- Reconstructs incidents using the full 1M token context window
- Matches patterns to accelerate future investigations
Tribal knowledge is the stuff that lives in senior engineers' heads and walks out the door when they leave, but with ChronosOps it becomes encoded, searchable intelligence.
The system gets smarter with every incident it handles. This is the compound interest of AI operations.
🏆 Complete Production-Ready System
This isn't a hackathon prototype. ChronosOps is a fully implemented system:
| Component | Scope |
|---|---|
| Codebase | 36,000+ lines of TypeScript across 10+ packages |
| API Surface | 40+ REST endpoints with full CRUD operations |
| Real-time | WebSocket integration for live updates |
| UI | Command Center, Investigation View, Development Dashboard, Intelligence, Service Registry and Execution History |
| Infrastructure | Docker + Kubernetes deployment manifests |
| Documentation | Architecture diagrams, API specs, component design docs |
| Testing | Vitest coverage across all core packages |
Every major feature specified is implemented and working, with complete workflow from sentence to production to incident to resolution.
🏆 The Quantified Transformation
| Metric | Before | After | Improvement |
|---|---|---|---|
| Mean Time to Detection | 5-15 minutes | <30 seconds | 10-30x faster |
| Mean Time to Resolution | 1-4 hours | 2-20 minutes | 3-12x faster |
| Human involvement | 100% | 0% (with autonomous mode) | Complete end-to-end automation |
| Documentation delay | Days | Seconds | Instant postmortems |
| Pattern retention | Lost with turnover | Permanent | Institutional knowledge |
| 3 AM wakeups | Regular | Zero | Engineers sleep |
At $14,056 per minute of downtime, reducing MTTR from 2 hours to 20 minutes saving $1.4 million per incident for enterprise environments.
What we learned
1. Gemini 3 Changes Everything About What's Possible
The combination of capabilities in Gemini 3 isn't incremental, it's transformational. We're not talking about a slightly better chatbot. We're talking about capabilities that make entire categories of applications that use to sound like science fiction, possible for the first time.
The 1M token context window means we can load complete incident bundles with 50,000 lines of code, 12 months of incident history, and full runbook documentation in a single prompt. No chunking, no RAG fragmentation, no "sorry, that's outside my context." The AI can reason holistically across the entire problem space.
Spatial-temporal video understanding means AI can now "see" the way humans do. We spent years building threshold-based monitoring systems. Gemini 3 lets us ask: "does this dashboard look concerning?" That's how human experts actually think.
Thought signatures enable true marathon agent behavior. Previous LLMs forgot everything between calls. Now an investigation can span hours while maintaining logical continuity remembering failed hypotheses, building on observations, learning from mistakes.
Tool use is the bridge from "AI that suggests" to "AI that ACTS." ChronosOps doesn't recommend a rollback it executes kubectl rollout undo. This is the Action Era: AI that changes the state of the world, not just describes it.
We couldn't have built this a year ago, because that foundational capabilities simply never existed.
2. Visual AI is Massively Underexplored in DevOps
The entire DevOps industry is focused on metrics and logs, numbers and text. Every monitoring tool queries APIs and applies threshold logic. But that is not how human experts work.
Watch a senior SRE debug a production incident. They don't just check if CPU > 80%. They look at the dashboard. They notice patterns. They see that "the graph looks weird" before any specific metric breaches a threshold. They correlate visual patterns across multiple charts.
Gemini 3's vision capabilities bring that intuitive visual understanding to AI for the first time. ChronosOps can now say: "I notice the error rate graph shows a step-change pattern that correlates with the deployment indicator changing color 2 minutes earlier."
This is a blind spot in the entire industry and it's wide open.
3. Tool Use is the Definition of the Action Era
There's a fundamental difference between:
- AI that suggests: "You should probably roll back the deployment"
- AI that acts: executes
kubectl rollout undo deployment/api
The first is a smarter search engine. The second is an autonomous agent.
ChronosOps crosses this line deliberately. When it decides a rollback is needed, it executes the rollback. When it determines code needs fixing, it modifies the code, commits it to git, builds a new image, and deploys it.
This distinction between suggesting and doing is what separates traditional AI applications from the Action Era. If a prompt can solve your problem, you don't need an app. Apps are for when you need AI to actually change things.
4. Autonomous Self-Healing is Achievable with the Right Architecture
We started skeptical. Can AI really fix production issues without human oversight? Won't it make things worse?
The answer is: yes, it can work with proper guardrails.
The key insights:
- Start safe, escalate gradually: Rollback before restart, restart before scale, scale before code evolution
- Verify every action: Each remediation has success criteria; verify before proceeding
- Maintain reversibility: Git history means any code change can be reverted instantly
- Implement confidence thresholds: Uncertain situations get more thinking time and human review
- Track everything: Full audit trail of what was tried and why
The architecture matters more than the AI capability. Given the right guardrails, autonomous operation becomes safe and effective.
5. Pattern Learning Creates Compound Value
This was the unexpected insight: the system gets better over time.
Every resolved incident adds to the Intelligence Platform:
- Detection patterns for recognizing similar situations faster
- Diagnostic patterns for narrowing root causes
- Resolution patterns for known-good fixes
- Prevention patterns for avoiding recurrence
After handling 100 incidents, ChronosOps knows things that no individual engineer knows. It has seen every variation, every edge case, every surprising correlation.
This is compound interest for operations knowledge. The more incidents it handles, the faster and more accurate it becomes at handling future incidents.
6. The Gap Between Level 3 and Level 5 is a Moat
Every AIOps vendor has AI. They all have ML-powered anomaly detection. They all have "intelligent" alert correlation.
But they all stop at Level 3: AI recommends, human approves.
The gap to Level 5 fully autonomous remediation with code evolution is massive. It requires:
- Vision capabilities (not just metric APIs)
- Stateful reasoning across hours (thought signatures)
- Tool use for real execution (not just suggestions)
- Code understanding and modification
- Safety architecture for autonomous operation
This gap isn't just a feature difference. It's a fundamental capability difference enabled by Gemini 3's unique feature set. That's the moat.
What's next for ChronosOps
Short-term: Expanding the Ecosystem (Q1-Q2 2026)
Multi-Cloud Support Extend beyond Kubernetes to support Azure Container Apps, Google Cloud Run, AWS ECS, and serverless platforms. The core OODA architecture is platform-agnostic, the execution layer adapts to the target infrastructure.
Team Collaboration Integration Real-time investigation updates in Slack and Microsoft Teams. When ChronosOps detects an anomaly, team channels can receive live updates as the AI thinks through the problem. Engineers can observe the investigation in real-time and intervene if needed.
Custom Runbook Import Load existing runbooks and standard operating procedures as context for investigations. ChronosOps will understand your organization's specific playbooks and incorporate them into its remediation decisions.
Enhanced Pattern Matching ML-based similarity scoring for incident patterns. Current pattern matching uses Gemini's reasoning; adding dedicated embedding models will improve pattern recognition accuracy and speed.
Medium-term: Predictive Operations (Q3-Q4 2026)
Predictive Prevention The Intelligence Platform already learns from resolved incidents. The next step is to use those patterns to predict incidents before they occur.
Imagine ChronosOps observing: "The current metric patterns match 73% of conditions that preceded the database connection pool exhaustion incident from October. Recommend proactive scaling."
Prevention is always cheaper than remediation.
Security Incident Response Extending the OODA loop to security events and threat detection. The same architecture that detects and remediates performance incidents can can also detect suspicious activity patterns, correlate security signals, and execute containment actions for compromized systems.
Chaos Engineering Integration Automatically verify self-healing capabilities by triggering controlled failures. ChronosOps can inject faults, observe its own response, and validate that remediation works before real incidents occur.
Multi-Tenant SaaS Hosted offering for teams without infrastructure expertise. Organizations can connect their Kubernetes clusters and monitoring systems without running ChronosOps infrastructure themselves.
Long-term Vision: Self-Improving Infrastructure
ChronosOps represents a new paradigm: infrastructure that improves itself.
Every application deployed through ChronosOps is born with self-awareness:
- Monitoring baked in from day one
- Anomaly detection active immediately
- Remediation capabilities ready
- Code evolution possible when needed
As more applications join the ecosystem, the Intelligence Platform grows smarter. A pattern learned from one application's incident becomes available to all applications. A fix discovered for one service can inform similar fixes and predict re-occurance elsewhere.
This creates a network effect: the entire infrastructure that learns from any single incident.
The future isn't humans fixing machines. It's machines that are capable of fixing themselves and learn to prevent problems before they happen.
ChronosOps Technical Roadmap
| Timeline | Feature | Impact |
|---|---|---|
| Q1 2026 | Multi-cloud execution adapters | 3x deployment target coverage |
| Q1 2026 | Slack/Teams integration | Real-time team visibility |
| Q2 2026 | Custom runbook context | Organization-specific remediation |
| Q2 2026 | Embedding-based pattern matching | Faster pattern recognition |
| Q3 2026 | Predictive anomaly forecasting | Prevent incidents before they occur |
| Q3 2026 | Security incident OODA loop | Unified observability and security |
| Q4 2026 | Chaos engineering integration | Validated self-healing guarantees |
| 2027 | Multi-tenant SaaS platform | Democratized access |
The Bigger Picture
The AIOps market is valued at $1.87 billion and projected to reach $8.64 billion by 2032. But current tools are stuck at Level 3 autonomy they recommend, humans approve. ChronosOps demonstrates that Level 5 is achievable today, with the right AI capabilities and safety architecture. As Gemini 3 and future models continue improving, the gap between what's possible and what's deployed will only widen.
We're not building a feature for the current market. We're building the architecture for the next generation of IT operations.
This is the Action Era. This is ChronosOps.

Log in or sign up for Devpost to join the conversation.