Note: This is simply our TLDR to save your time (Oxhacks theme pun intended!), not in markdown. For a comprehensive about, please refer to our README file in our GitHub!
Now let me ask you a question that politicians, analysts, and businessmen all over the world are asking right now: can shipping companies minimise costs when major maritime routes are disrupted?
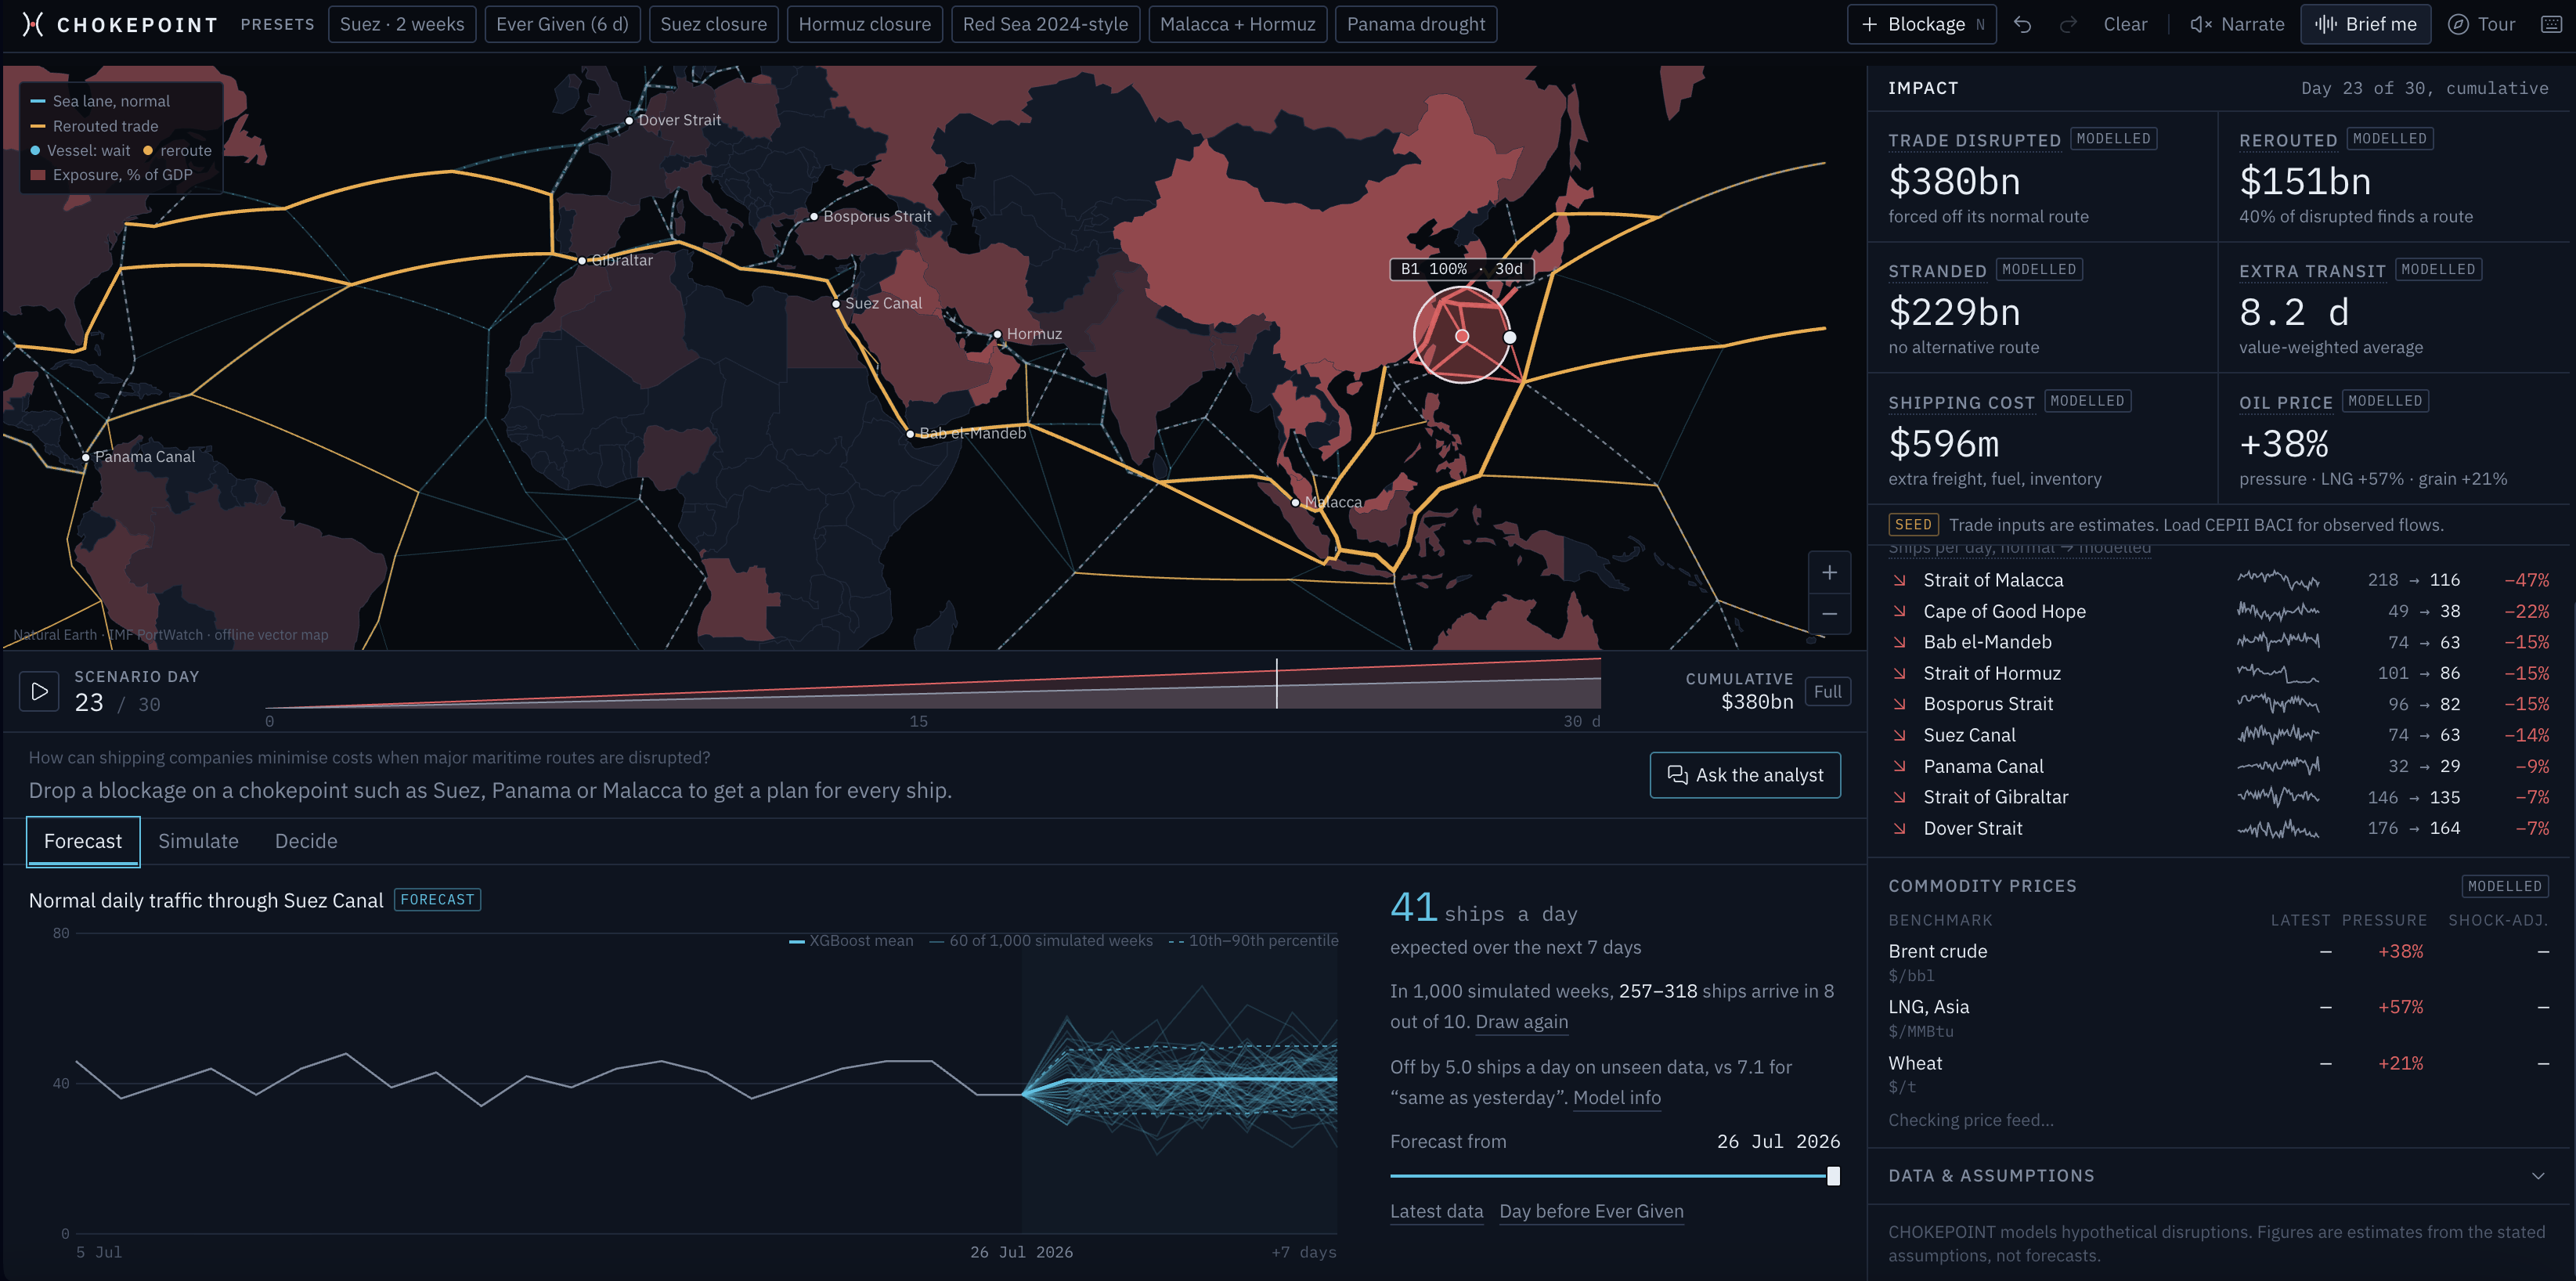
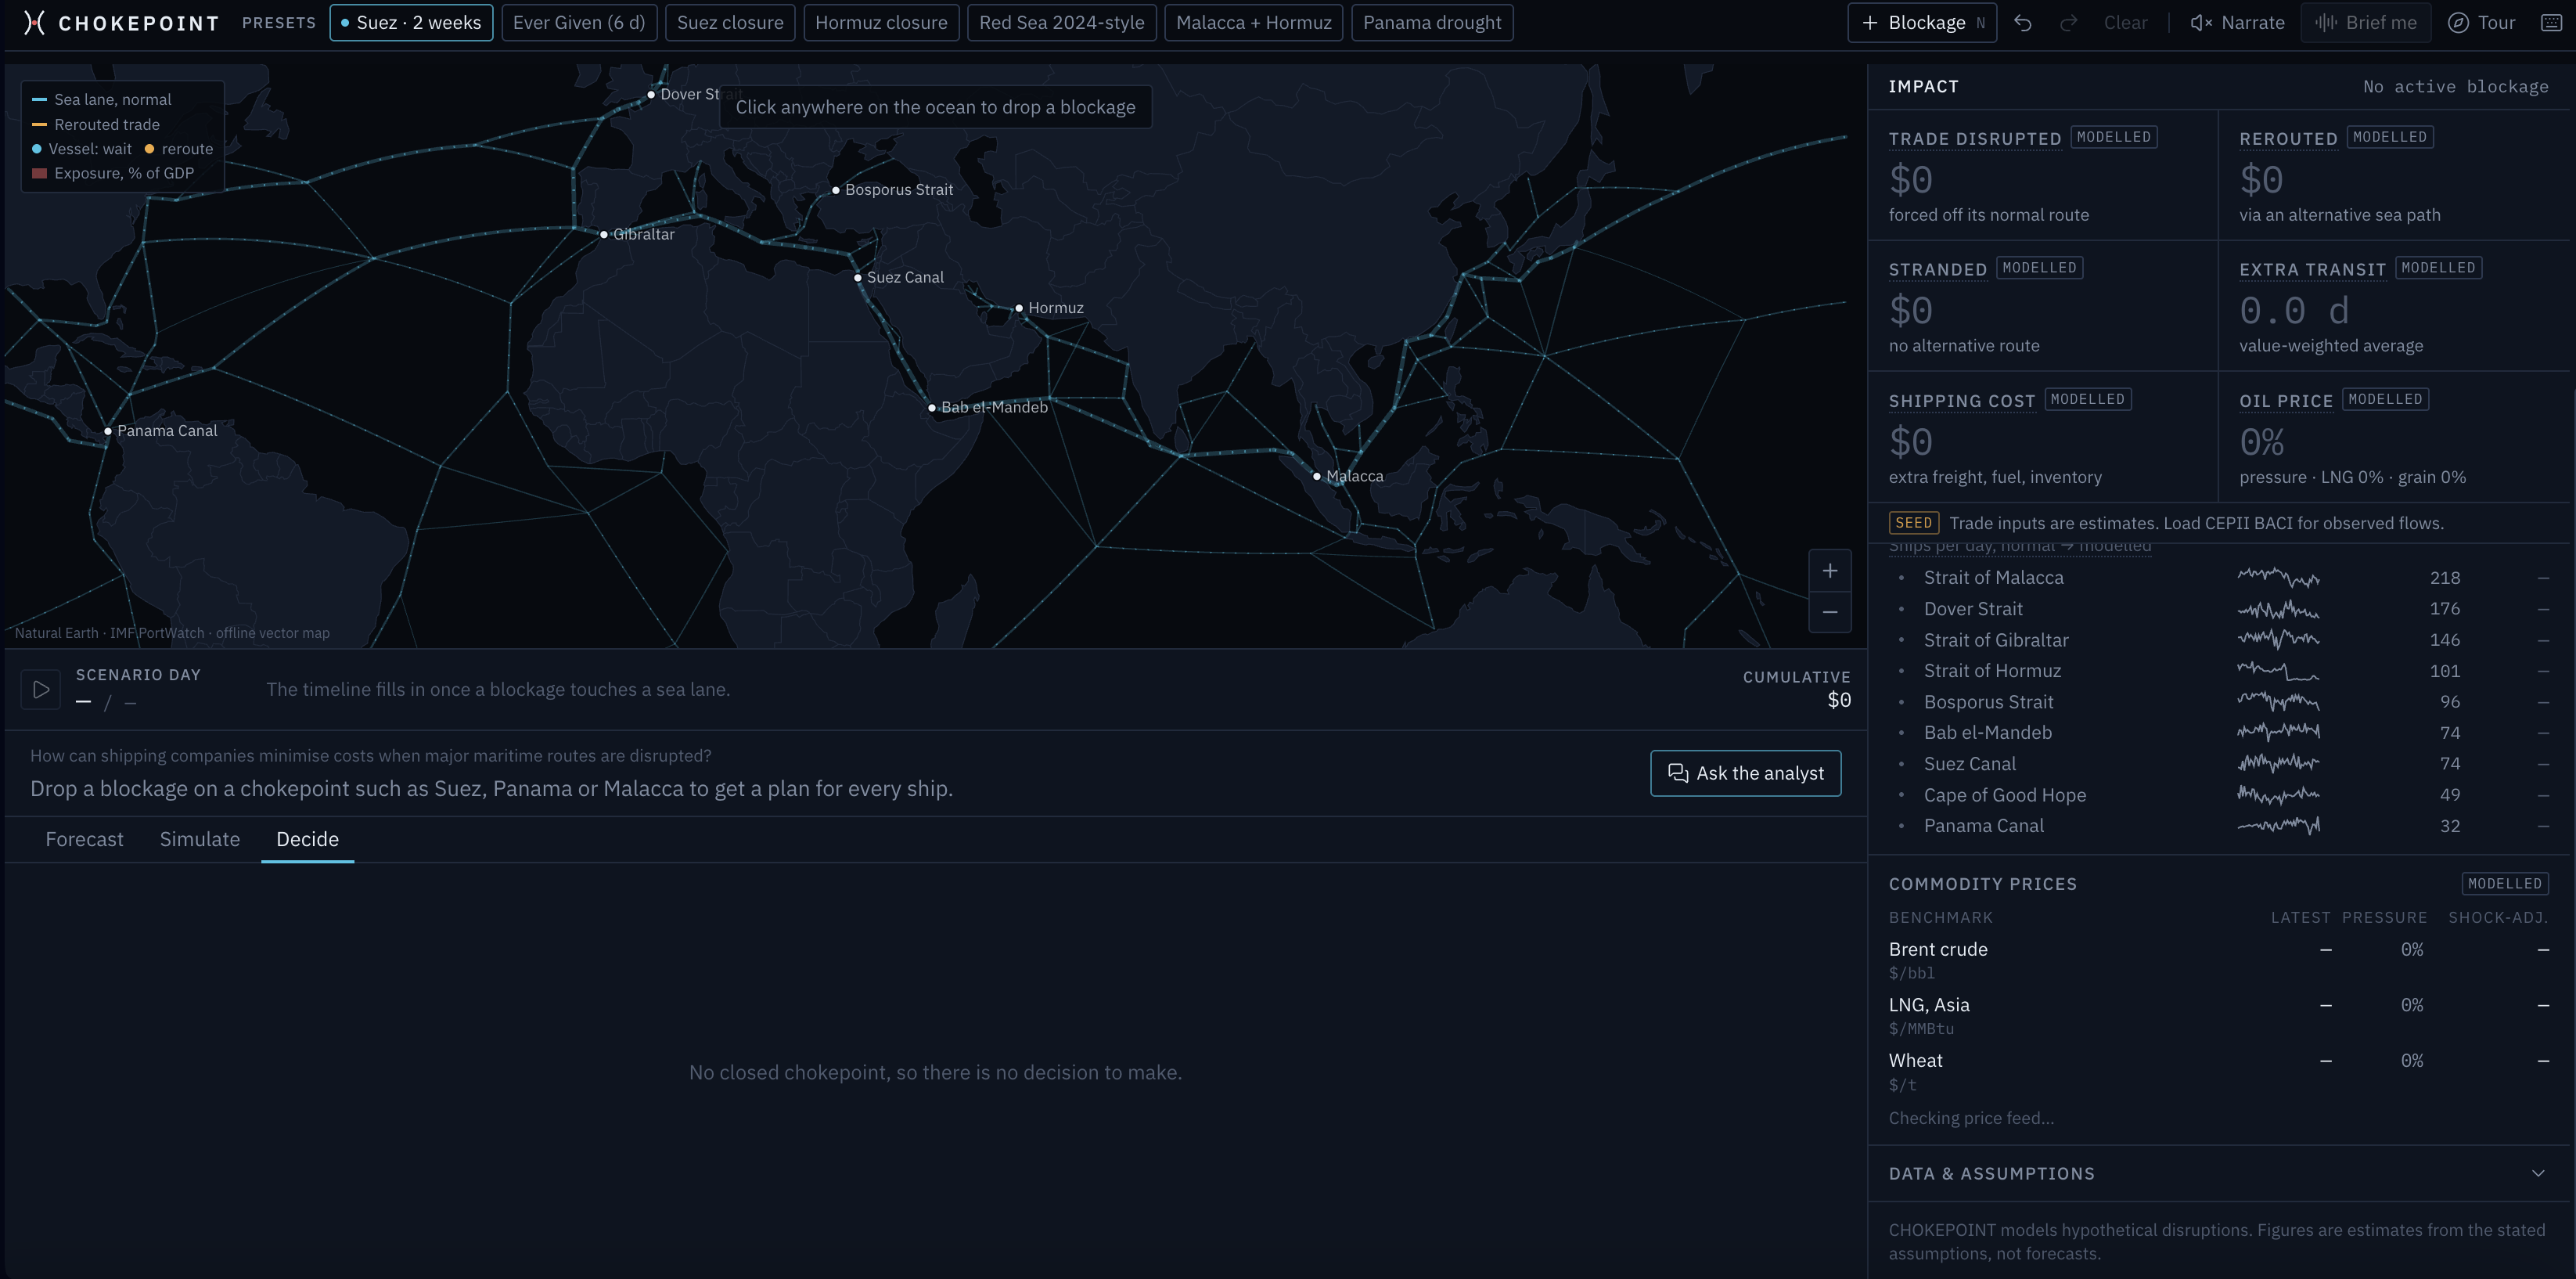
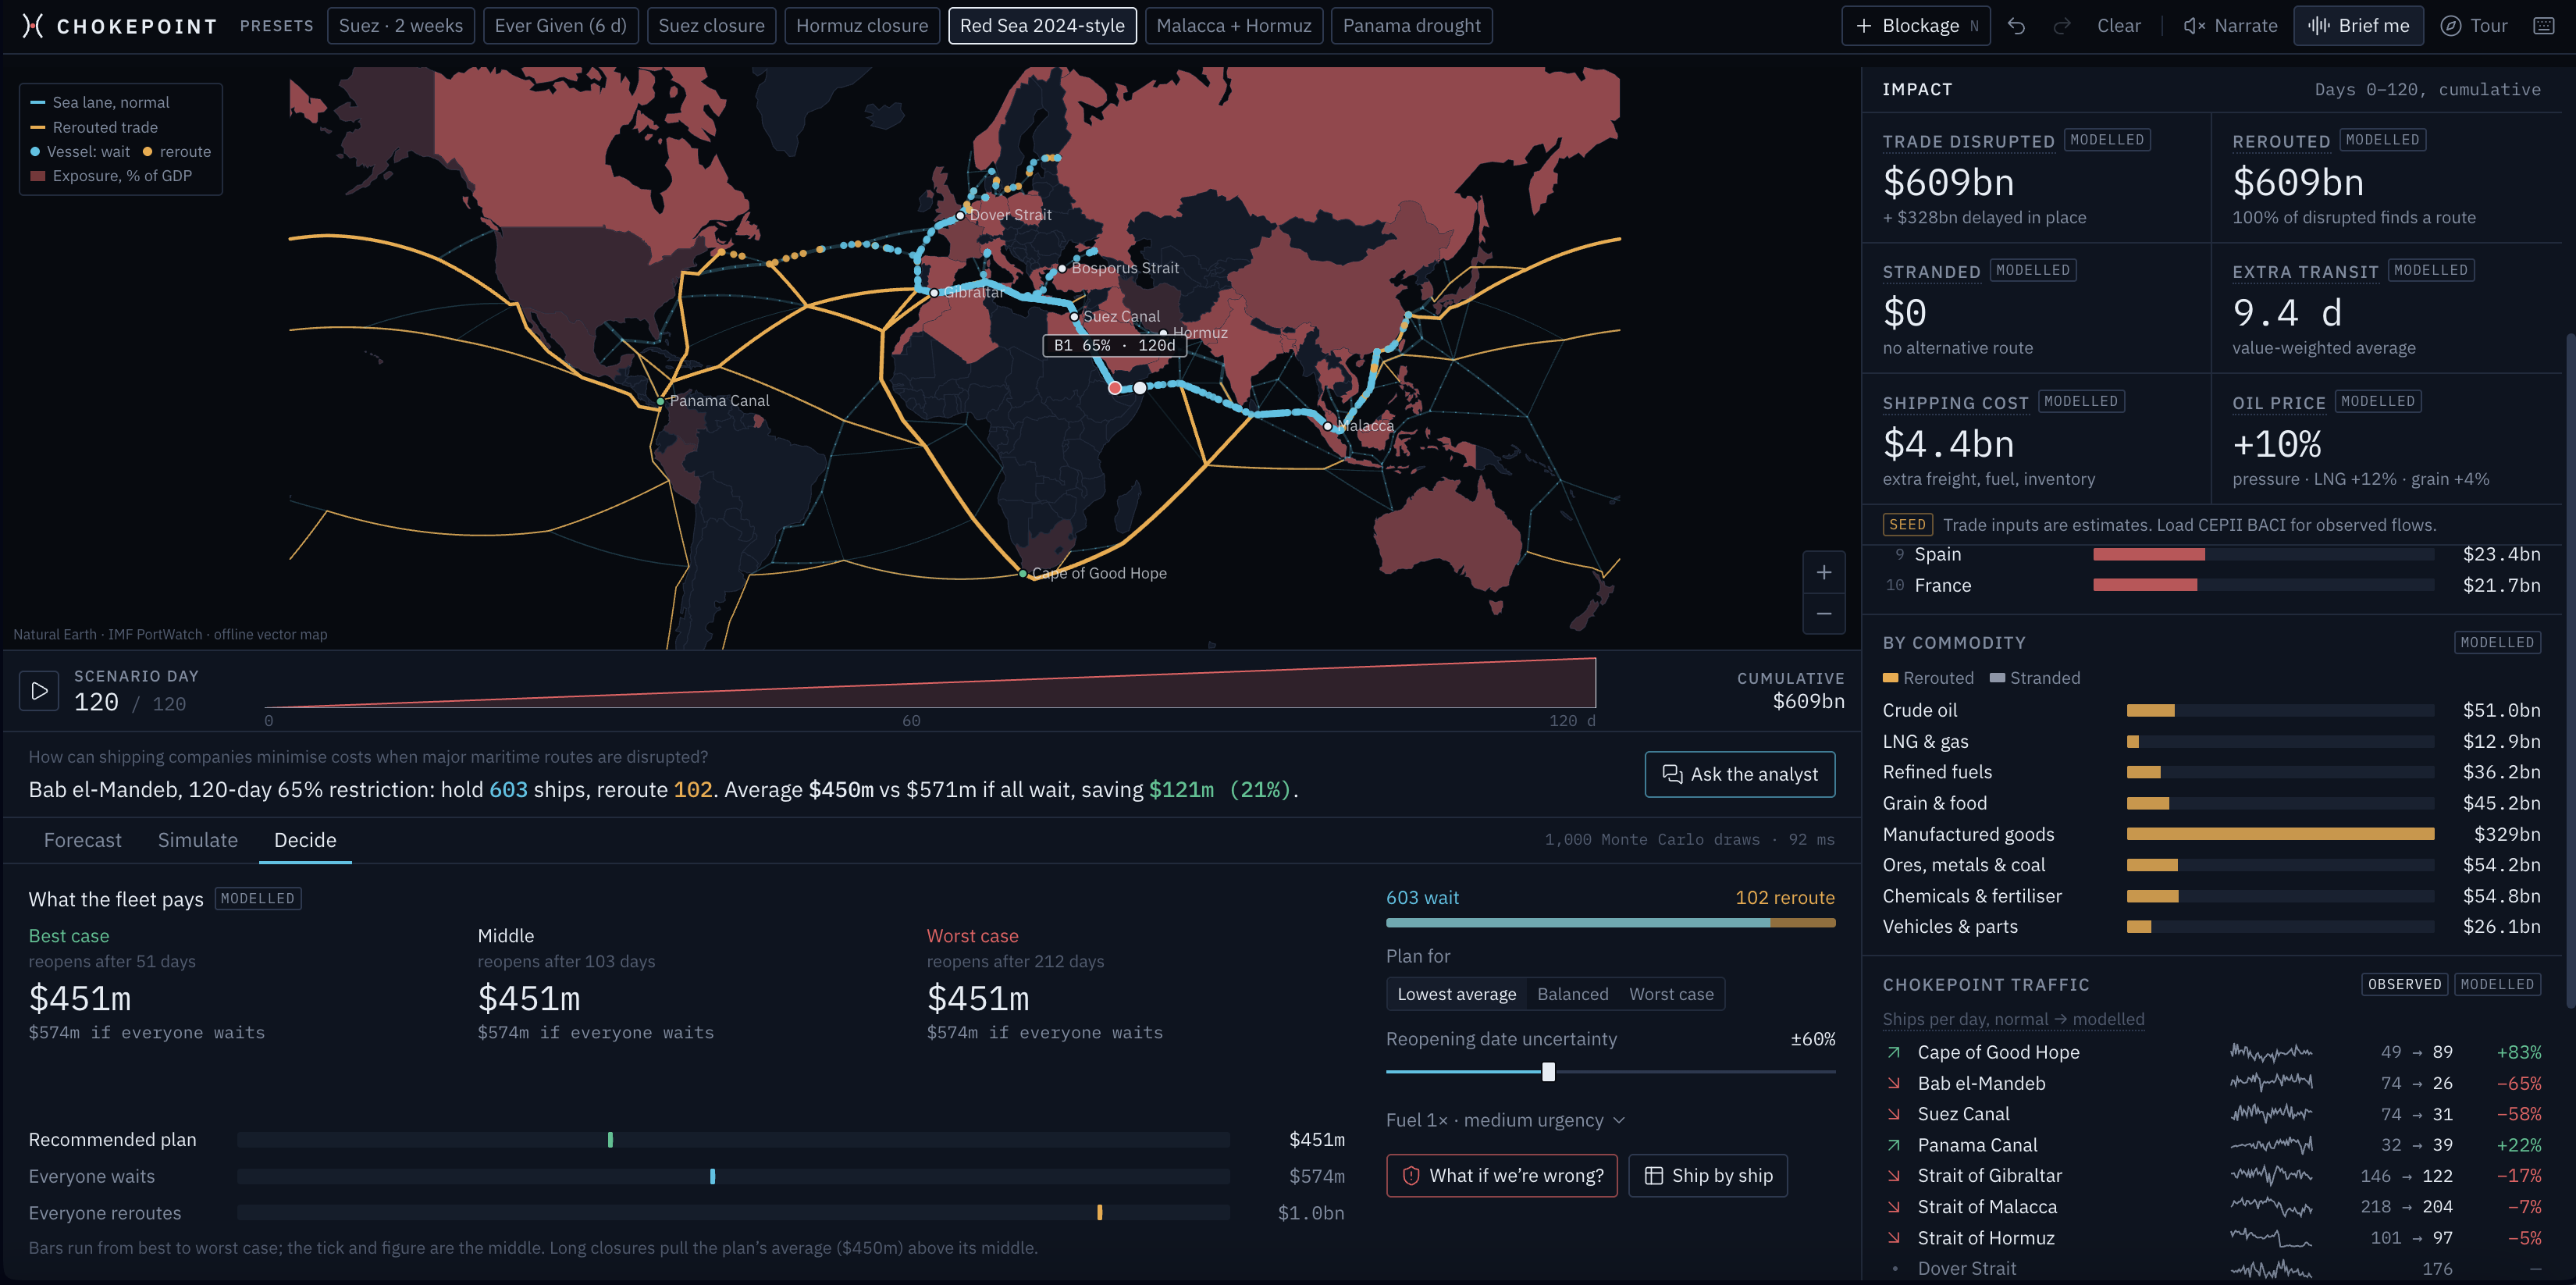
CHOKEPOINT lets you close any shipping route in the world and see what happens. You drop a blockage on the map, set how severe it is and how long it lasts, and it works out which countries and commodities get hit, how far ships have to detour, and what it does to oil, LNG and grain prices. For the ships themselves, it tells each one due at the blocked canal over the next three weeks whether it should wait in the queue or go the long way round.
Time is the whole problem we built around. A ship at a closed canal has to choose between waiting, which costs money every day, and rerouting, which costs a fixed amount up front. Which one is cheaper depends entirely on how long the closure lasts, and nobody knows that in advance. So we forecast normal traffic with an XGBoost model trained on seven years of IMF PortWatch data (it lands almost exactly on the statistical noise floor for Suez), simulate the queue using a model fitted to the real Ever Given blockage in 2021, and run 1,000 possible reopening dates through a Monte Carlo optimiser. In a two-week Suez closure, the plan saves about $107m (14%) compared to every ship just waiting, and the timeline lets you scrub day by day and watch the costs build up.
Gemini runs an analyst inside the app that you can ask questions in plain English, like “why are these ships being rerouted?” or “what if it lasts another week?”. It can only answer using the model’s own numbers, so it can’t make things up. ElevenLabs reads the answers aloud with a word-by-word transcript, which also makes the tool accessible to people who’d rather listen than read. The whole thing is hosted on Vultr.
Right now it’s an MVP with some synthetic inputs, and we’re upfront about that in the app (every number is labelled observed, forecast, modelled or simulated). The vision is a stress-testing tool for commodity traders, macro funds and risk teams: plug in real vessel tracking, your own positions or supply chain, and see how exposed you are to a Hormuz or Suez closure before it happens rather than after.
It also works as a teaching tool. For PPE, economics, politics and IR students, it turns things like trade dependence, energy security and the economic weight of a strait into something you can actually play with. Close Hormuz and you can see why Japan and South Korea care so much about the Gulf, or drop a blockage on the Red Sea and watch the 2024 crisis play out again.


Log in or sign up for Devpost to join the conversation.