Inspiration
The test set is made of facilities the model has never seen, in a later period. With 81 training facilities, a random split would let a model memorise each site and report a score it could never reach on the leaderboard. I wanted to find out how much of the signal actually transfers to a new facility, and to be able to say which number I trust and why.
What it does
It predicts five standardised atmospheric targets (CH4, NO2, CO, absorbing aerosol index, FIRMS fire activity) for each observation window, from 29 tabular features and one 14-band Sentinel-2 chip, scored by masked MCRMSE.
- 160 chip statistics instead of a pretrained network: band quantiles, centre-minus-ring contrast, spectral indices (NDVI, NDWI, NDBI, NBR, a thermal anomaly index), SWIR hot-spot fractions, scene-class fractions and texture. Each family has a physical reason to exist.
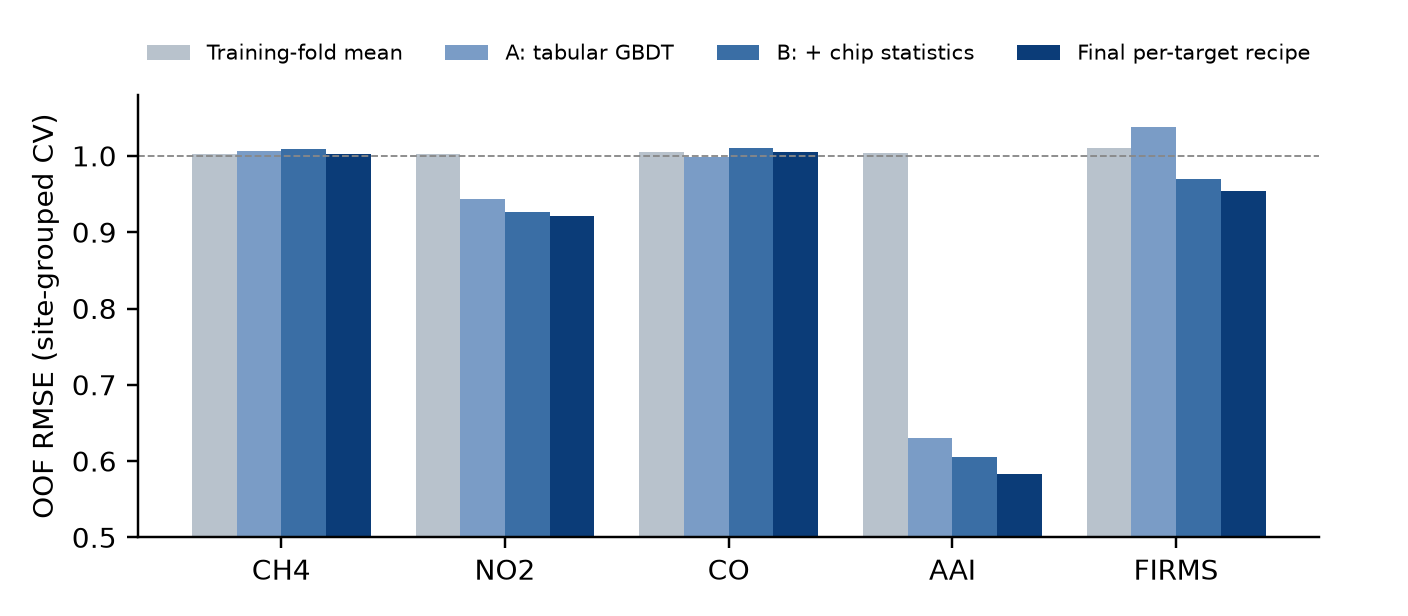
- One model per target. Regularised LightGBM for NO2 and FIRMS, a 0.6/0.4 LightGBM + ridge blend for the aerosol index, and the plain training mean for CH4 and CO, because nothing beat the mean across facilities.
- Result. Facility-grouped CV MCRMSE went from 1.005 (mean baseline) to 0.923 (tabular boosting), 0.905 (with chip statistics) and 0.894 for the final recipe, or 0.898 when the recipe selection is nested inside the folds. Public leaderboard: 1.180 → 1.091 → 1.080 (as of 19 Nov 2026, provisional).
How I built it
Python, LightGBM and scikit-learn on a laptop CPU; the whole pipeline runs in about 25 minutes with no GPU.
- Validation first.
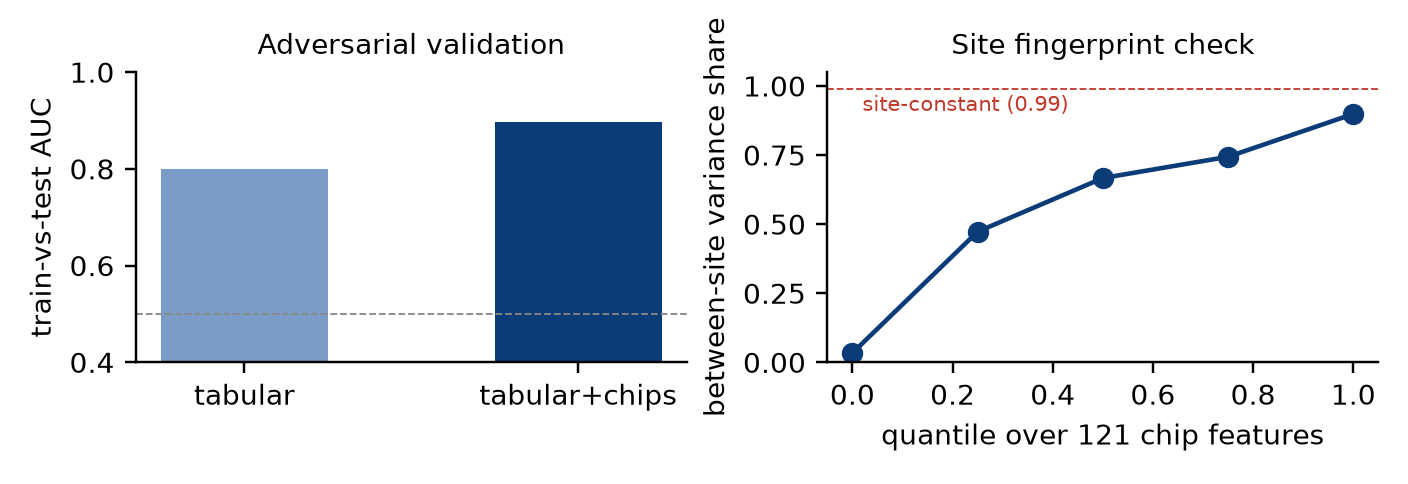
GroupKFold(5)by facility, out-of-fold masked MCRMSE, and early stopping on 20% of the training facilities so validation rows never set the number of boosting rounds. Every comparison uses the same folds. - Leakage audit. Elevation and slope are constant within a facility, so they work as facility fingerprints; I removed them and grouped CV improved (0.926 → 0.923). For every chip feature I measured the share of variance that lies between facilities: the maximum is 0.90, none is site-constant.
- Chip features with tifffile, NumPy and SciPy. Statistics are computed on clear pixels (scene classification + cloud probability), except hot spots, which use all valid pixels because a flare is not a cloud.
- Nested selection. Mean-vs-model choices and blend weights are picked on four folds and scored on the fifth, so the reported number pays for its own selection.
Challenges I ran into
- CV and leaderboard disagree by a lot. The tabular model scored 0.923 in CV and 1.180 on the public board. An adversarial classifier (train vs test, grouped by facility) explained it: AUC 0.80 on tabular features and 0.90 with chips. The shift is real, and the data has no date column, so a time-based split cannot be built to measure it.
- A blend that looked best was noise. A free three-member blend of six models scored 0.886 in-sample but 0.899 nested, no better than a single model. I dropped it.
- Two targets would not move. For CH4 (35% observed) and CO, boosting stopped after 16 to 32 rounds and never beat the mean, with tabular or chip features.
Accomplishments that I'm proud of
- The public leaderboard ranks the four submitted chip recipes in the same order as CV (1.095, 1.091, 1.083, 1.080), without the leaderboard being used for any choice.
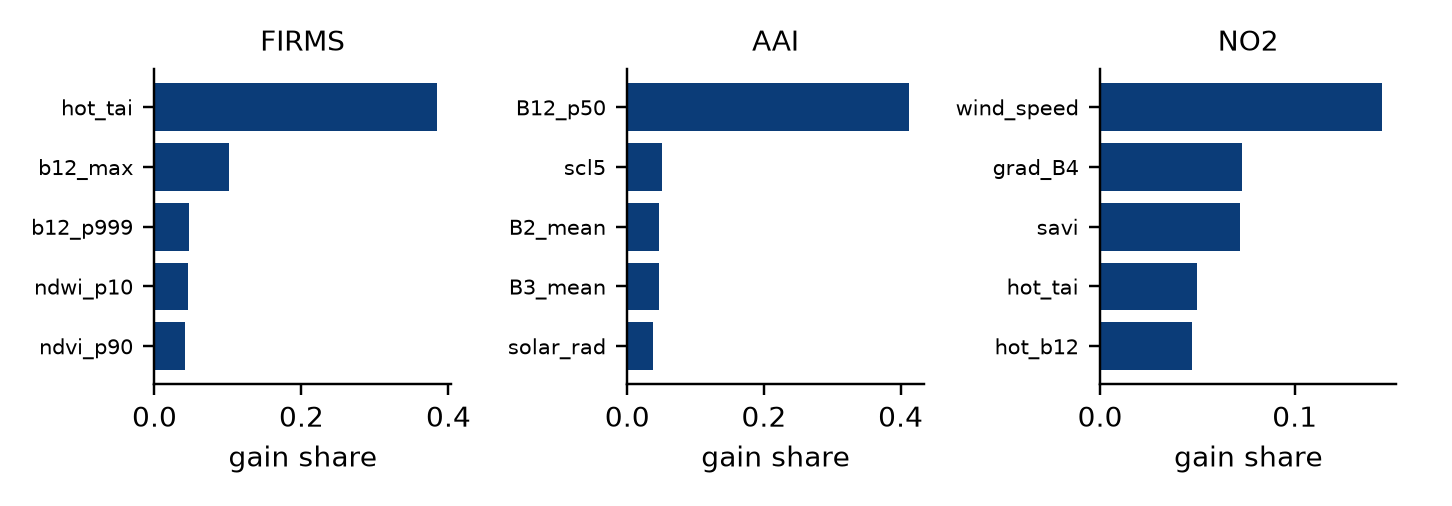
- The strongest features are readable: the fraction of SWIR thermal-anomaly pixels carries 38% of the gain for the fire target, and median SWIR-2 reflectance 41% for the aerosol index.
- The report states the negative results (cross-target stacking, shrinkage toward the mean, free blending) with their numbers.
What I learned
- Fold standard deviations here are 0.05 to 0.25 per target, so a 0.003 to 0.01 gain in MCRMSE means nothing alone. I kept such changes only when most folds and targets moved the same way.
- Predicting the mean is a legitimate model. Replacing two learned targets with the mean improved both CV and the public score.
- Removing features can help more than adding them when the test set is a different set of sites.
What's next
- A two-part FIRMS model (is there a hot spot, then how large), compared nested like everything else.
- CH4 remains unsolved at chip level; plume-shaped SWIR features around the facility centre are the next thing to test.
- Check whether the CV-to-leaderboard gap shrinks when training rows are reweighted with the adversarial classifier.
Submission details
- Kaggle: individual entry, team name
COO(username ilikecoo), profile https://www.kaggle.com/ilikecoo - Devpost project: https://devpost.com/software/chip-statistics-for-cross-site-atmospheric-prediction
- Research write-up: attached PDF: validation design and leakage audit, methods, full experiment table, findings, limitations.
- Code: https://www.kaggle.com/code/ilikecoo/obscura-chip-stats-site-grouped-cv-code-only (code only; no competition data, identifiers, predictions or cell outputs)
- Reproducibility: Python 3.14, NumPy 2.5.5, pandas 3.1.1, SciPy 1.18.1, scikit-learn 1.9.1, LightGBM 4.7.0, tifffile 2026.11.16; seeds 42, 7, 2026; CPU only. Run order and the commands for both final CSVs are in section 7 of the PDF and in the notebook.
- Rules: no external data, no pretrained models, no facility identification; the facility key and sample id are never features and test rows are never grouped. Competition data stayed on the local machine.
- AI assistance: an AI coding assistant (Anthropic Claude) helped write and refactor the scripts and draft the report under my direction. It saw code and aggregate scores only.
Built With
- lightgbm
- matplotlib
- numpy
- pandas
- python
- scikit-learn
- scipy
- tifffile
