-
-
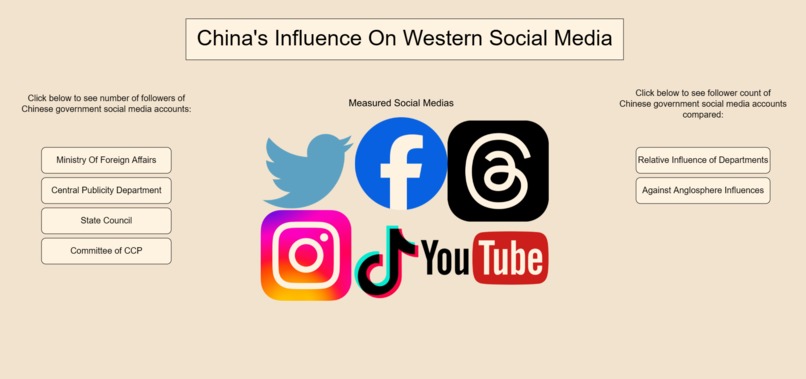
Our website homepage (https://rickshaltzv2.github.io)
-
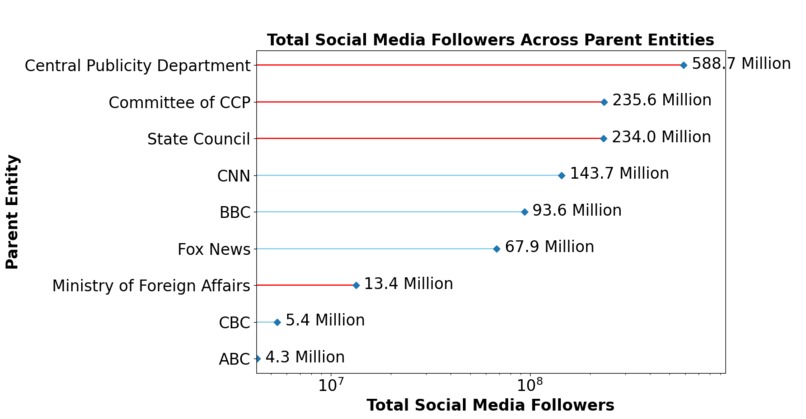
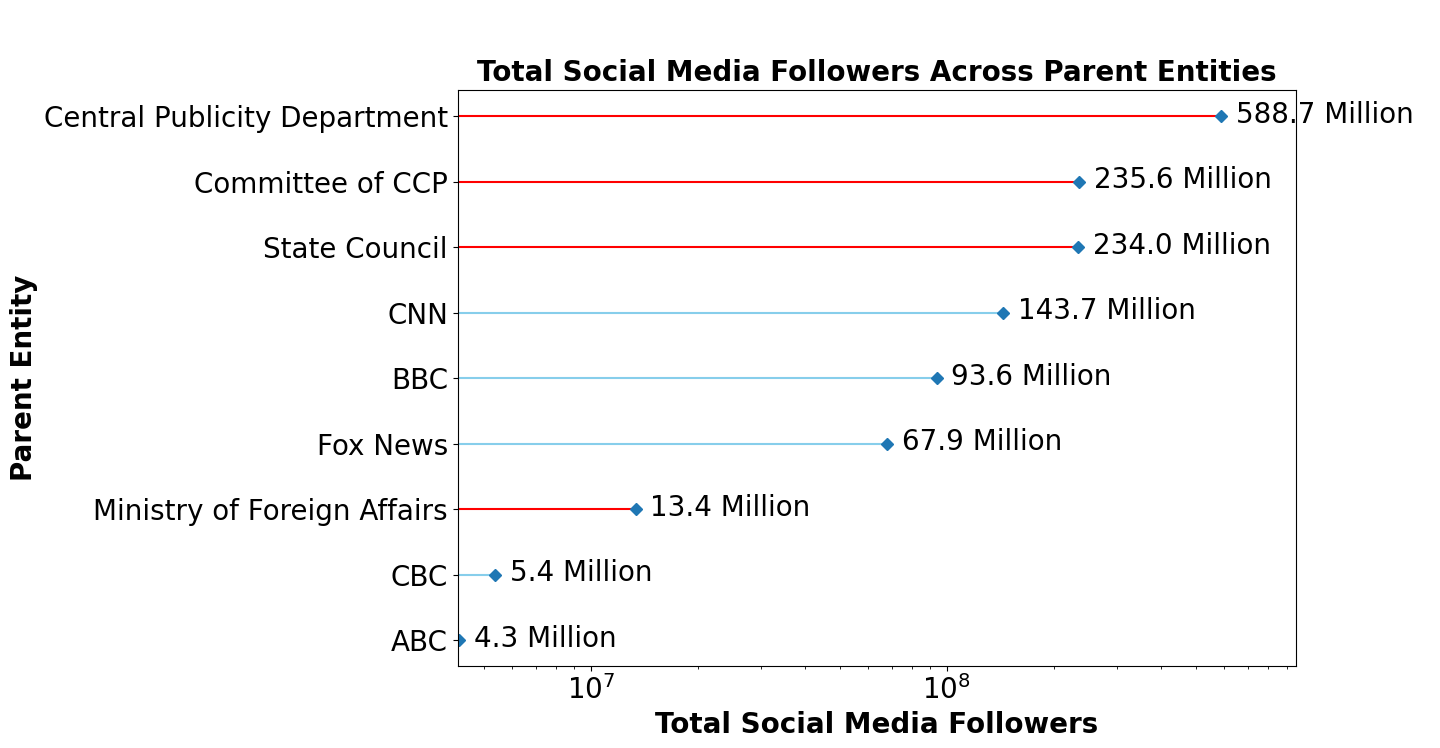
Total Social Media Followers Across Parent Entities and Media Organisations
-
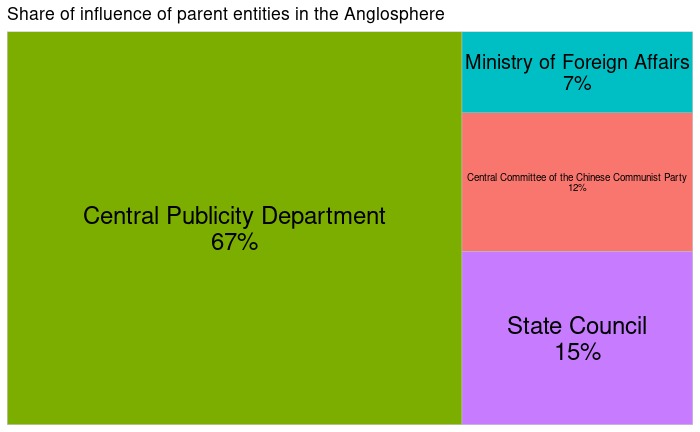
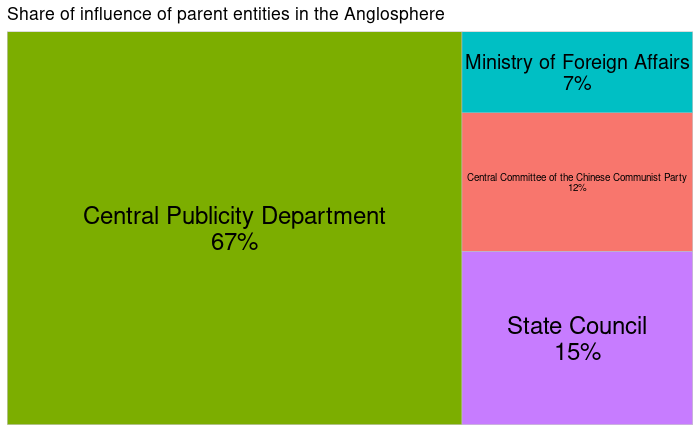
Share of influence of parent entities in the Anglosphere
-
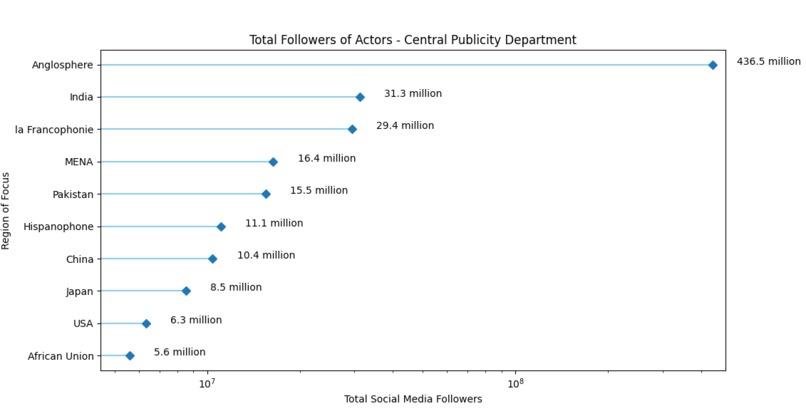
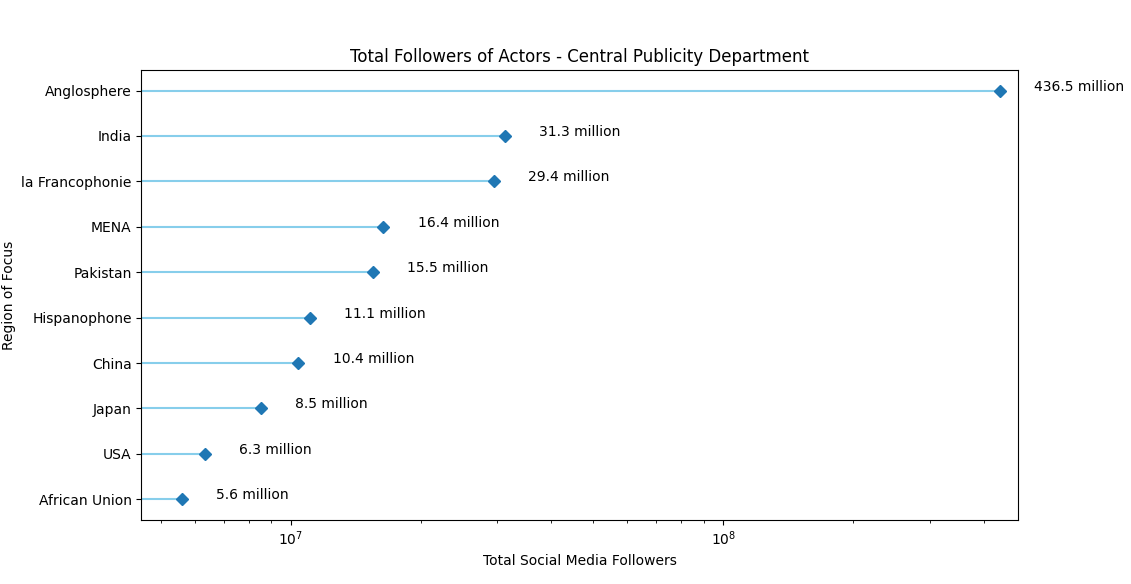
Regional Breakdown of Followers for Central Publicity Department

Inspiration
We were curious and wanted to investigate the hidden presence of influence exerted by Chinese-controlled social media accounts
What it does
Our project is an analysis of the 4 largest parent entities in the dataset(Ministry of Foreign Affairs, Central Publicity Department, State Council, Central Committee of the Chinese Communist Party) For each entity, it shows a breakdown of the follower numbers of actors targeting the various regions of focus. It also compares the follower numbers of these entities to those of major English speaking news channels.
How we built it
We built the project in JavaScript using p5js and hosted it on a Github.io page. The graphs were obtained from using Python (with libraries Pandas and Matplotlib) as well as R (with libraries dplyr, ggplot2, treemapify,tidyverse).
Challenges we ran into
Some challenges we ran into were trying to obtain useful information from the social media platforms. The api for Facebook and Twitter made it difficult to access the information we wanted. As a result, I feel like our insights may not be as useful as we initially wanted them to be. Additionally, we are missing data on Anglosphere social media entities, so we cannot accurately compare the two.
Also, since our website was coded purely with JavaScript, we had alignment and resizing issues when it came to different operating systems and screen aspect ratios.
Accomplishments that we're proud of
We are proud of the website, and the data visualizations that we made! The data visualizations give insightful information, while the website gives an organized view that displays the data visualizations we created.
What we learned
We learned about techniques for cleaning and preparing data for visualization, dealing with missing values and outliers. Furthermore, we learned to decide how to choose the right visualization for different types of data.
We also learned that for building website applications, it would be more favourable to implement them with html and css instead of pure javascript due to resizing issues and scalability.
What's next for China Unveiled: The Secret Social Media Giant
Given more time, we would definitely dig deeper into social media APIs and obtain more information on their post cycles, like counts, follower gains, and whether or not their posts have influences on real world events. Also, we would like to gather more information on western media outlets in order to more accurately compare them to the Chinese government owned accounts, as currently, we only have a rough estimate since we are lacking data.
As for the website itself, I would have liked to make the maps in each section heat maps, so that they change color depending on how many followers the entity has from that region of the world. Unfortunately, there was not enough time to implement that with our setup.
Trying it out
Use the first GitHub repo link to access our code for analysing and plotting the data. The second link is to our website where all of the findings and reports can be seen. The last link is to the Github repo for creating our website. Enjoy!


Log in or sign up for Devpost to join the conversation.