Inspiration
Every day, thousands of commuters use Chennai Metro without any way to know how crowded a station will be until they physically arrive. Unlike some global metro systems, Chennai Metro Rail Limited (CMRL) doesn't publish any public real-time or historical ridership data — so there's no way for a commuter to plan around rush-hour crowding, and no way for operators to anticipate pressure points across the network.
As someone building toward a career in AI/ML and full-stack engineering, I wanted to tackle a problem that was both technically substantial and genuinely useful to people in my own city — not just a toy dataset exercise, but a full system someone could actually use.
What it does
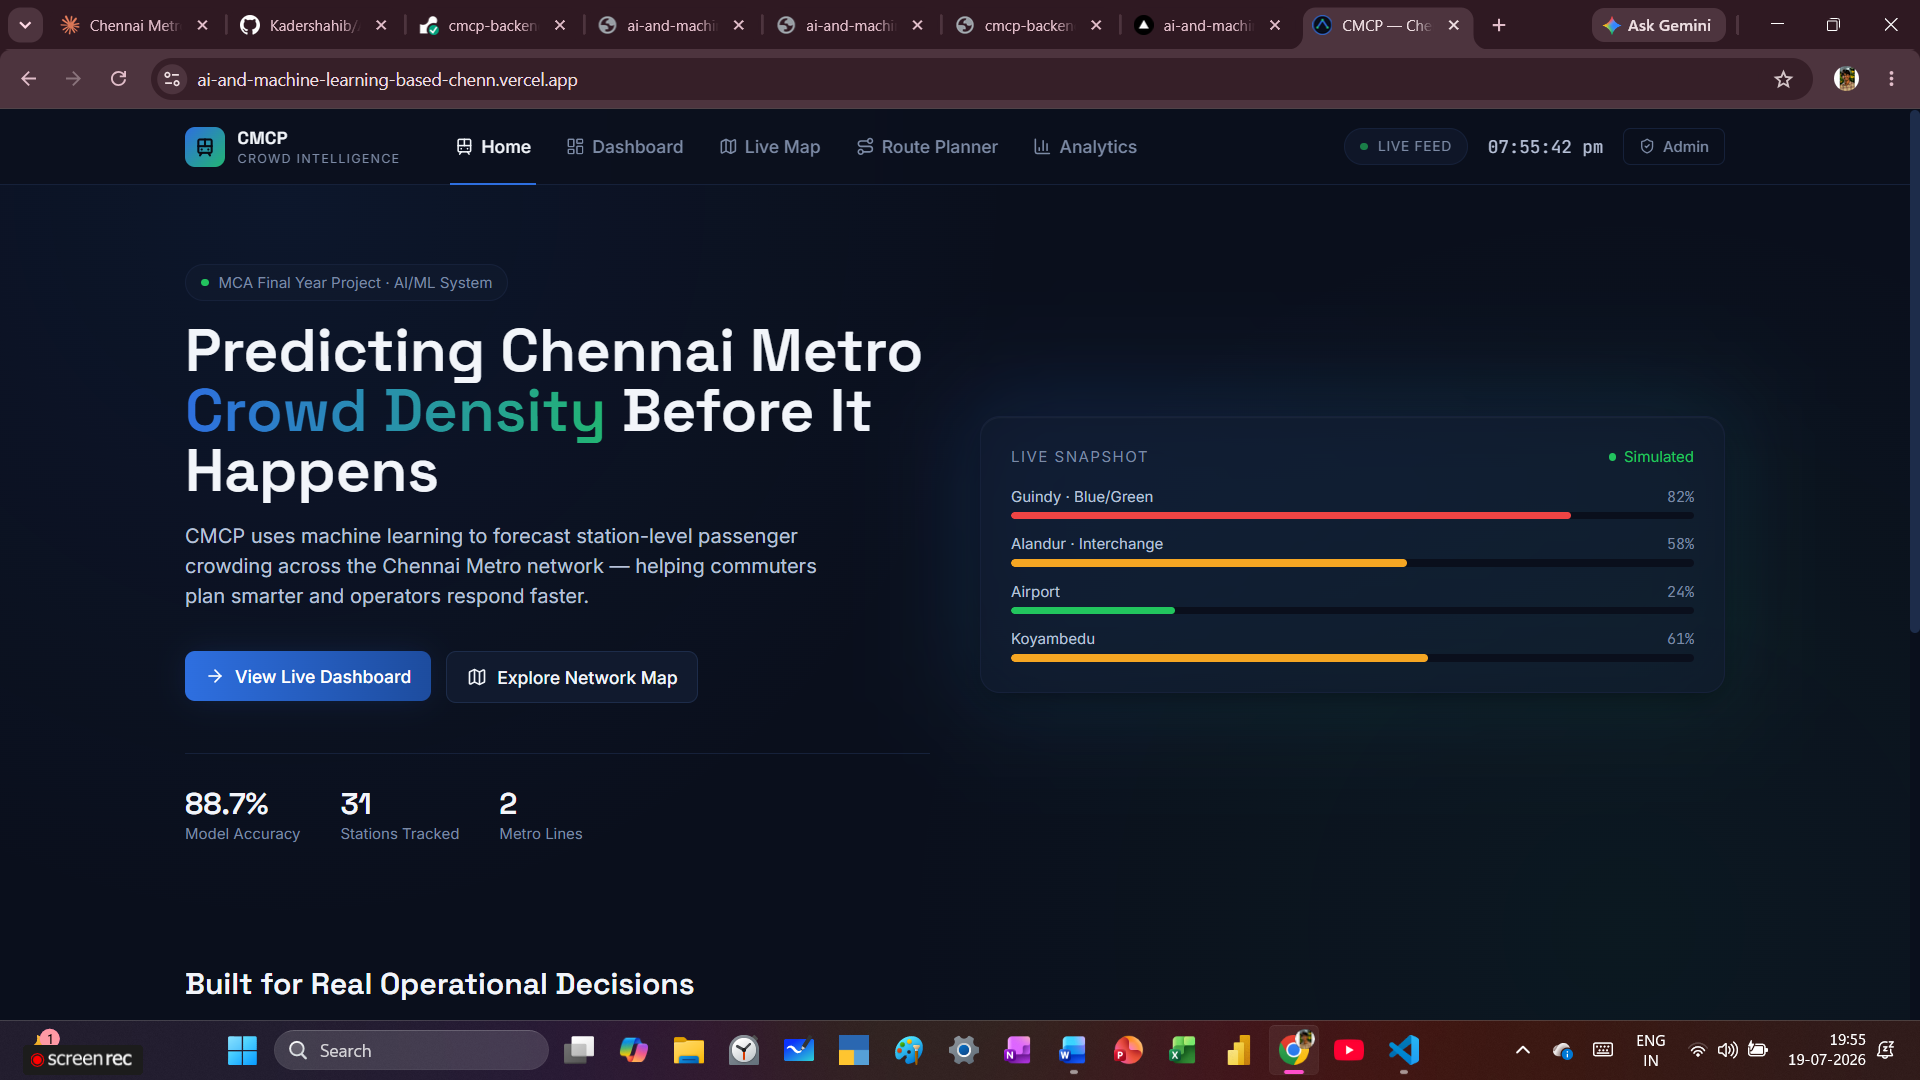
CMCP (Chennai Metro Crowd Prediction System) predicts passenger crowd density — Low, Medium, or High — for any of Chennai Metro's 31 stations across both the Blue and Green lines, for any hour of the day. Beyond the prediction itself, it:
- Shows a live operations dashboard with an animated schematic metro map, color-coded by predicted crowd level
- Renders a real geographic map (Leaflet + OpenStreetMap) of the actual metro network
- Includes a smart route planner that recommends the best time window to travel between any two stations to avoid crowds
- Explains why each prediction was made using SHAP, instead of being a black box
- Runs a live simulation layer that pushes fresh predictions every 15 seconds via Socket.IO
- Has a lightweight admin panel for monitoring model and system status
How we built it
CMCP is a three-tier system:
- Machine Learning (Python/Flask) — Since no real ridership data exists publicly, I generated a synthetic dataset of 69,120 records modeled on realistic patterns: morning/evening peak hours, weekday vs. weekend variation, interchange station surges, IT-corridor office-hour spikes (Guindy, Alandur, Vadapalani), and festival-day demand. I trained an XGBoost classifier on this data, reaching 88.7% accuracy, and integrated SHAP so every prediction comes with an explanation of which factors drove it.
- Backend (Node.js/Express) — Handles REST APIs, JWT-based admin authentication, PostgreSQL persistence via Prisma, and a Socket.IO layer that broadcasts live crowd updates.
- Frontend (React + TypeScript) — A dashboard, live map, route planner, and analytics view, styled with Tailwind CSS and Framer Motion, using Apache ECharts for the data visualizations.
The whole system is deployed live: frontend on Vercel, backend and ML service on Render, and the database on Neon Postgres — so it's a real, running system rather than a local demo.
Challenges we ran into
The model and UI were, honestly, the easier parts. Deployment surfaced the hardest bugs:
- Render defaulted to Python 3.14, which had no pre-built wheel for pandas, triggering a full source compile that failed. Pinning
PYTHON_VERSION=3.11.9fixed it. - After deploying the ML service,
/healthreportedmodel_loaded: false. The root cause: my Flask app only calledload_artifacts()insideif __name__ == "__main__":, which gunicorn never executes in production — it just imports the app object. The fix was moving the model load to run at import time. - A separate bug let an unhandled Axios timeout from a slow ML service crash the entire Node backend process, since the error wasn't caught. I added try/catch blocks around every ML API call, plus global
unhandledRejection/uncaughtExceptionhandlers as a safety net so a downstream hiccup never takes down the whole service again.
Each of these taught me that "it works on my machine" and "it works in production" are genuinely different engineering problems.
Accomplishments that we're proud of
- Achieved 88.7% model accuracy with balanced precision/recall across all three crowd classes
- Built and shipped a fully deployed, end-to-end working system — not just a local prototype — across four different platforms (Vercel, Render ×2, Neon)
- Integrated SHAP explainability so the model's reasoning is transparent, not a black box
- Designed a distinctive, cohesive UI themed around Chennai Metro's actual Blue and Green line identity
What we learned
Building the model was maybe 30% of the actual work. The rest — environment configuration, production vs. development execution differences, error handling that survives real-world network hiccups — is where most of the real engineering learning happened. I also learned to be transparent about methodology: since real ridership data isn't publicly available, I documented my synthetic data generation approach clearly rather than hiding that limitation.
What's next for CMCP
- Integrating authentic CMRL ridership data if it ever becomes publicly available
- Adding an LLM-based chatbot for natural-language crowd queries ("Is Guindy crowded right now?")
- A mobile app version
- An automated retraining pipeline as new prediction logs accumulate

Log in or sign up for Devpost to join the conversation.