-
-

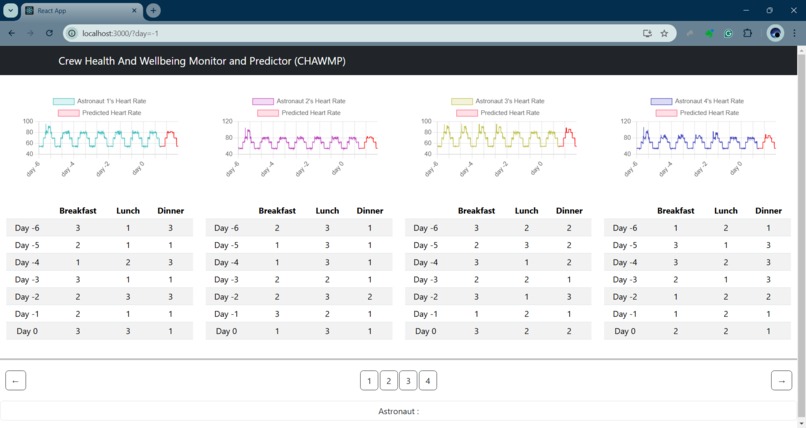
Heart rate and meal data
-
Heart rate and meal data on a different day
-
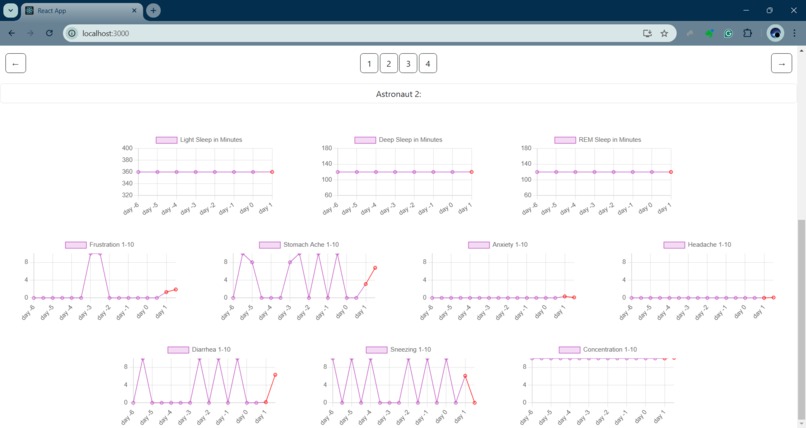
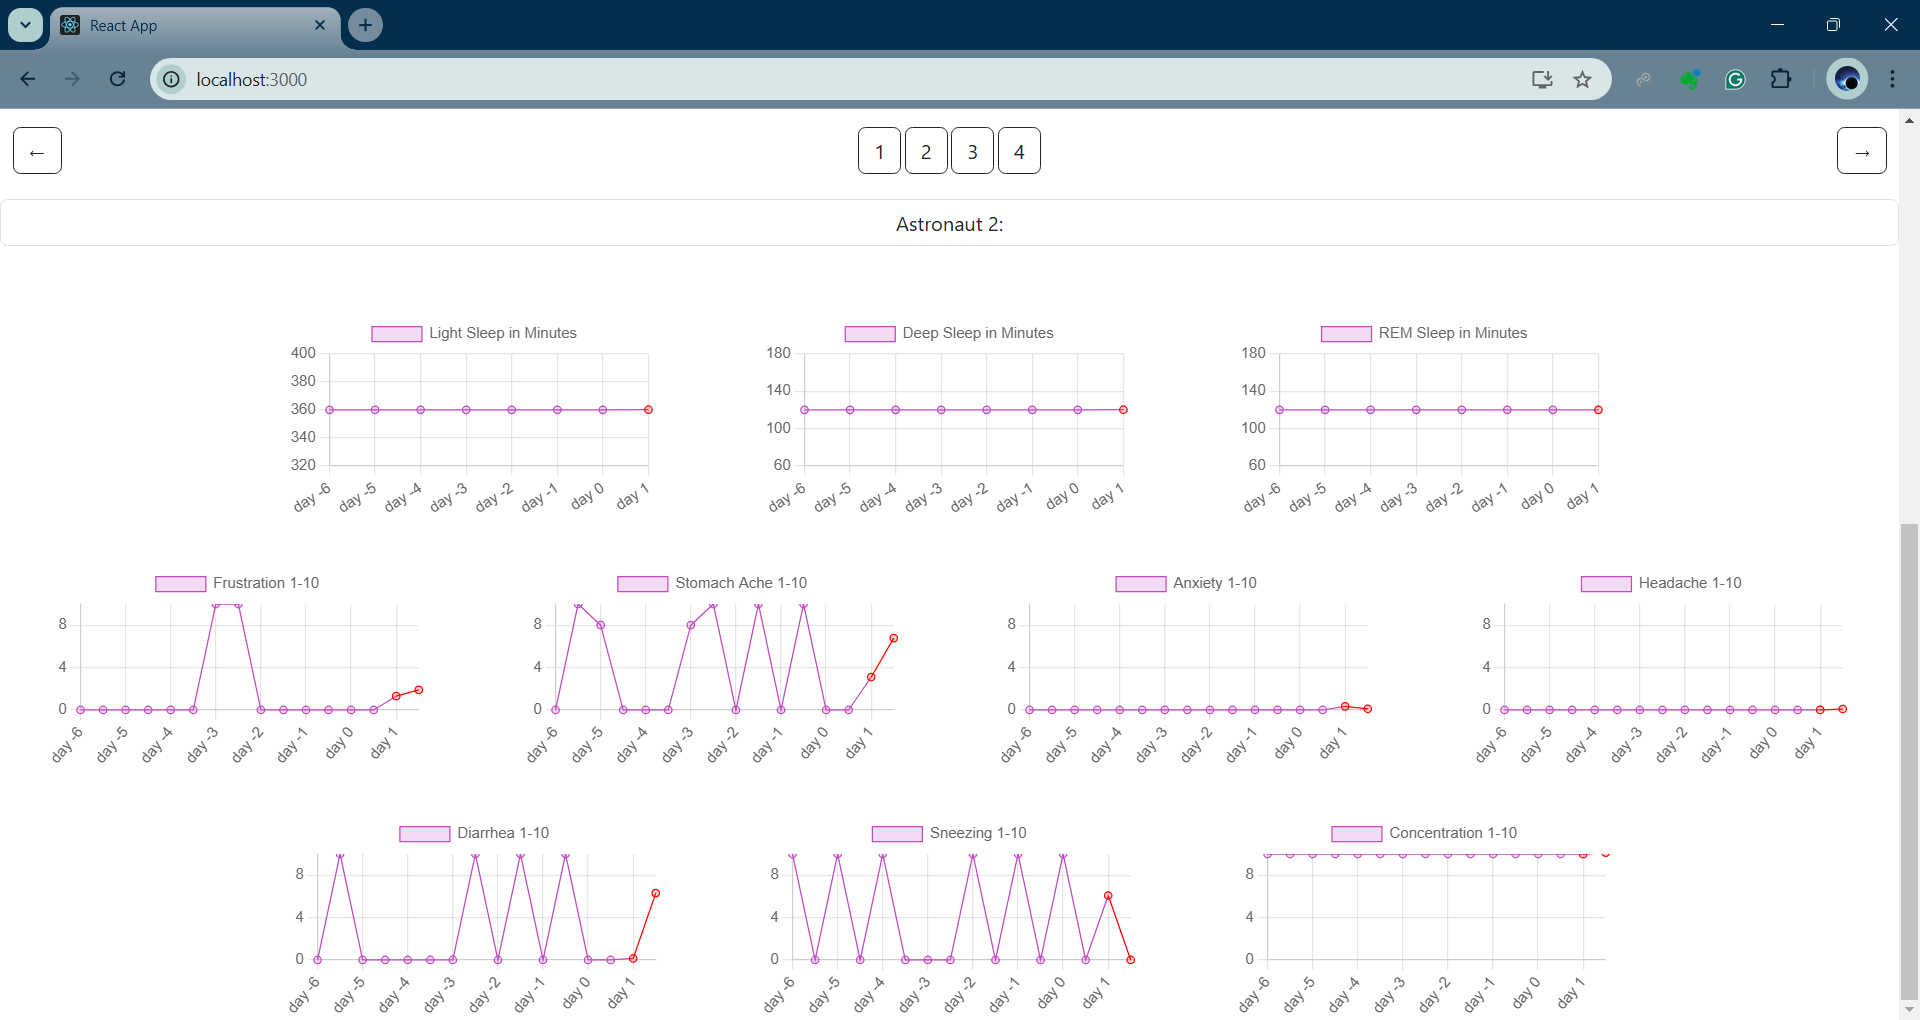
Miscellaneous health metrics


Inspiration
After settling on the AI challenge, we wanted to do something related to crew health metrics since JSC is NASA's hub for human spaceflight. One of our ideas was to try to predict crew health outcomes from various daily events within a crewed mission. This posed a question: how can we predict a set of health metrics from data in the past using AI? The data in question is a stream rather than a fixed size. This sounds similar to the problem which is solved by "attention" in transformers. Transformers are a very popular choice for natural language tasks, but what if instead of using a words as tokens, we considered a token to be a day's worth of health metrics?
What it does
We show how a transformer can find correlations between different health variables across time, like each astronaut's heart rate measurements, the amount of time each astronaut spent in various sleep stages the previous night, what they ate for each of their meals, if they felt sick, etc.
How we built it
There are 3 major parts to this project:
- Generating the data with Python. We wanted to simulate many different interactions between the astronauts to see if the transformer could learn them. For example, our generated data shows one astronaut feeling sick on one day because their co-worker ate something they didn't like the previous day (a bit of an exaggerated reaction but you get the point).
- Predicting the data with Python. We set up a transformer with PyTorch and trained it on 20,000 tokens of generated data for 8 epochs.
- Displaying the results with ReactJS. We used Bun instead of NodeJS for the server as Bun has faster loading times, then we used ReactJS for it's modularity and ChartJS as it closely matched the theme we wanted for our front end, as well as using Bootstrap to make the page look better generally. The server interprets the json data and the predictions from the backend, then displays them for the user.
Challenges we ran into
- Both training the generating the data and training the model took a long time. Generating just 20,000 tokens took 7 minutes. This could have been quicker had it been a compiled language instead of Python, but the convenience and simplicity of Python was more ideal for this event.
- Overfitting. We were seeing the model put too much emphasis on predicting the heart rate measurements (since it had many more measurements than any other category). The result was that metrics like stomach ache were simply averages instead of predictions like we wanted. Tweaking the loss function to make some errors more punishing and increasing the number of training tokens from 10,000 ti 20,000 ended up mitigating the problem.
- Complexity of the data generation code. We had to make sacrifices on the number of health metrics we tracked to make it easier to work with.
Accomplishments that we're proud of
- We can see that the model manages to pick up on some of the intricacies in the data we simulated, showing a transformer was effective.
- The front end looks good.
What we learned
- How transformers are trained.
- Overfitting is tricky, but can be mitigated by tweaking hyperparameters such as the loss function.
What's next for CHAWMP (Crew Health And Wellbeing Monitor and Predictor)
Our project is noninvasive so it could be used on real-world data with few consequences. It could also be adapted to include other sources of data depending on the sensors available. Being able to see health predictions may provide insights into what affects the day-to-day aspects of a missions and would allow crew members to better understand themselves.
Built With
- bootstrap
- bun
- chartjs
- javascript
- python
- pytorch
- react


Log in or sign up for Devpost to join the conversation.