

Inspiration
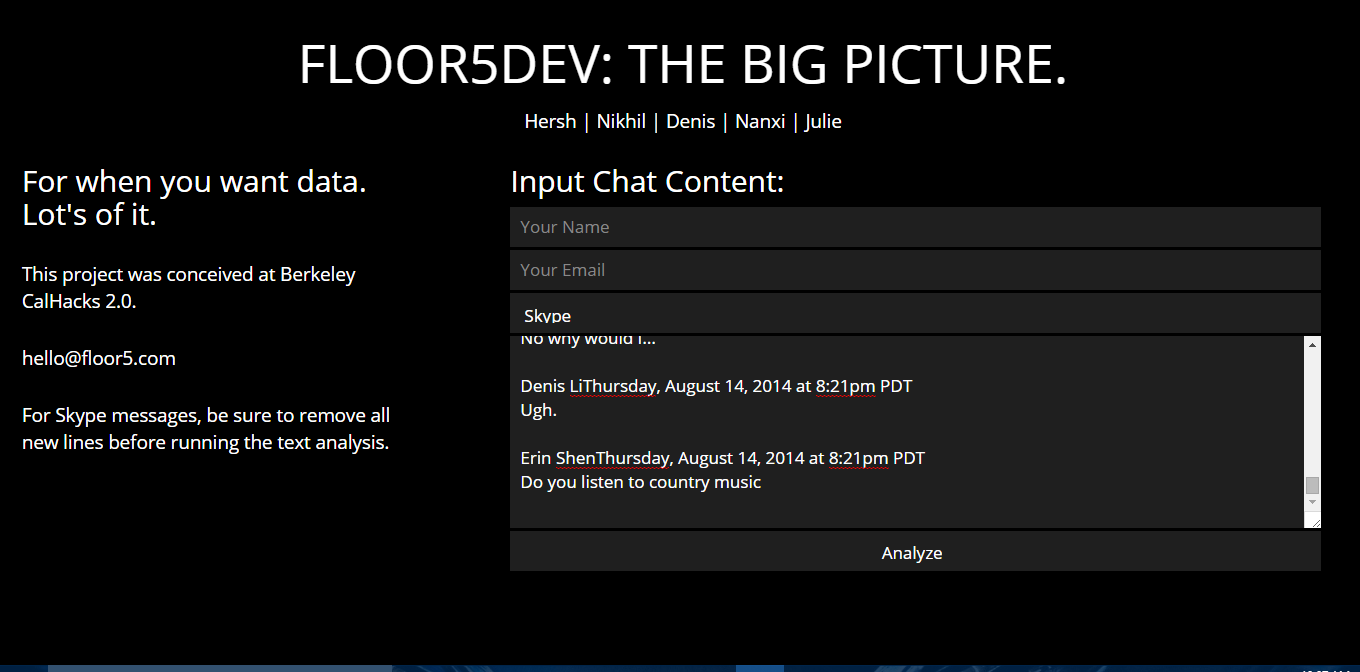
Our floor has a very lively group chat and we wanted to extract as much personal information as possible (and find embarrassing moments/ statistics).
What it does
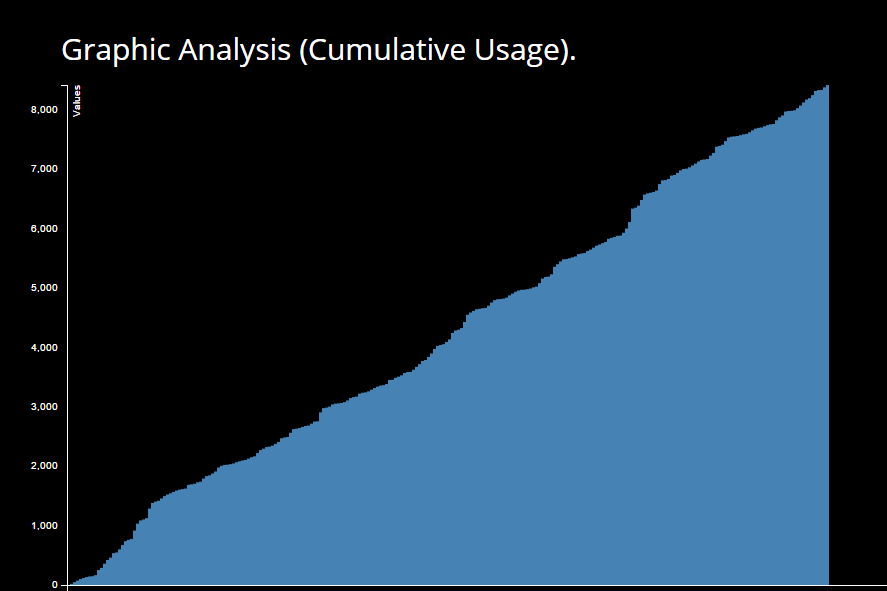
It parses groups chat and then organizes it into clusters where each clusters is separated by 20 minutes of silence/ inactivity. Then it outputs statistics about the clusters such as most talkative, most lonely (last message of a cluster) as well as statistics about the chat as a whole.
How I built it
Used JavaScript to parse input messages and run analysis on it. The use html/css and 3d to display the data in graphical form.
Challenges I ran into
- Getting messages from Facebook and parsing it
- How and what data to give statistics for
- Using 3d to display visualization of data
Accomplishments that I'm proud of
- Cleanness of website
- Implication of 3d to visualize data
What I learned
How to implement 3d to visualize data
What's next for The Big Picture
- More graphs and analysis
- Search capabilities for custom statistics
- Make the bars on the graph proportional to the time interval of the cluster that it represents
- Speed up analysis of longer chats
Built With
- 3d
- css3
- html5
- javascript
- natural
- nlp-compromise
- sum


Log in or sign up for Devpost to join the conversation.