ChaseIQ — Every Ball. Every Decision. A Smarter Way to Win.
Inspiration
Scorecards show what happened in a run chase. They do not show how much pressure a side is under, how the chances move with each wicket and ball, or what a different approach would be worth. We wanted an analyst's view of the chase, built on real ball-by-ball data.
What it does
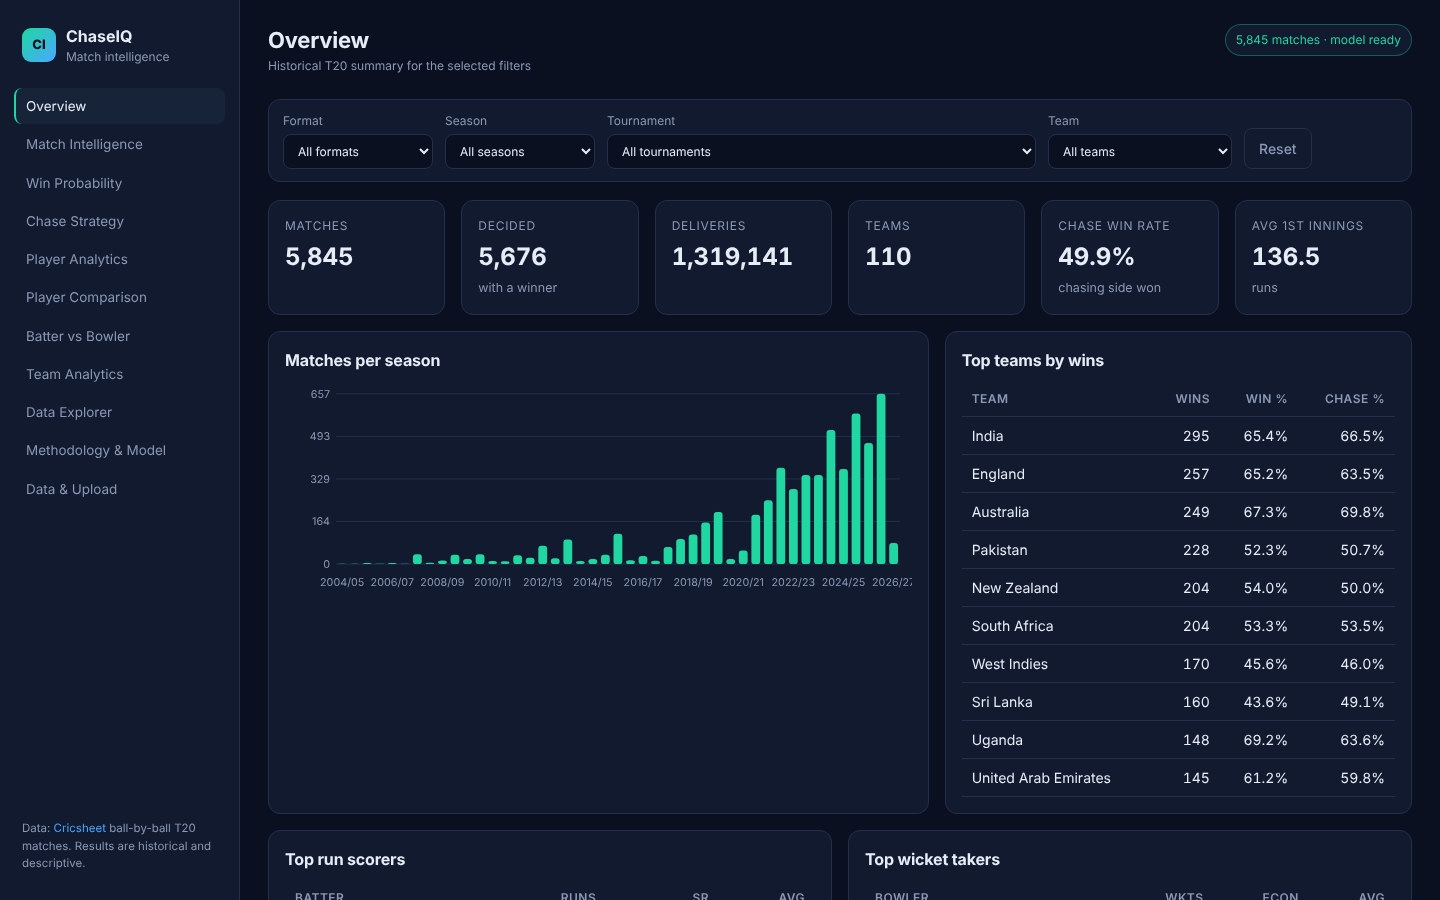
ChaseIQ analyses 5,845 T20 matches from the Cricsheet archive (1.3 million deliveries):
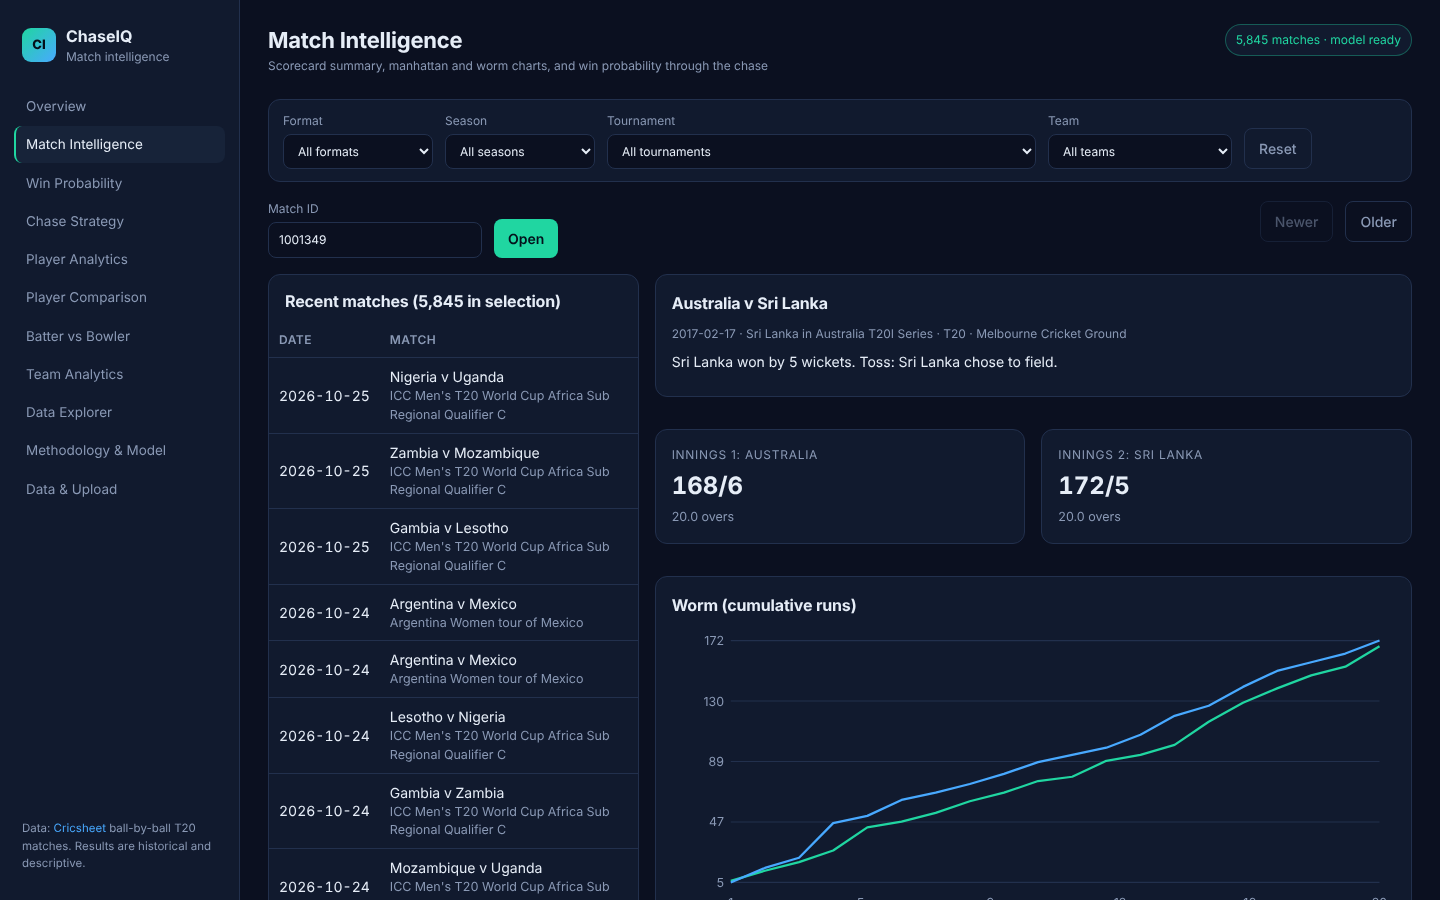
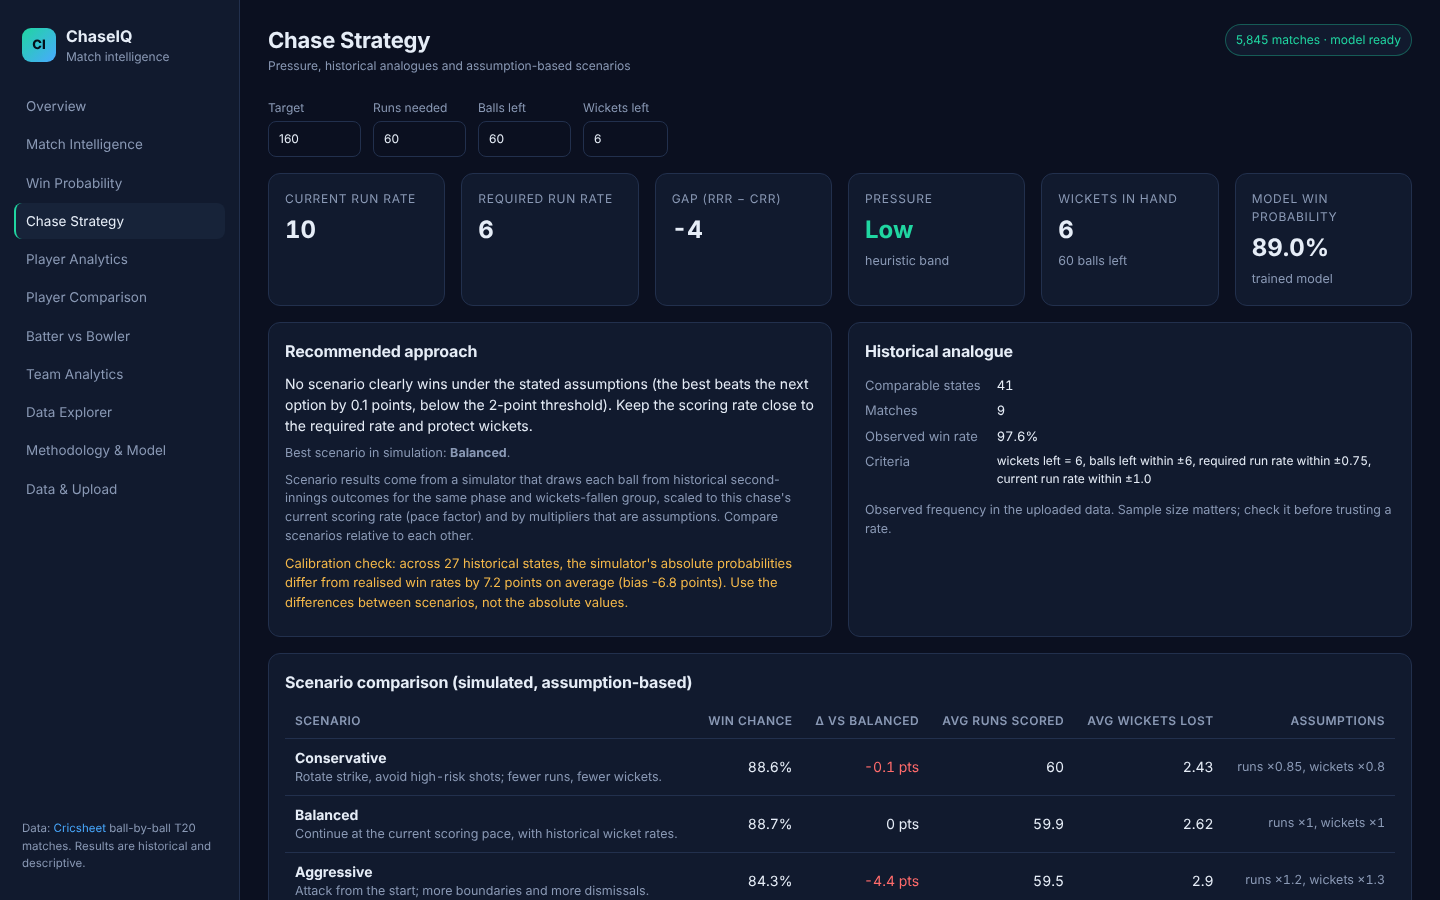
Win probability for any chase state. Enter the target, runs needed, balls left and wickets left. See the model's probability and a heat map of probabilities across the chase. Chase strategy. Pressure level, current and required run rate, and historical analogues with sample sizes. Compares conservative, balanced and aggressive approaches using a simulator, and says so when no option clearly wins. Match intelligence. Scorecard summary, worm and manhattan charts, and the model's win-probability path through each chase. Player and matchup analytics. Batting and bowling metrics, a custom pressure index (labelled as custom), player comparison with a radar chart, and batter-vs-bowler records with sample-size warnings. Team analytics and data explorer. Win rates, chase vs defend, head-to-head heat map, season trends, ball-by-ball browsing and CSV download. Methodology page. Model results, calibration, feature importance, formulas and limitations. How we built it Ingestion: parse each Cricsheet JSON match in the ZIP; exclude super-over innings; keep no-result matches but flag them; write a quality report. Features: one row per legal ball of each complete 20-over chase, using only what was known before that ball. Matches with an adjusted result (D/L or awarded, 194 decided 20-over chases) are excluded from training, because their targets may have been revised. Eleven further matches have an innings-level target that differs from first-innings runs + 1; Cricsheet's innings target field is not parsed, so these eleven remain in the training set. Model: chronological, match-grouped split (test = the latest 20% of matches). Three candidate models compared on a validation split by log loss; logistic regression was selected and scored once on the test set against two baselines. Strategy: historical analogues plus a Monte Carlo simulator. Each ball is drawn from historical outcomes for its phase and wickets-fallen group, scaled to the chase's current scoring pace. Scenario multipliers are stated assumptions. App: a standard-library Python server with JSON endpoints and a dark dashboard, tested in a headless browser on every page.
Challenges
A simulator that was too pessimistic. Our first simulator read about 17 points below realised win rates in matching historical states. Scaling it to each chase's current scoring pace reduced the average error from 0.28 to 0.07 on 27 states. We kept the simulator for comparing scenarios and say so in the app. Honest recommendations. A strategy that beats another by 0.1 points is not a recommendation. The app names a best approach only when it beats the next option by 2 points. Matching states properly. Comparing only required run rates gave misleading historical win rates. Matching on the current run rate too made the analogues comparable.
Accomplishments
Model on held-out, later matches: 84.9% accuracy, ROC-AUC 0.935, versus 81.8% and 0.909 for a required-run-rate-only baseline. Test set: 1,093 matches, 107,391 ball-states (2025-10-09 to 2026-10-25). Metrics are computed across all ball-states pooled together, not averaged per match; matches with longer chases contribute more rows. Training excluded 194 adjusted-result (D/L or awarded) matches; 5,463 decided 20-over chases remain. Calibrated probabilities: predicted and observed chase win rates line up across ten bins. Fully reproducible: one command rebuilds the data, model and reports from the original ZIP with fixed seeds. 32 automated tests passing (17 unit, 15 integration), and every page checked in a browser with no errors. What we learned Run-rate gap and wickets in hand explain most of the model. Team and player identity add complexity, and we would need careful validation to justify them. Clear labelling of what is learned, what is observed and what is assumed matters as much as the numbers.
What's next
A match simulator for full-innings play-out. Team and venue features with leakage-safe validation. Live data integration, which is not part of this submission.
Data and attribution
Ball-by-ball data: Cricsheet (T20 JSON archive, t20s_json.zip). Cricsheet's licensing page says most of its data is under the Open Data Commons Attribution License (ODC-By) 1.0 (https://opendatacommons.org/licenses/by/1.0/), and that its XML match data alone is under CC BY 4.0. The page does not name the JSON archive individually; ChaseIQ treats the JSON archive as ODC-By, so check https://cricsheet.org/licensing/ before publishing. ChaseIQ processed and transformed the Cricsheet data into its own tables, model and reports. The data is not redistributed with this project; download it from https://cricsheet.org/downloads/ and follow the README. ChaseIQ is an independent analysis project, not affiliated with Cricsheet, the ICC or any league. Code is MIT licensed. See DATA_ATTRIBUTION.md.
Built With
- cricsheet
- css
- html
- javascript
- machine-learning
- numpy
- pandas
- python
- scikit-learn
- sports-analytics

Log in or sign up for Devpost to join the conversation.