-
-
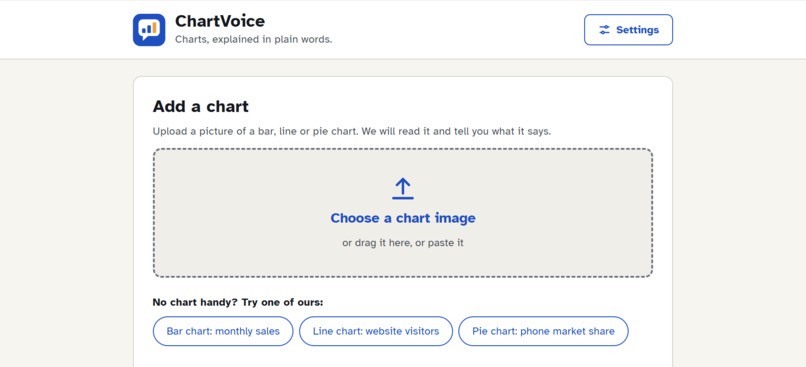
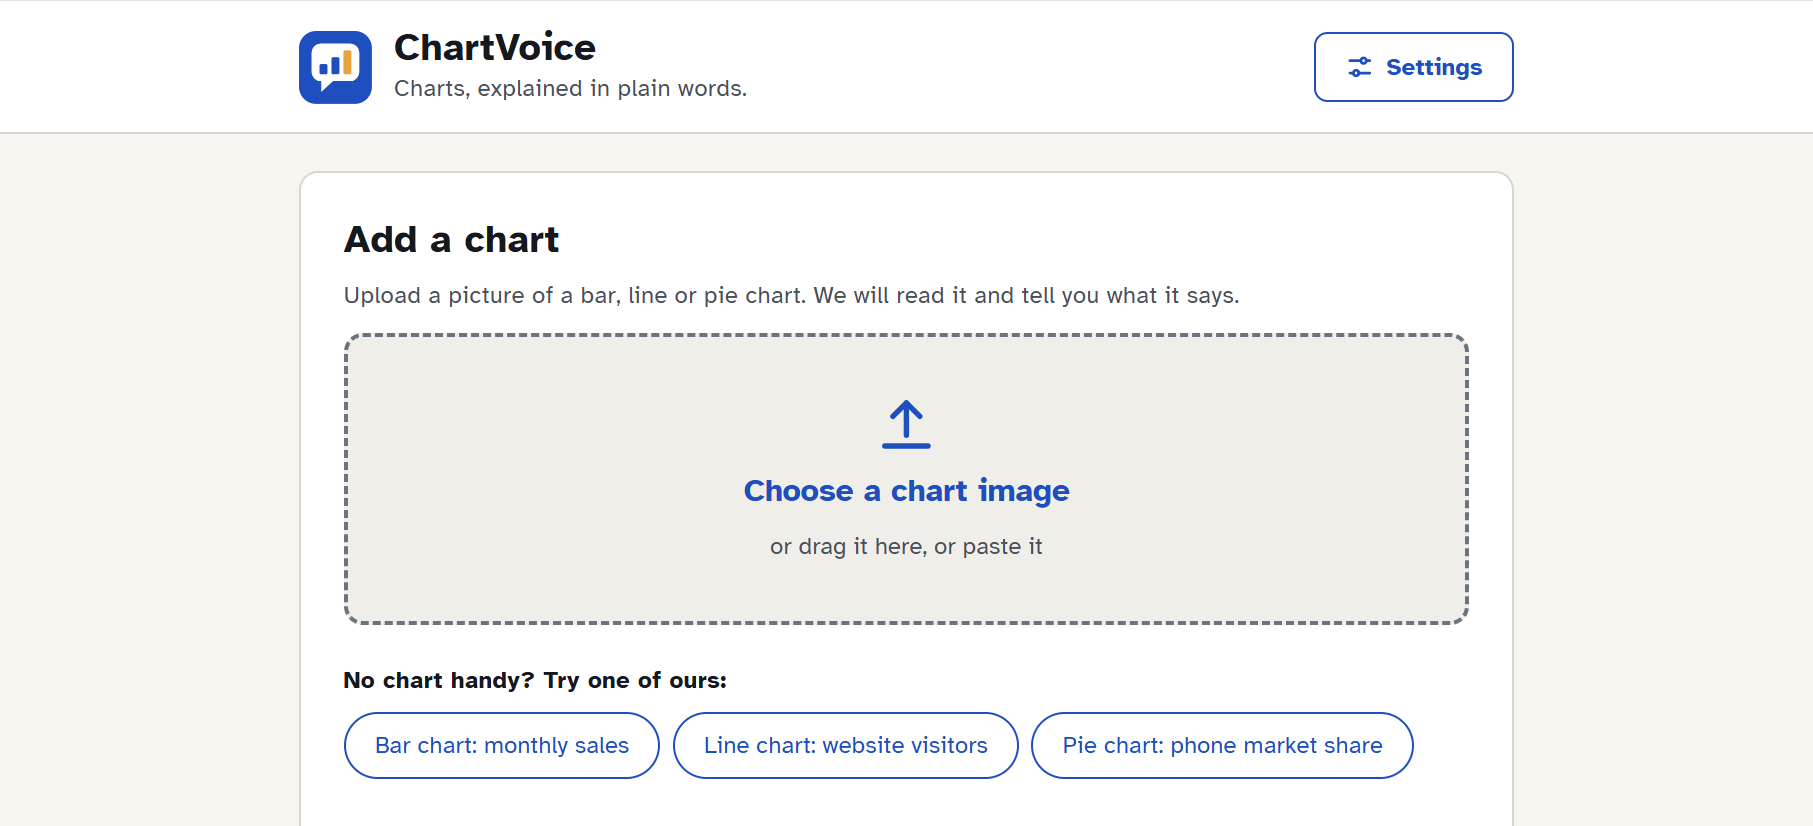
Choose images
-
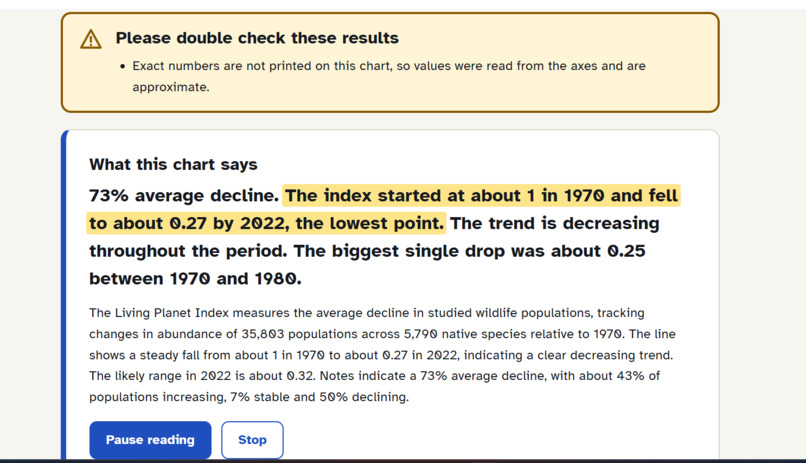
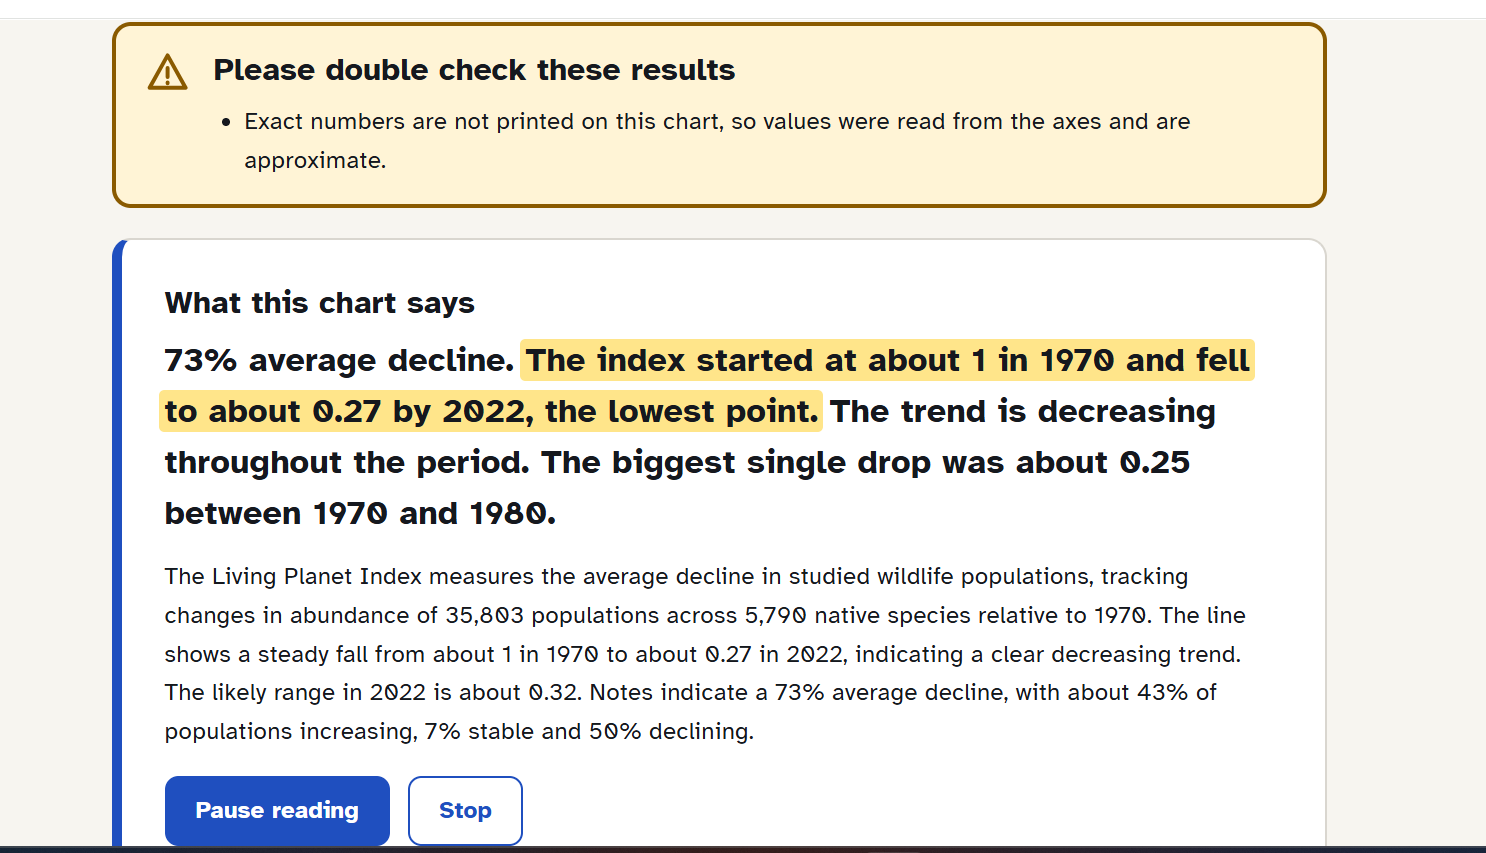
Summary and explanation of chart
-
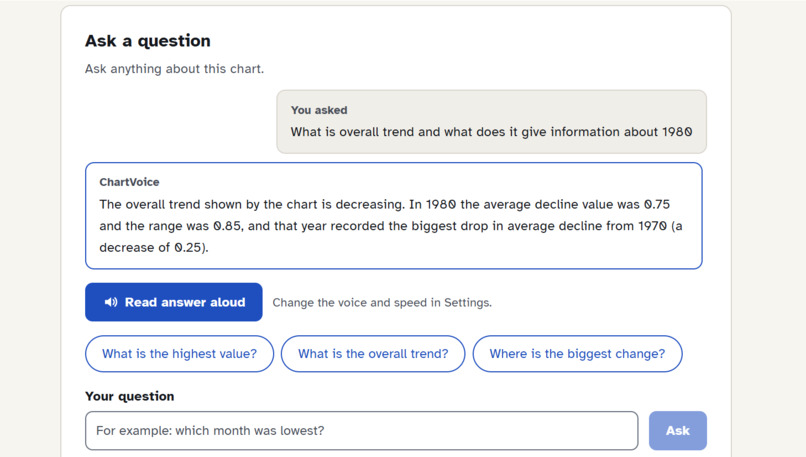
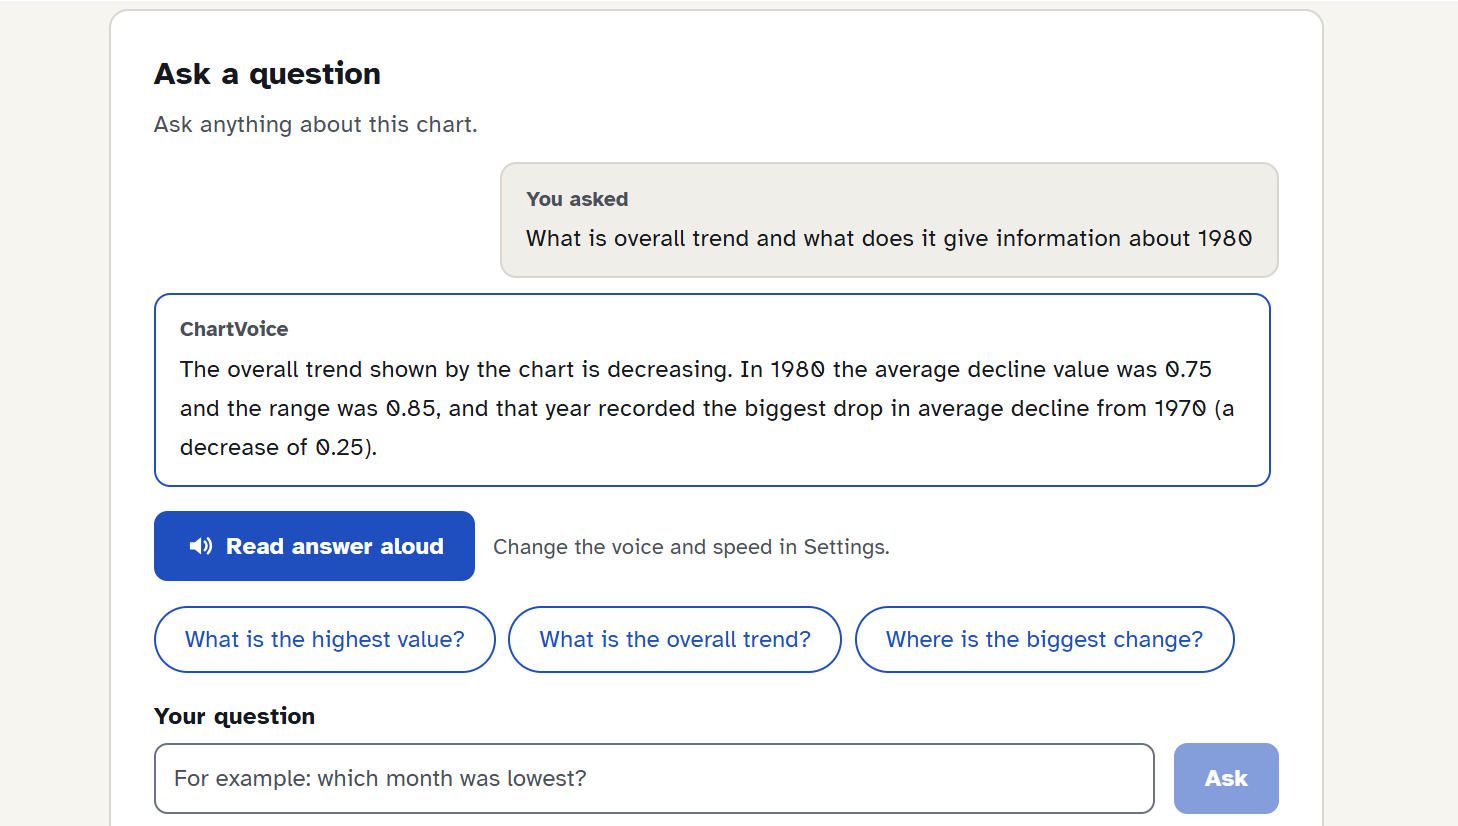
Chat related to chart
-
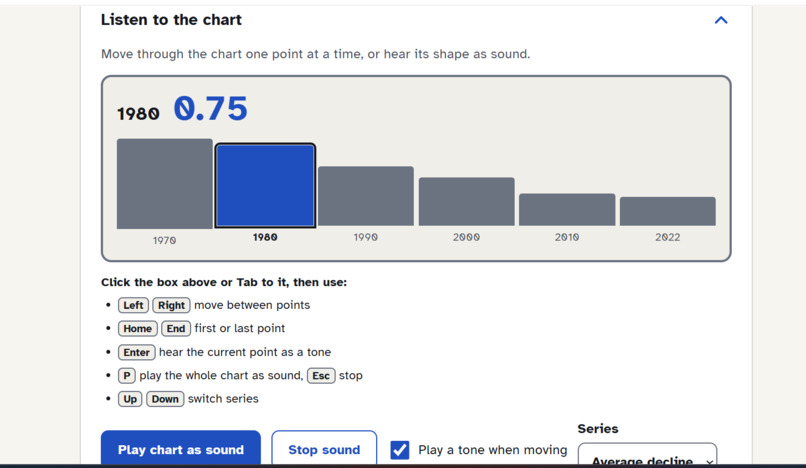
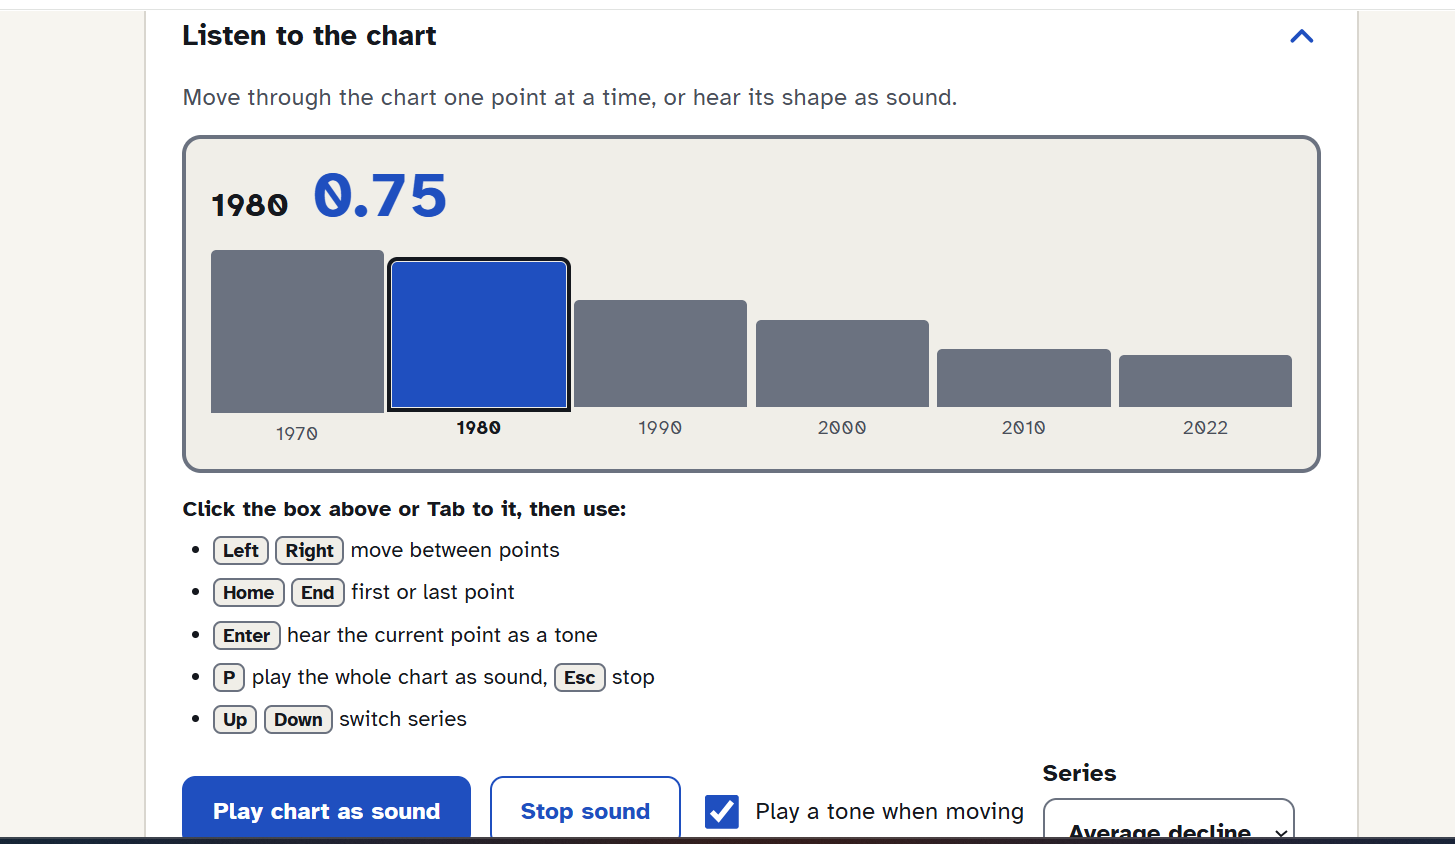
Understand single detail one by one
-
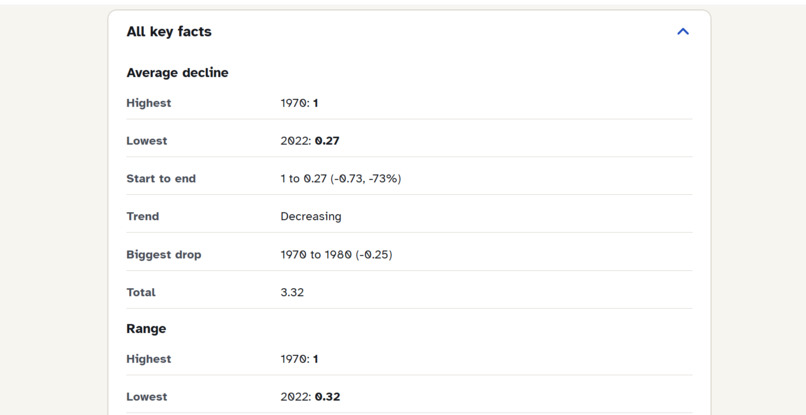
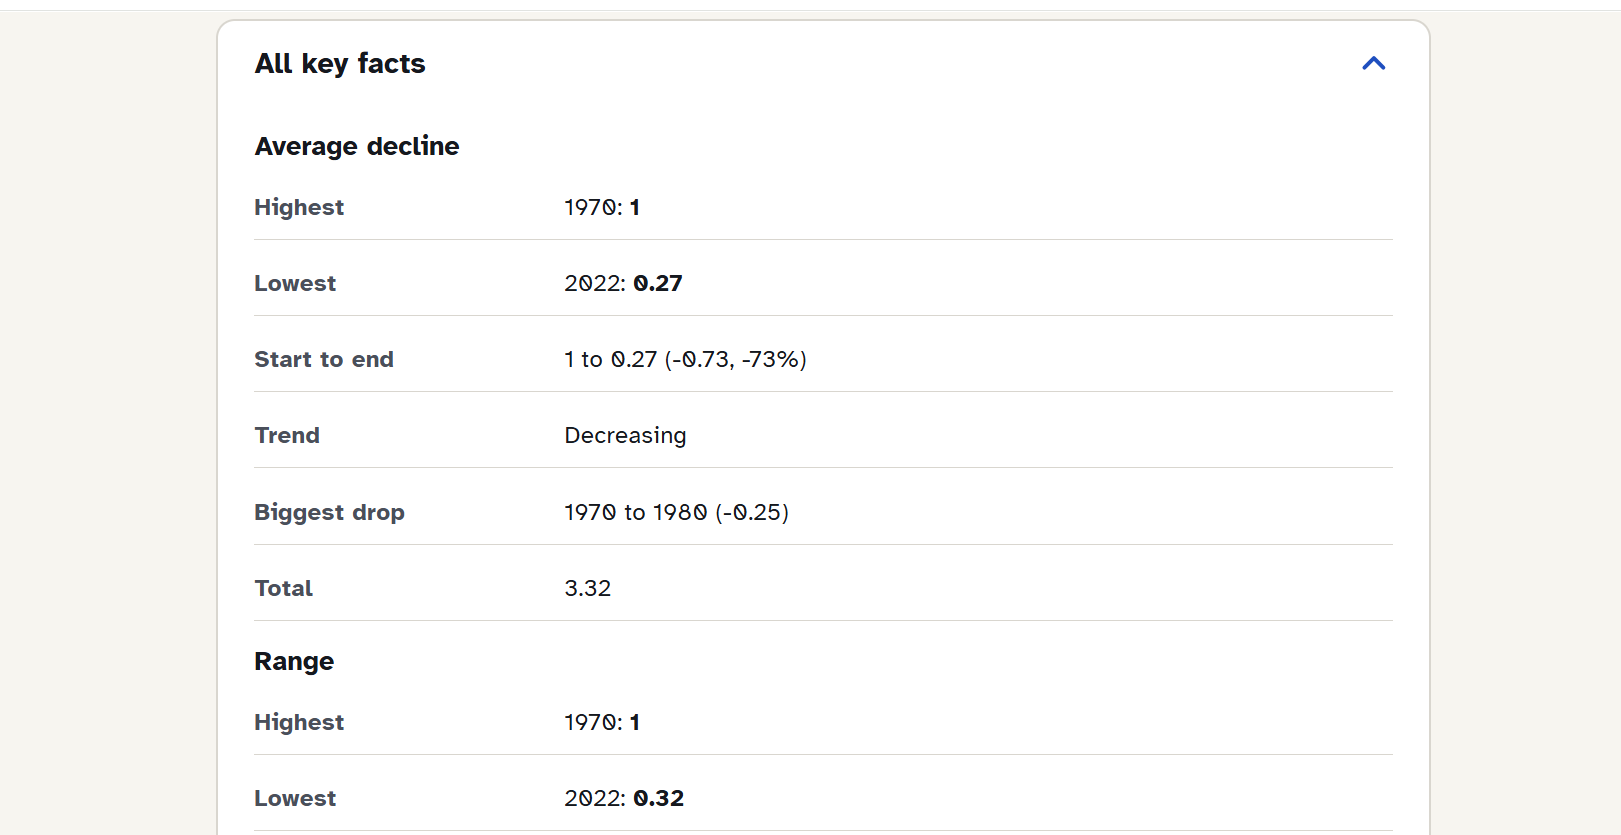
Details of chart in structured way
-
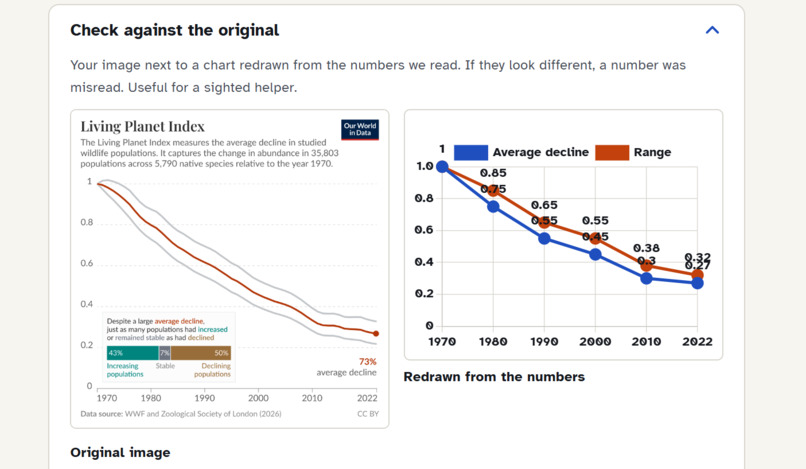
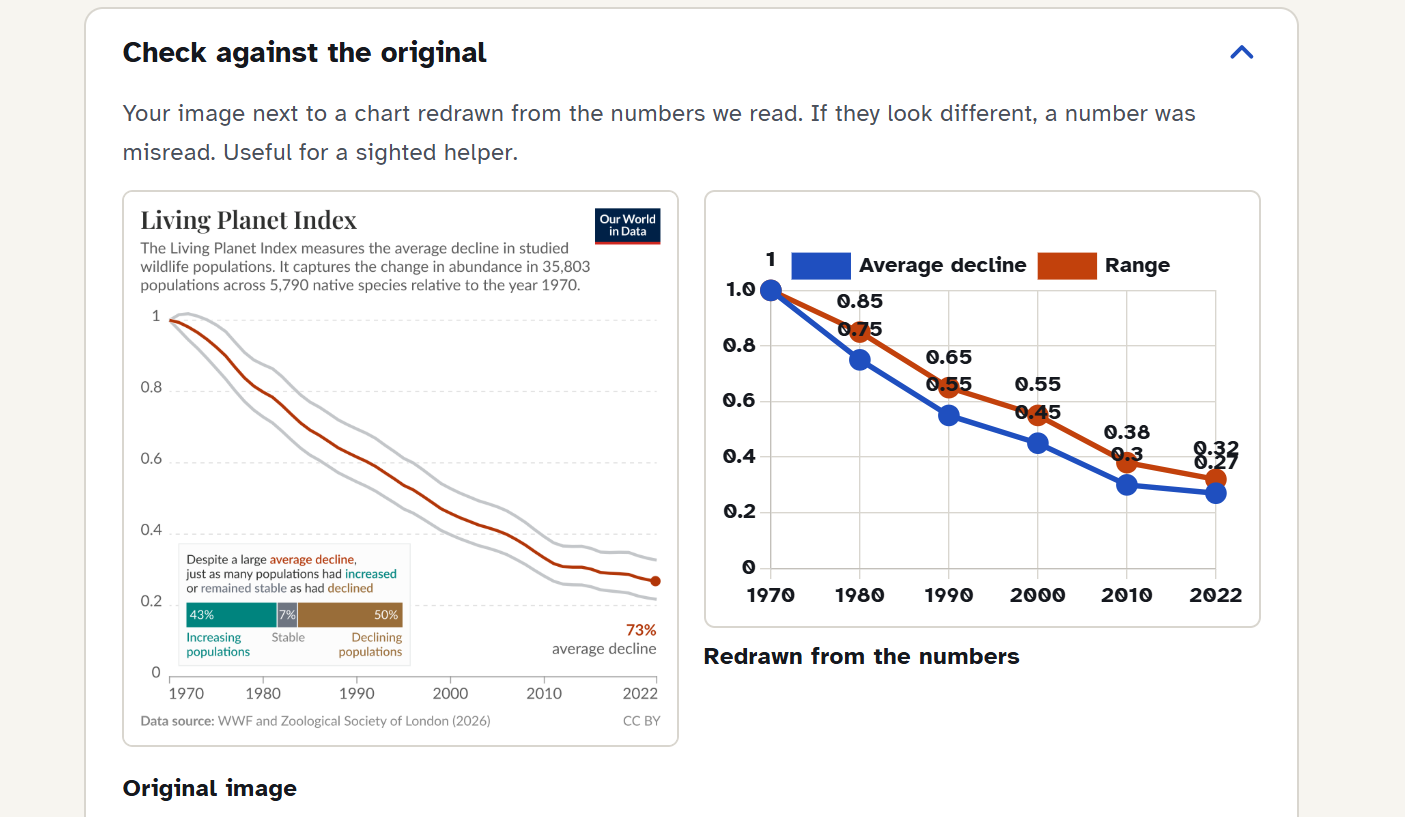
Redraw chart to understand easily
-
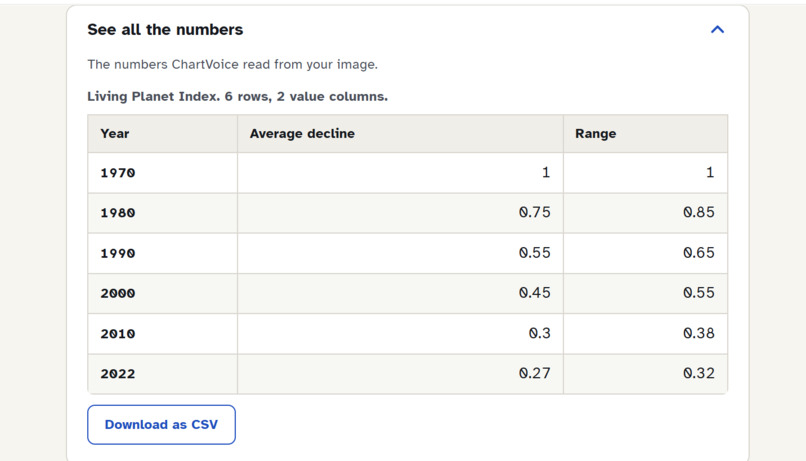
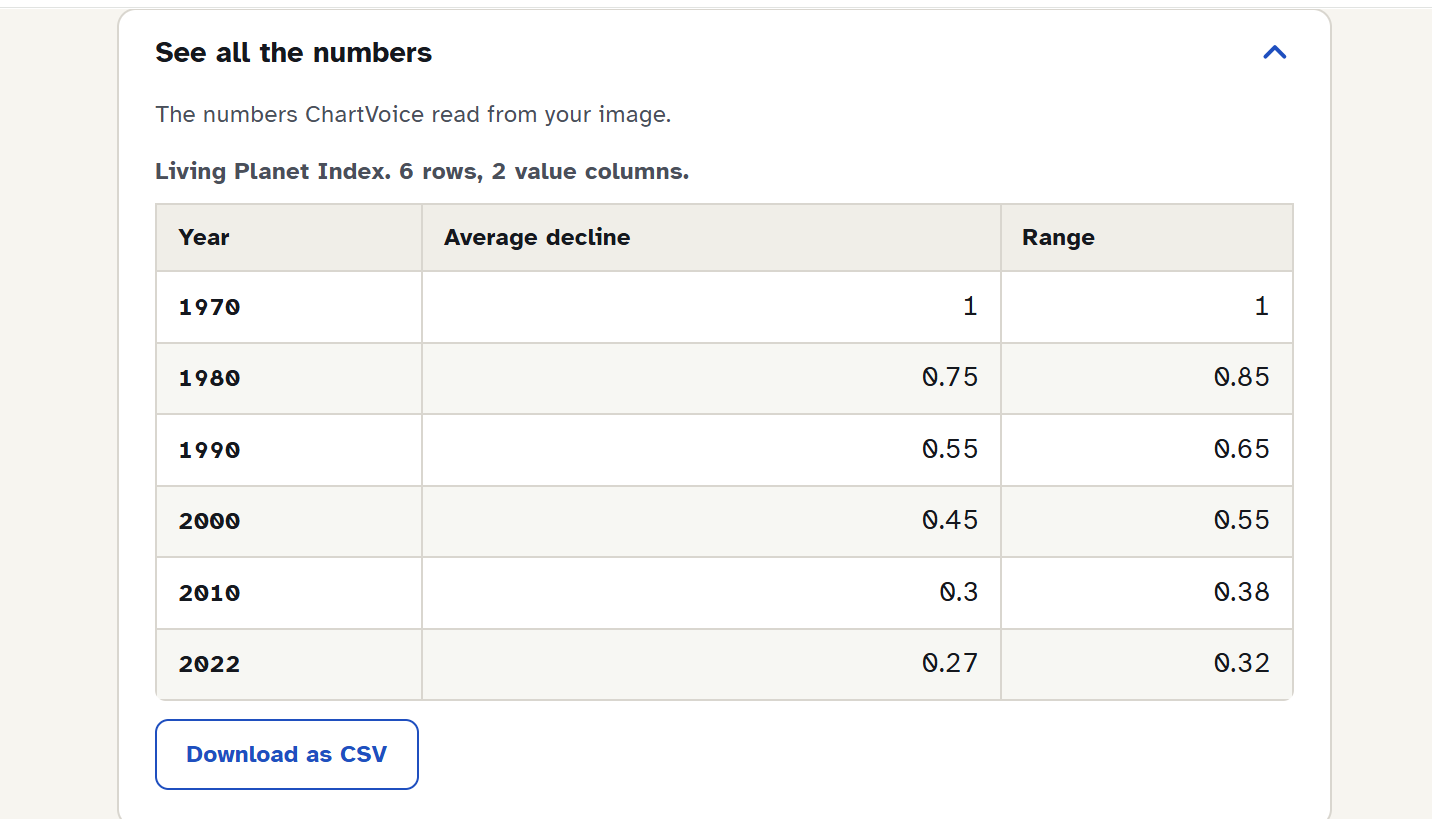
Chart data extracted as Table
-
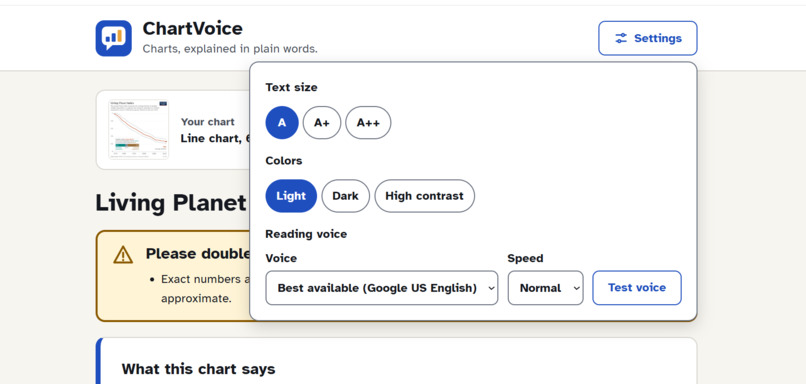
Settings
Inspiration
Imagine your doctor hands you a report, and the number that matters most is inside a chart, but you can't see it, or no one ever taught you how to read it. Over two billion people live with a vision impairment (WHO), and many more struggle with charts. Screen readers read text aloud, but at a chart they just say "image", and the most important information is skipped.
Our team (Inam, Muhammad Talal Jamil, Muhammad Hasnain and Adnan) brainstormed several image-AI ideas and chose this one: a real problem, a clear audience, and accuracy we could measure. We built ChartVoice so no one has to skip the most important part of the page.
What it does
Upload a bar, line or pie chart, and ChartVoice:
- reads it aloud in plain words, highlighting each sentence for low-vision readers
- leads with the chart's main message: highest, lowest, trend and biggest change
- builds a real data table a screen reader can move through cell by cell
- lets you hear the chart's shape as sound, point by point
- answers your questions about the chart, like asking a friend
- redraws the chart from the extracted numbers so a helper can check it
- warns you about two scales or estimated values ("about 1500")
- reads charts offline, too
How we built it
- Image → table: online, a Groq-hosted vision model reads the chart in 2–5 seconds. Offline, Google's pretrained DePlot model runs on an ordinary laptop. No training was needed.
- Table → facts: our Python code calculates the highest and lowest values, trend, and biggest rise and drop, so the key numbers are calculated, never guessed.
- Facts → words: a language model writes the summary, and our code checks every number and every "rose" or "fell" against the data. If something doesn't match, the AI must fix it, or ChartVoice falls back to a plain summary built only from facts. The AI writes; our code verifies.
- Accessible interface: React + TypeScript with keyboard-only use, screen-reader announcements, high-contrast themes, large text and the Atkinson Hyperlegible font.
We designed by testing real charts. Every failure we found became a fix and an automated test (30 backend tests).
Built with: Python, FastAPI, PyTorch, Hugging Face Transformers, Google DePlot, Groq, React, TypeScript, Chart.js, Web Speech API and Web Audio API.
Challenges we ran into
- Speed: DePlot took over 5 minutes on a complex 7-line chart on a laptop CPU. We added a fast online reader, a time limit, one-job-at-a-time protection and a cache. Most charts now take about 5–10 seconds.
- Precision: on charts without printed numbers, values must be estimated from the axes, and even strong vision models are imprecise. ChartVoice says "about" and warns the user instead of pretending to be exact.
- AI mistakes: the AI once invented a reason ("suggests a successful promotion") and wrote "rose" for a fall. We added code checks for both, plus a test for each real mistake.
- Free-tier limits: the vision model allowed only 1,000 output tokens per minute, which ruled out reading each chart several times.
- Teamwork: four people building in parallel taught us to agree on an API contract first, so the frontend and backend connected cleanly.
Accomplishments that we're proud of
- 97–99% of values read within 5% on test charts with known true values
- AI-written explanations verified by code for both numbers and directions
- A system that tells users when it might be wrong instead of sounding confident
- Chart reading that works offline
- An interface designed for screen readers, keyboard users and low vision from day one
What we learned
- AI is excellent at reading and writing, but numbers need verification, especially for people who can't double-check them.
- Charts carry meaning in their printed text (headlines, notes, insets), not only in their data.
- Accessibility lives in the details: speaking one sentence at a time, moving focus to new results, never relying on colour alone.
- Testing on real examples beats guessing; every improvement came from a real failure.
What's next for ChartVoice
- ChartVoice inside text-to-speech: today, screen readers and text-to-speech tools read the words in a document and go silent at the charts. Built into a screen reader, PDF reader or browser, ChartVoice could read the text and explain every chart as you reach it.
- Fix a misread value and have the summary, speech and redrawn chart update instantly
- Charts inside PDFs and more chart types
- A browser extension that explains any chart on any web page
- Also make it capable to read multiple type of diagrams as well



Log in or sign up for Devpost to join the conversation.