-
-
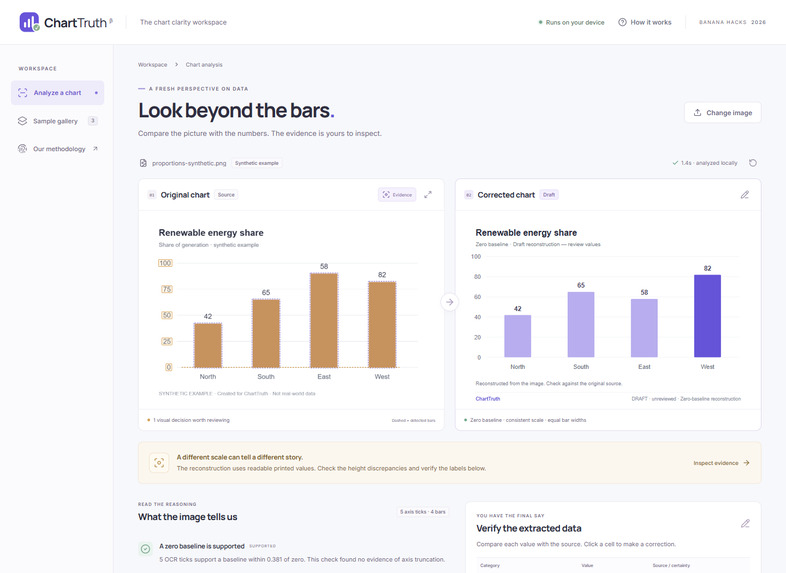
Actual app: printed values versus measured bar heights. Synthetic example, not real-world evidence.
-
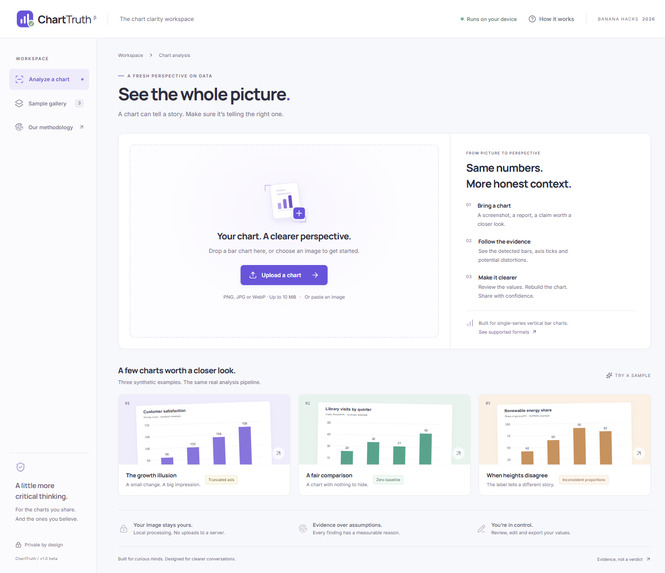
Original ChartTruth workspace. Local OCR, inspectable evidence and editable reconstruction.
Inspiration and brainstorming
A bar chart can make a small change look dramatic by moving its baseline. I explored automated verdicts and manual chart editors, then chose a workspace where students, journalists and everyday readers can inspect the evidence themselves.
What it does
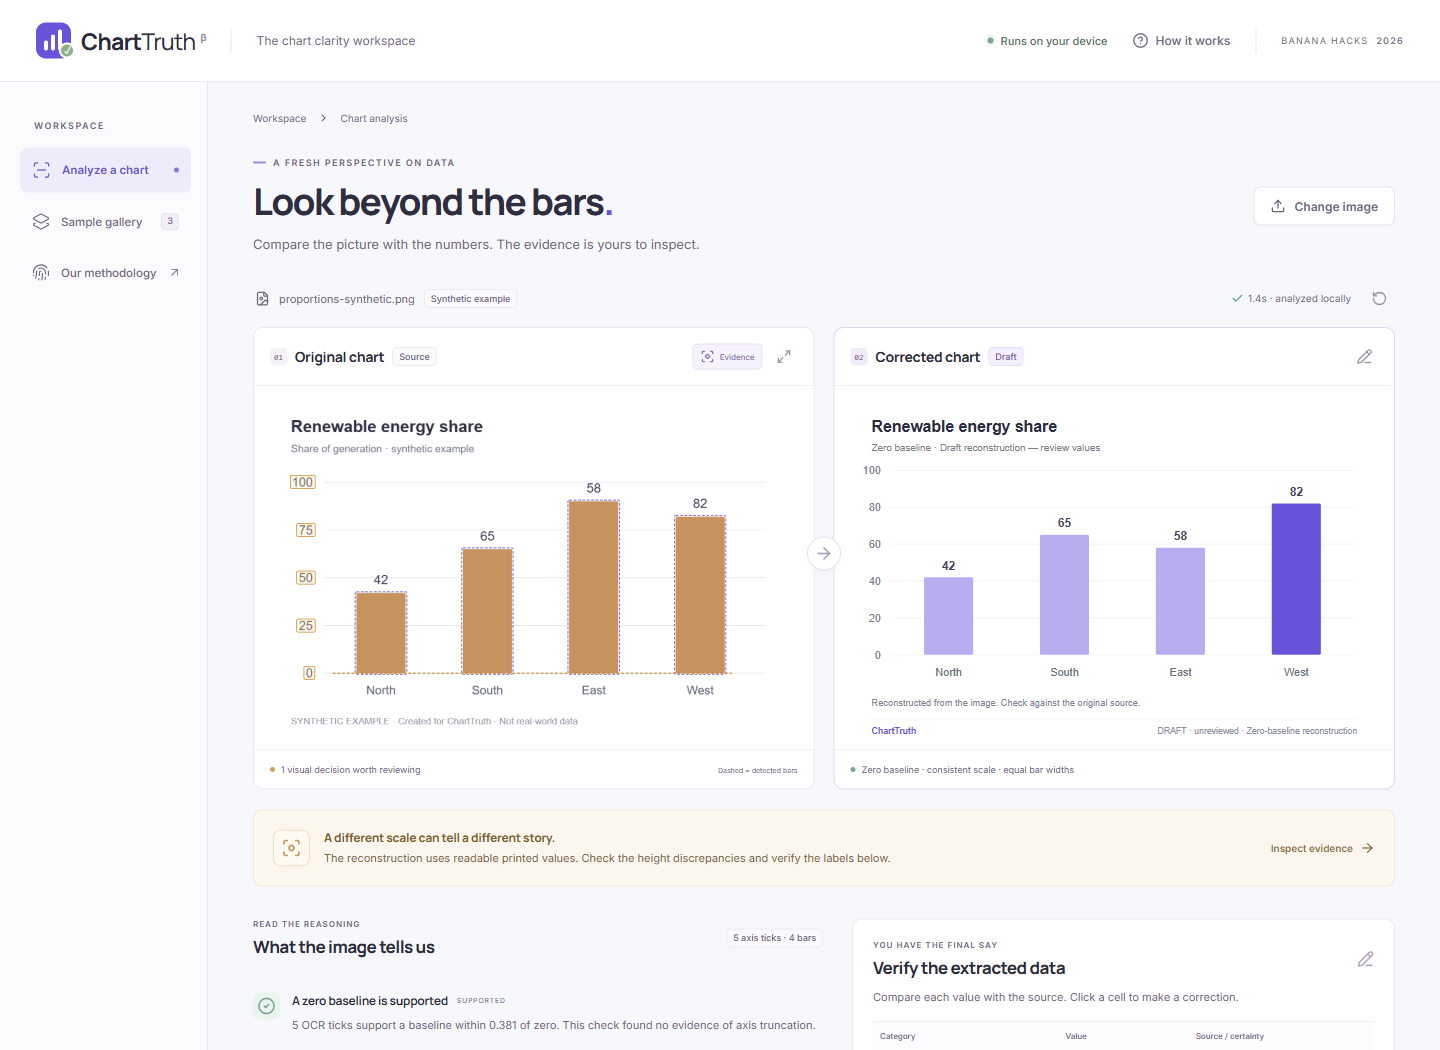
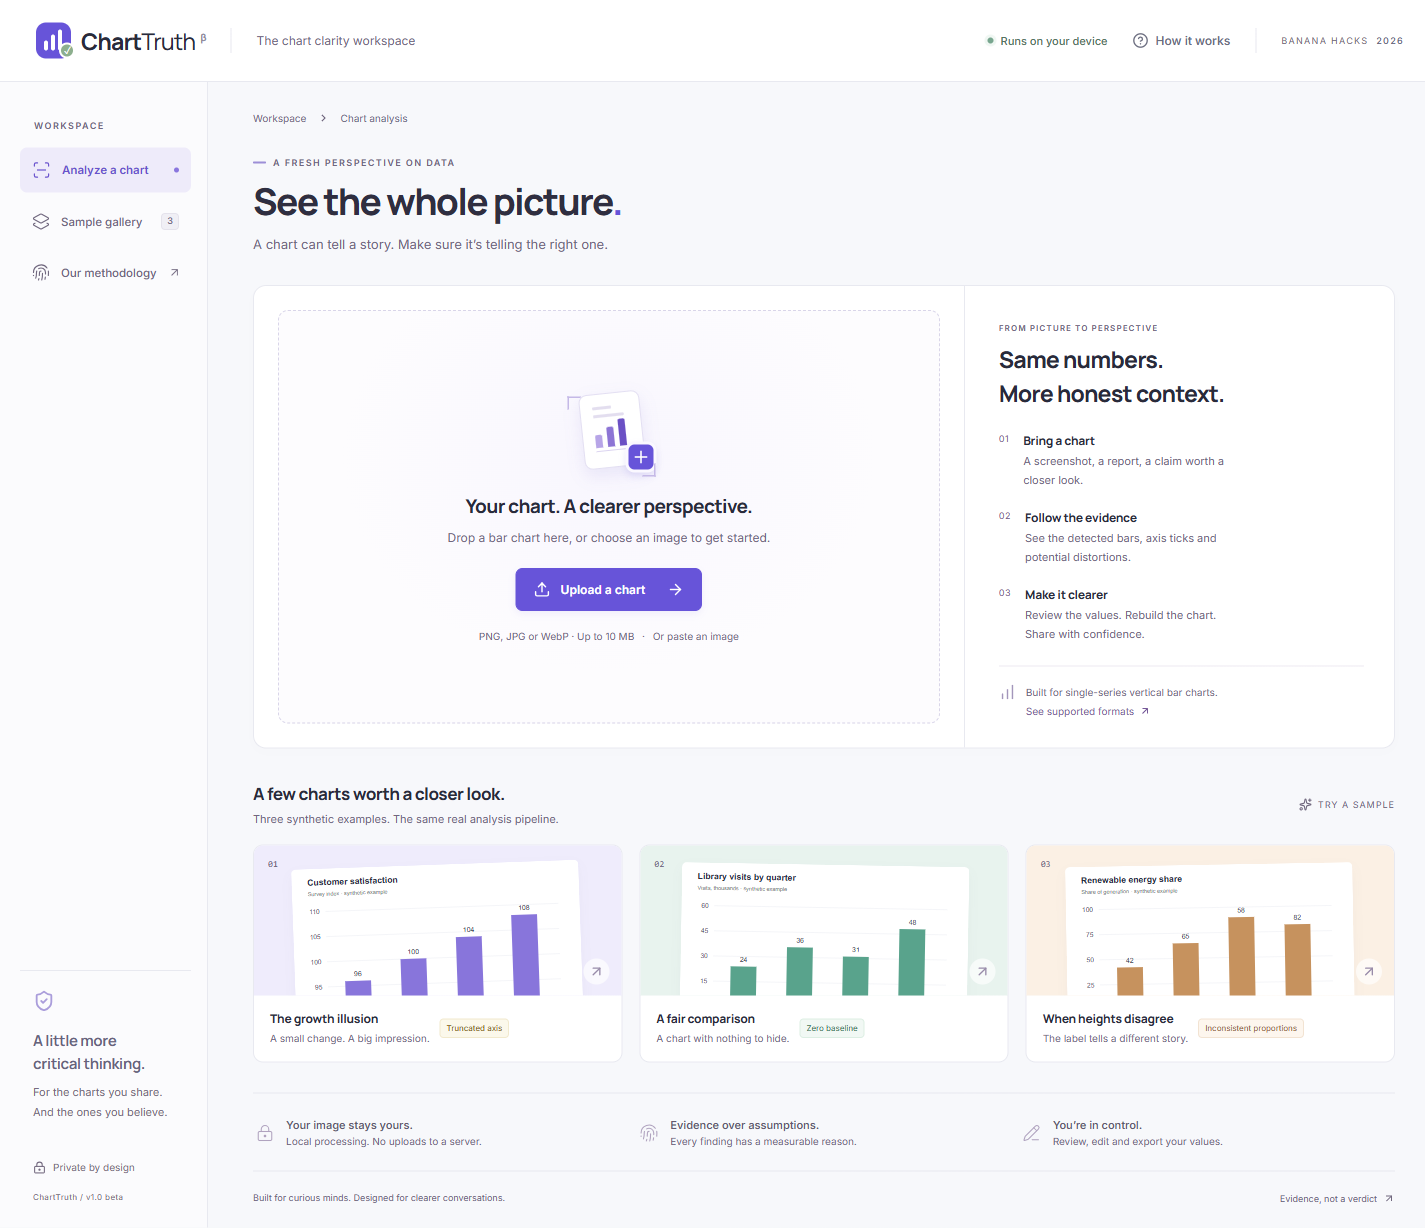
Upload, drop or paste a chart screenshot, or try three clearly labeled synthetic examples. ChartTruth places the source beside a zero-baseline reconstruction, overlays detected bars and ticks, and explains each finding. Correct labels and values, add context, confirm review, then export PNG, accessible SVG or JSON evidence. Edits remain distinct from image evidence. There is no opaque trust score or claim about deceptive intent.
How I built it
React and TypeScript power the interface. An original geometry worker segments pixels, measures bars and finds their shared baseline. Tesseract.js runs its English LSTM OCR model locally, with focused retries for missing text. At least three consistent numeric ticks are required for linear-axis calibration. Comparing printed values with measured heights can expose inconsistent proportions; height-derived values are explicitly estimates. Image AI and computer vision are essential: removing image understanding removes automatic reconstruction. No API key or cloud inference is needed; images stay in the browser.
Design process and challenges
Research into chart editors, analytical dashboards and digitization tools informed an original light workspace centered on source/reconstruction comparison, evidence and editable data. Sparse OCR missed a zero tick; targeted crops recovered it. Further tests exposed short bars, shaded fills and small-text failures. Ambiguous inputs receive an explanation and manual fallback.
What I learned and accomplished
Reliability includes knowing when to stop. The project has 48 passing unit tests and a previously completed 16-test hosted browser suite, covering real OCR, corrections, exports, unsupported inputs, responsive layouts and accessibility. An exploratory evaluation of 20 external Misviz charts produced one numerical reconstruction needing category correction and 19 rejections. These results informed fixes and are not held-out accuracy claims.
Impact and next steps
ChartTruth helps readers question visual claims and make clearer alternatives. Automatic scope is single-series vertical bar charts with readable linear axes. It cannot verify source data. Next steps are broader independent evaluation, user-assisted calibration and more chart families.
Resources and AI disclosure
React, TypeScript, Vite, Tesseract.js and its English model, Lucide, Inter, Manrope and Misviz are credited in the repository. OpenAI Codex assisted research, original code, design, testing and documentation. Runtime analysis uses OCR and deterministic image processing, with no generative model or fine-tuning. Demo narration uses Microsoft Zira synthetic speech. This is a solo entry; original project work was created during Banana Hacks 2026.

Log in or sign up for Devpost to join the conversation.