Inspiration
Our inspiration for this project came from the fact that all of us are colorblind. All three members of our team have different types and levels of colorblindness. This means a color combination that looks one way to one of us is different for the others. Although small color changes aren't too detrimental in everyday life, they can be when you're trying to understand data. Charts are meant to make information easier to understand and analyze, but when the colors cause confusion for some, it can have the opposite effect for those people. When we faced an argument and a failed lab report in a chemistry class, we wanted to build a tool that would help others deal with the problems we dealt with without needing the original spreadsheet or design file. That became ChartSafe
What it does
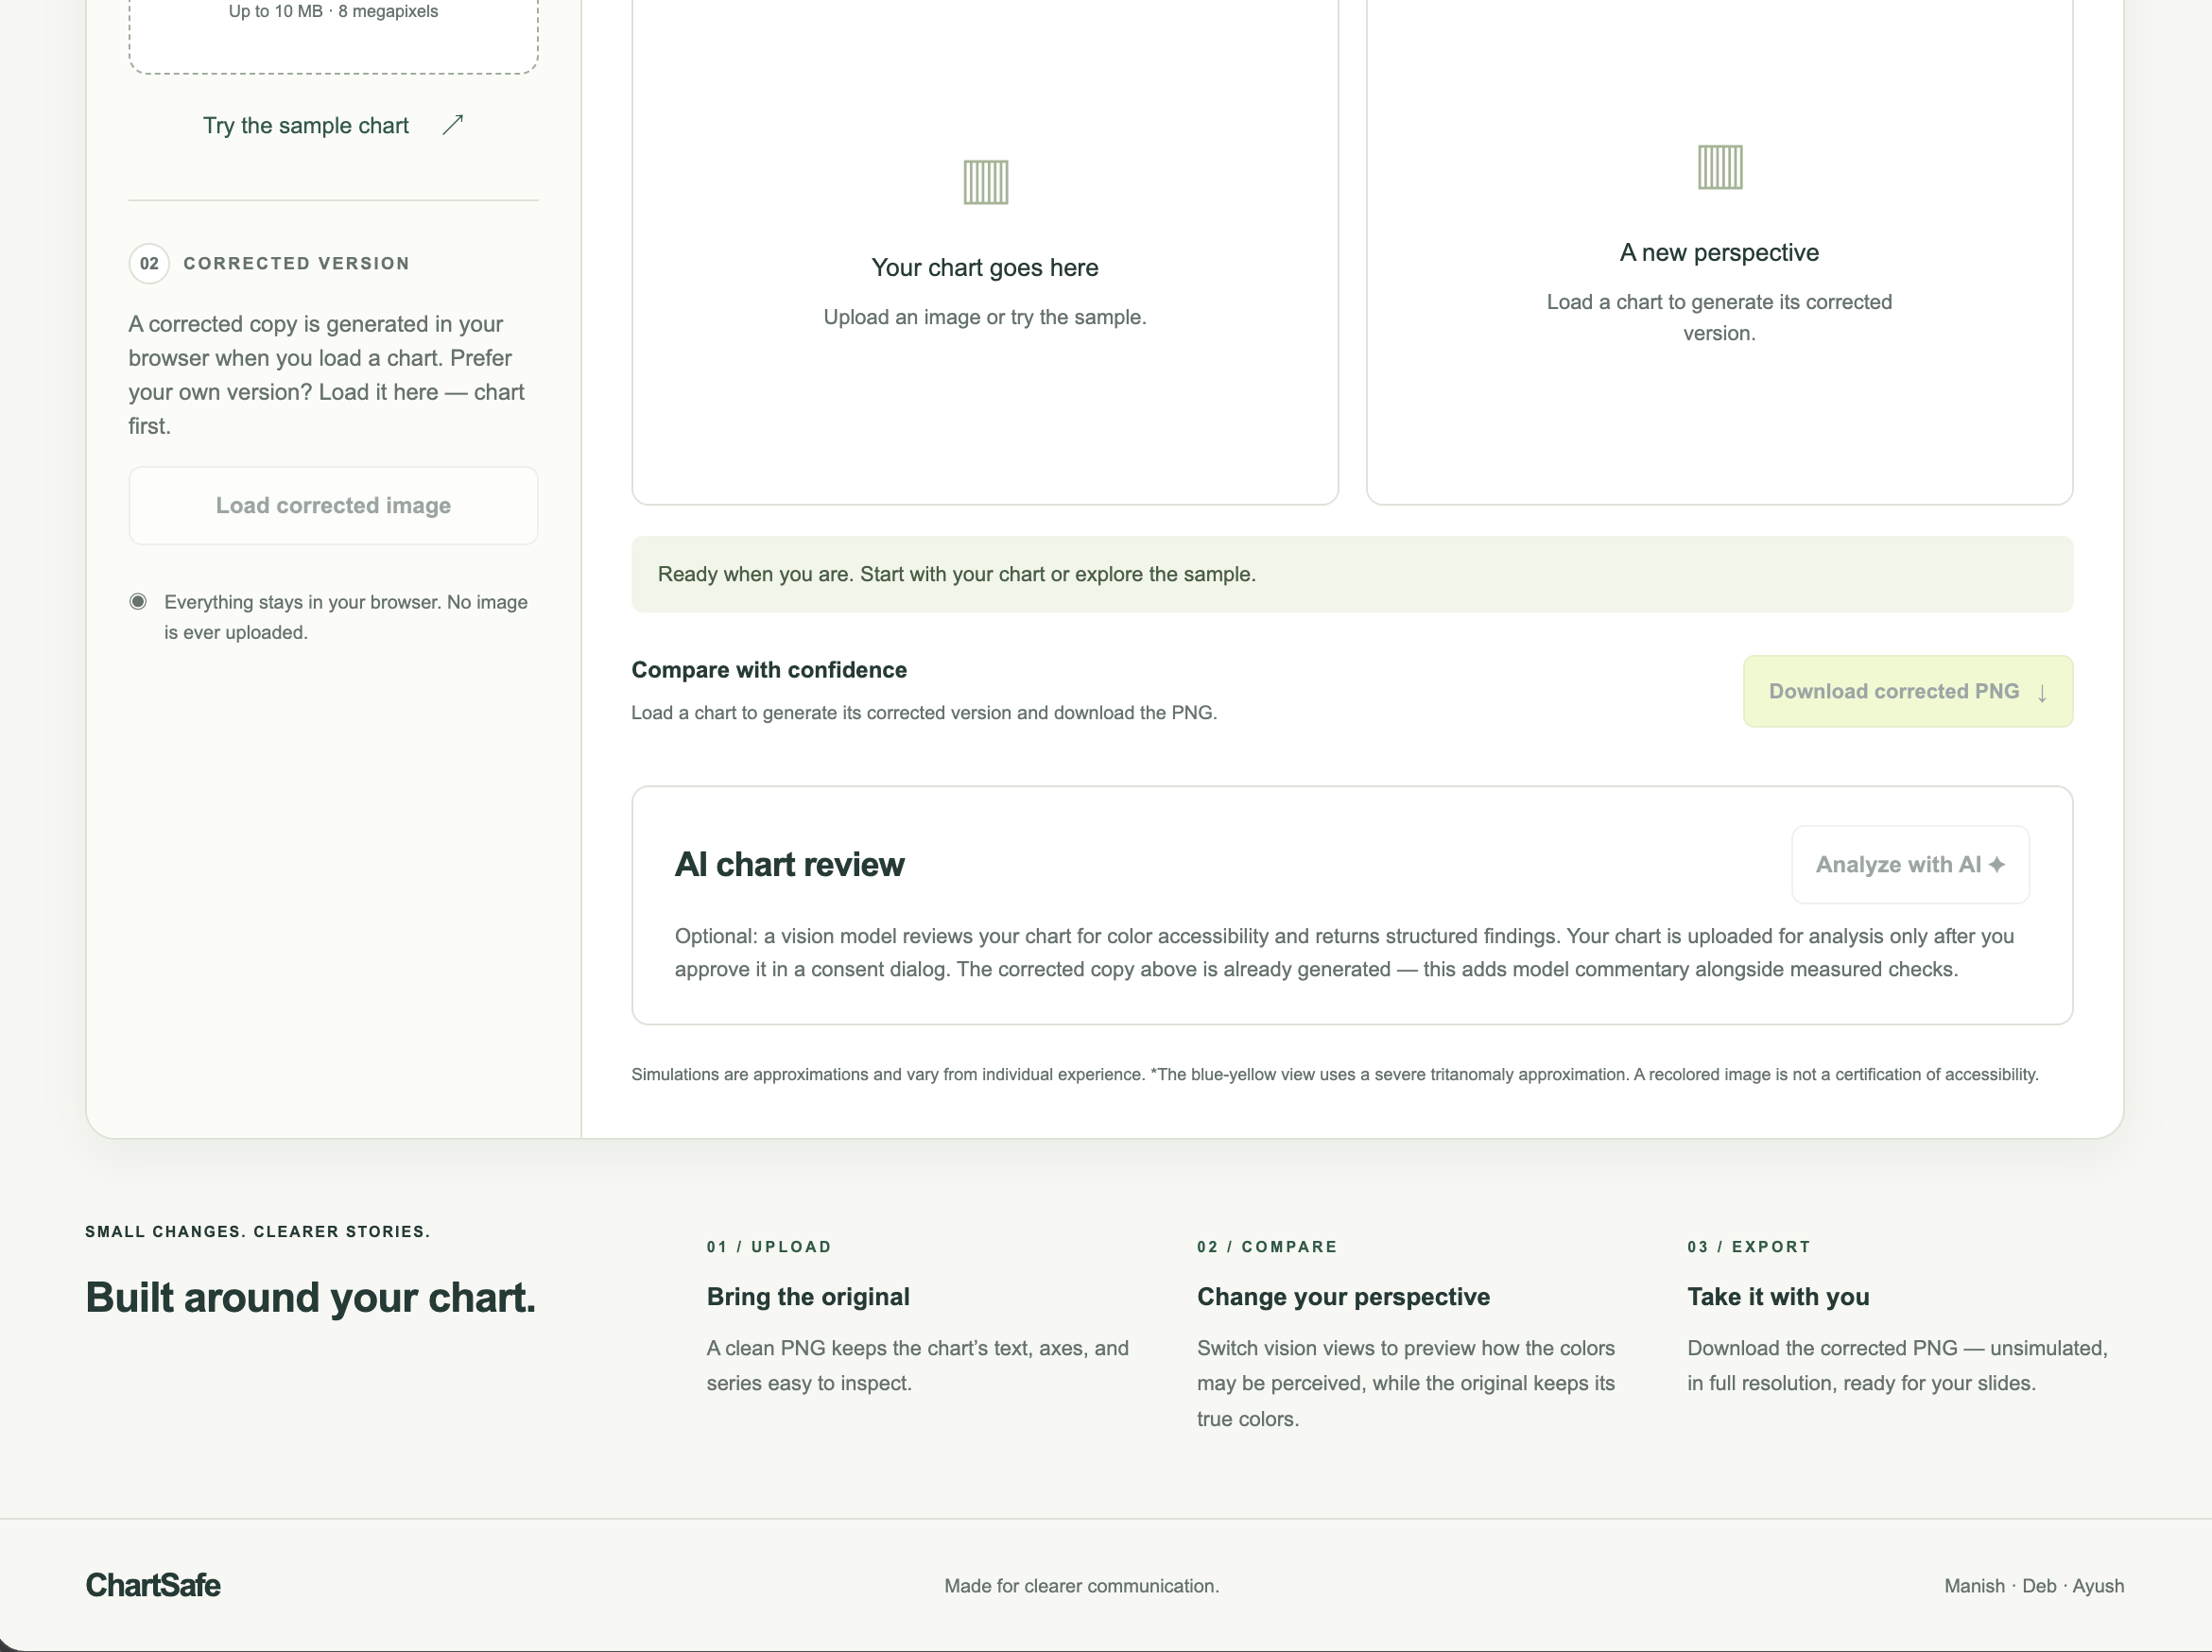
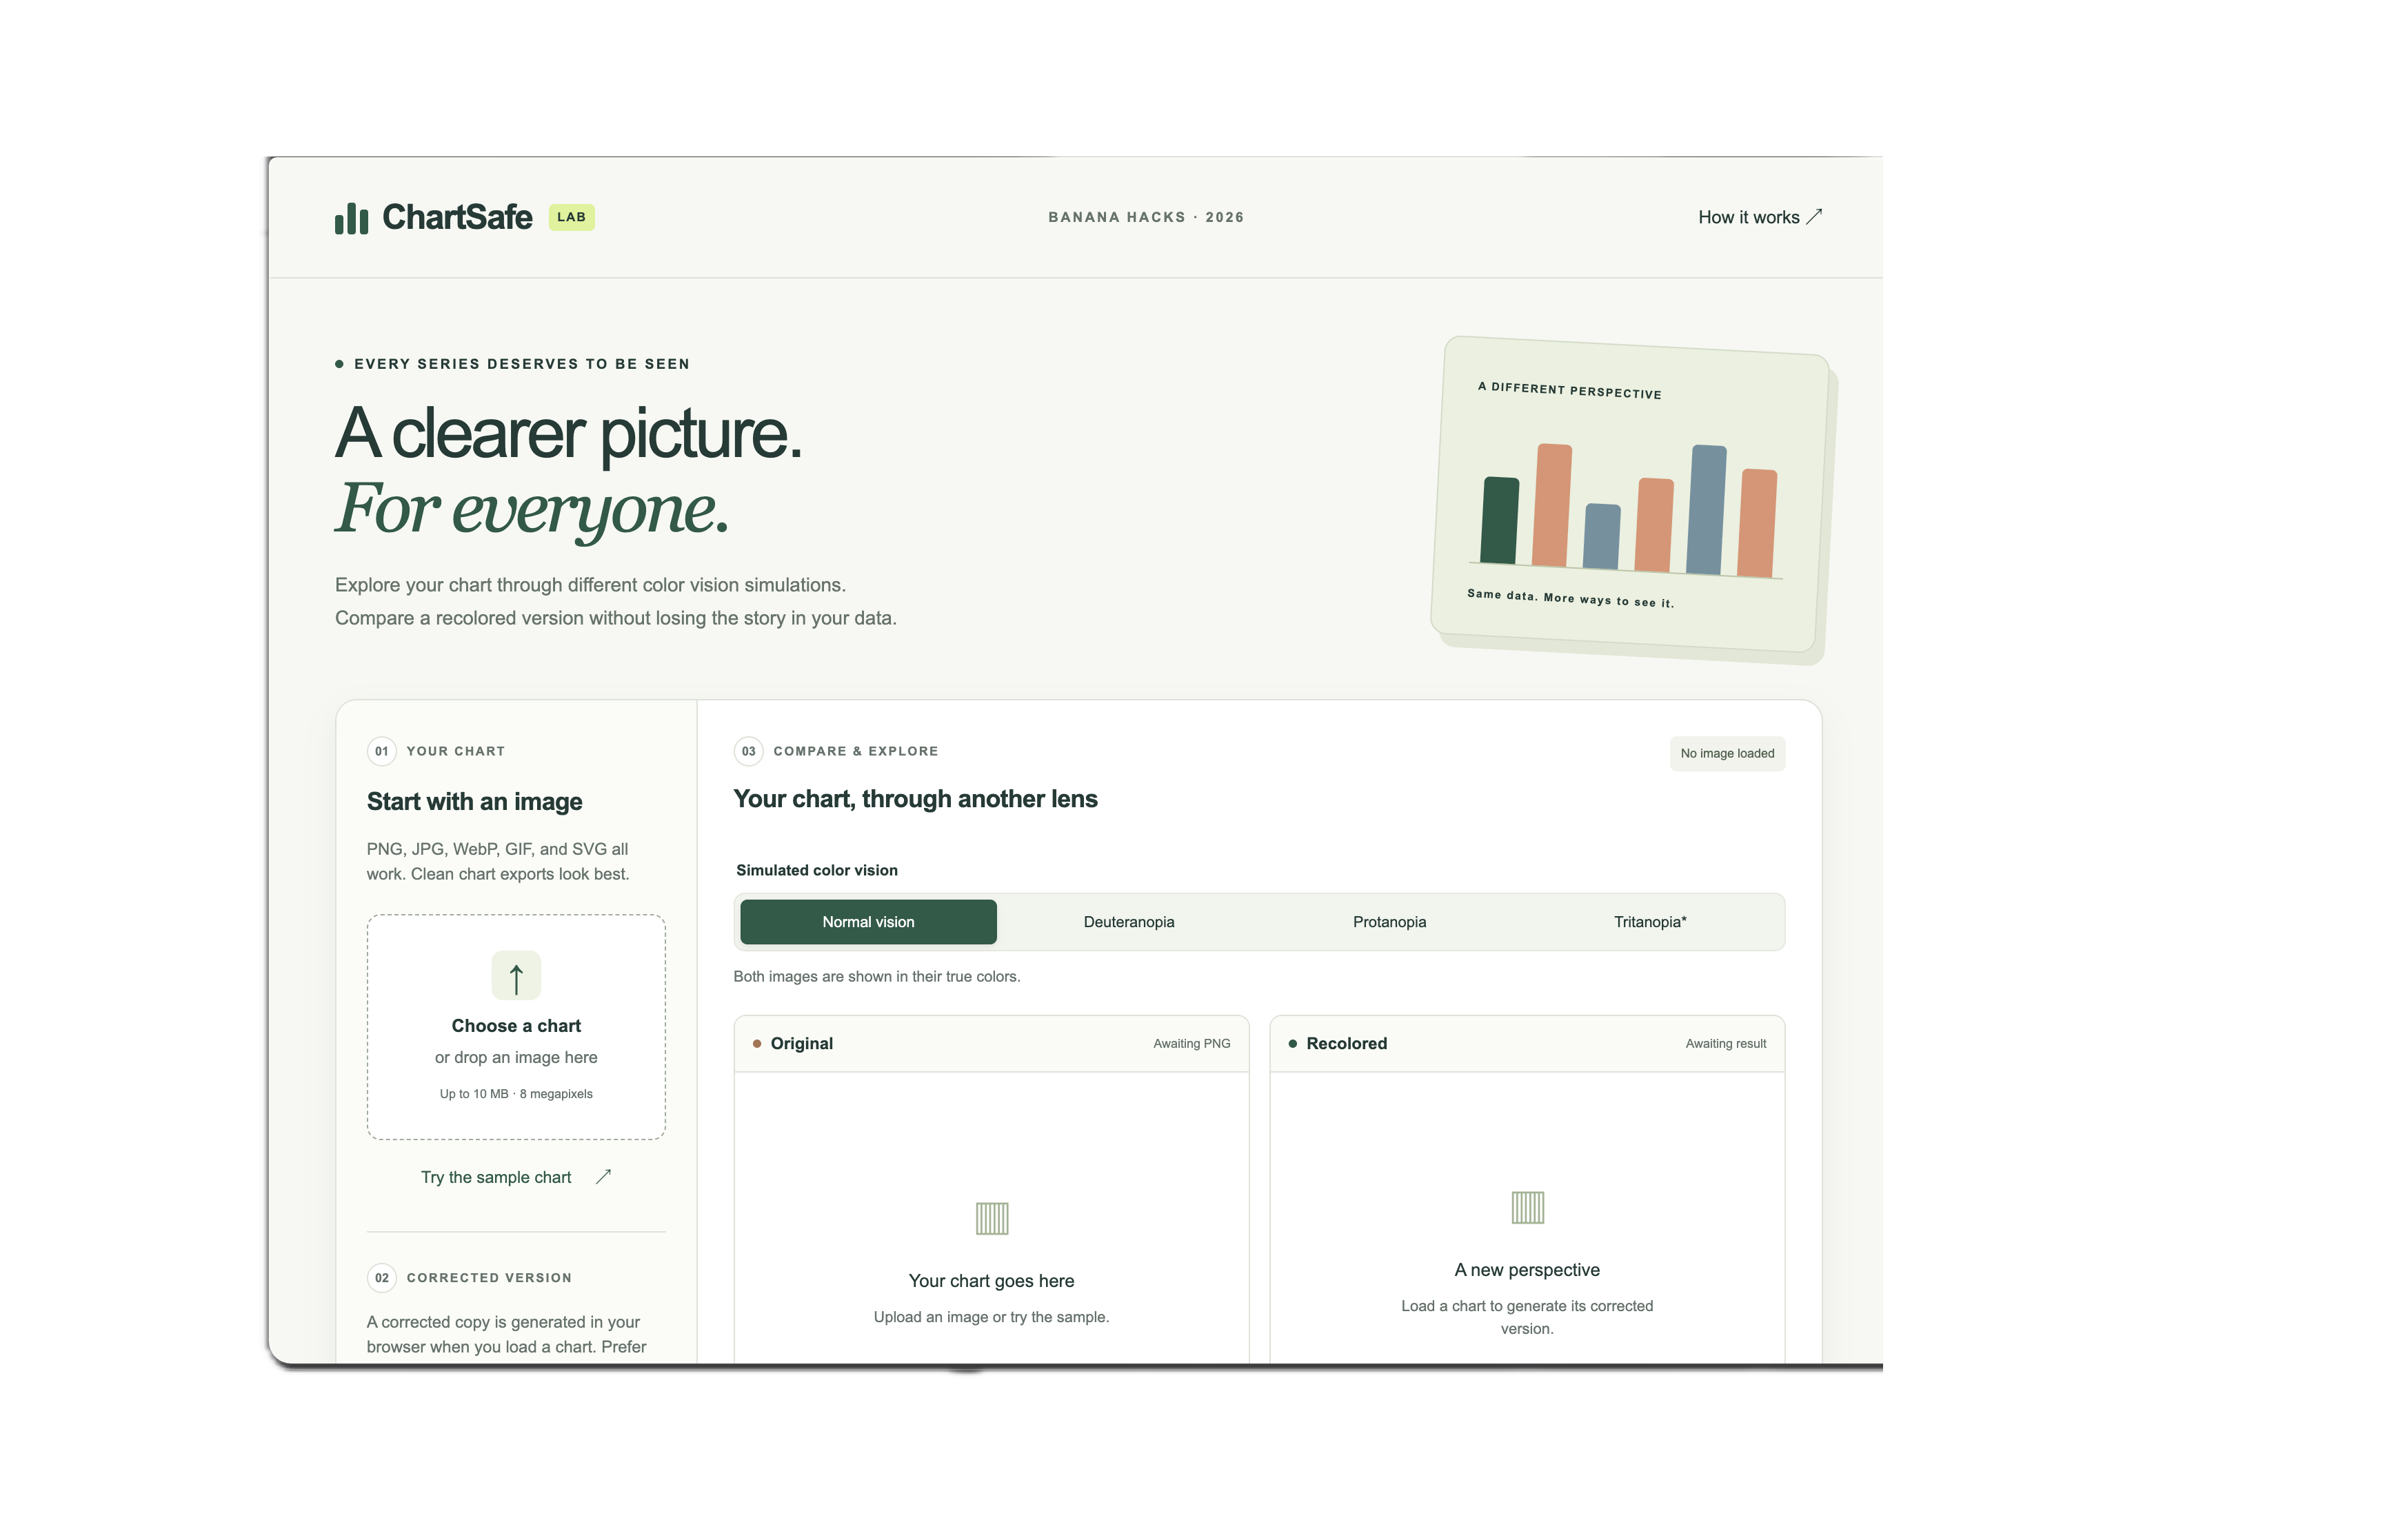
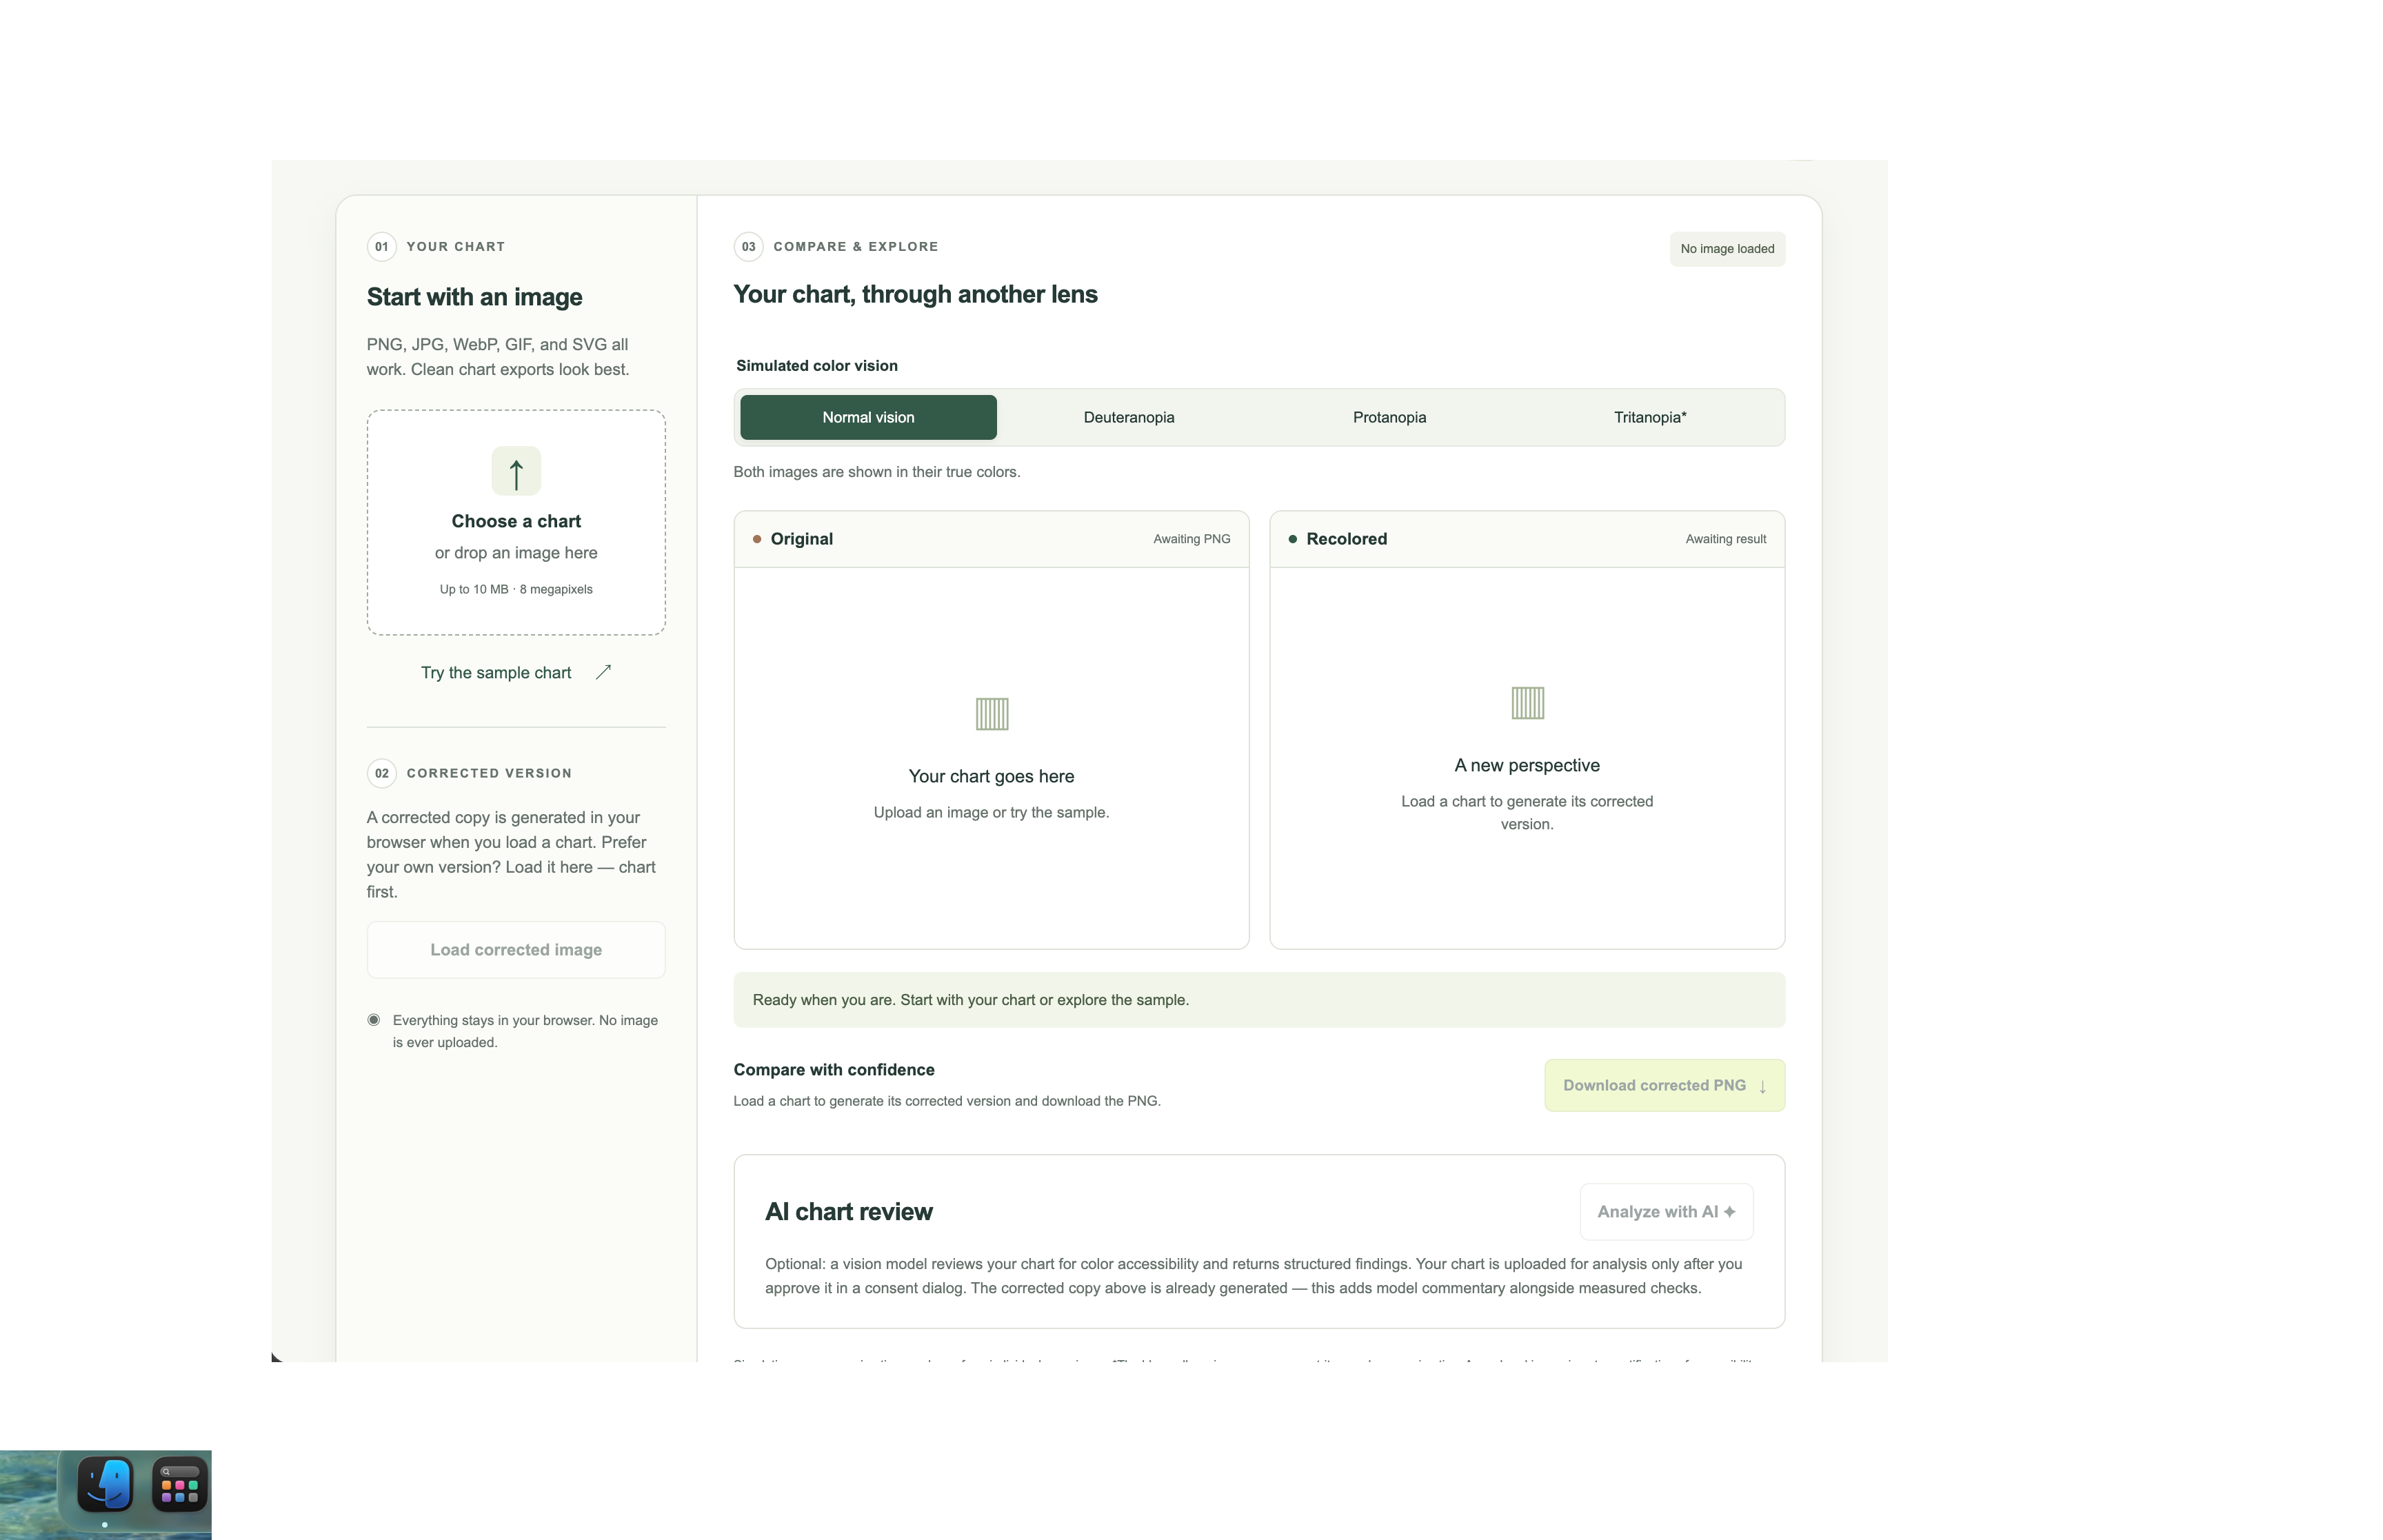
ChartSafe helps users make existing PNG images or charts easier to interpret by changing the colors slightly to help people with colorblindness distinguish them more easily. The processing pipeline starts by identifying dominant colors and mapping them to the Okabe–Ito palette. An optional AI model then reviews the chart and proposes further color adjustments, which the app applies and checks using measured color differences. Using these layers, we can provide a recolored version of the original chart or image that is easier to interpret for people with different color-vision needs. The interface lets users recolor and then analyze the recolored image for a more accurate understanding of the graph.
How we built it
We built the website with HTML, CSS, and JavaScript, using the Canvas API to process images, recolor charts, and display the simulated images. Our Node.js backend uses Busboy for uploads and pngjs for PNG processing. It connects to a vision AI model that works in three layers. The first step is to check the colors, then suggest colors to change to and make the change, then check if the changes were valid and make corrections. We used anime.js for animation, npm for dependencies and GitHub for collaboration, alongside automated tests.
Challenges we ran into
Because we decided to divide and conquer parts of the project, connecting the backend and frontend was one of our greatest hurdles. Earlier code often conflicted with newer changes, and this caused problems with stuff like the uploads or previews to function incorrectly. We also had to fix bugs that caused issues like switching colorblindness views changing the original image instead of putting it in the "recolored" box. Additionally, finding a suitable generative AI model and connecting it to our project properly took up a lot of time, since we had to route responses and handle slower failed requests often. After finally dealing with the horde of bug fixes, we were able to get the website working as we wanted.
Accomplishments that we're proud of
Being a group of almost beginner coders, this was especially hard for us to accomplish in such a short time, but we were able to pull through with both the frontend and backend. We're especially proud of being able to make a tool out of image correction and AI into a working tool that was simply inspired by our past experiences.
What we learned
We learned how to connect and edit code that might not have been made for each other by connected the frontend and backend. We also learned how to integrate an AI model and work asynchronously over sites and tools like GitHub.
What's next for ChartSafe
Our goal is to make charts easier to interpret for people with various types of colorblindness. In the future, we want to add proper functionality for other types of media, such as videos. We also want to add functionality that allows you to change the colors of a chart to something anyone with any type of color vision can interpret, possible using an Okabe-Ito color palette, which is a color palette meant to have highly distinguishable colors. This will give users more control over the corrections they wish to make, and possibly expand to a wider user base.


Log in or sign up for Devpost to join the conversation.