-
-
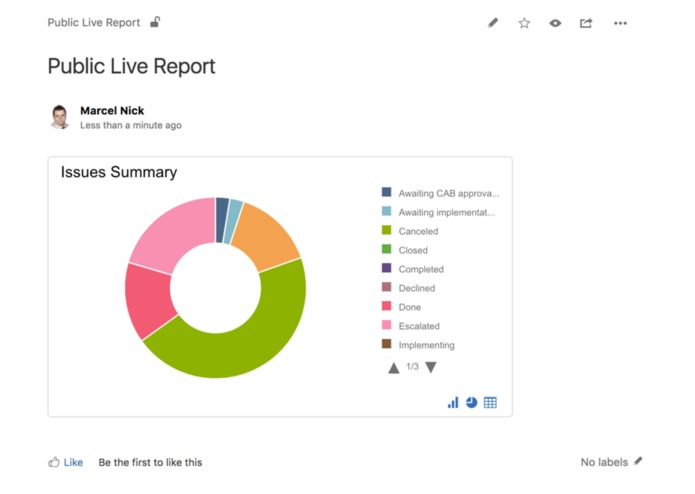
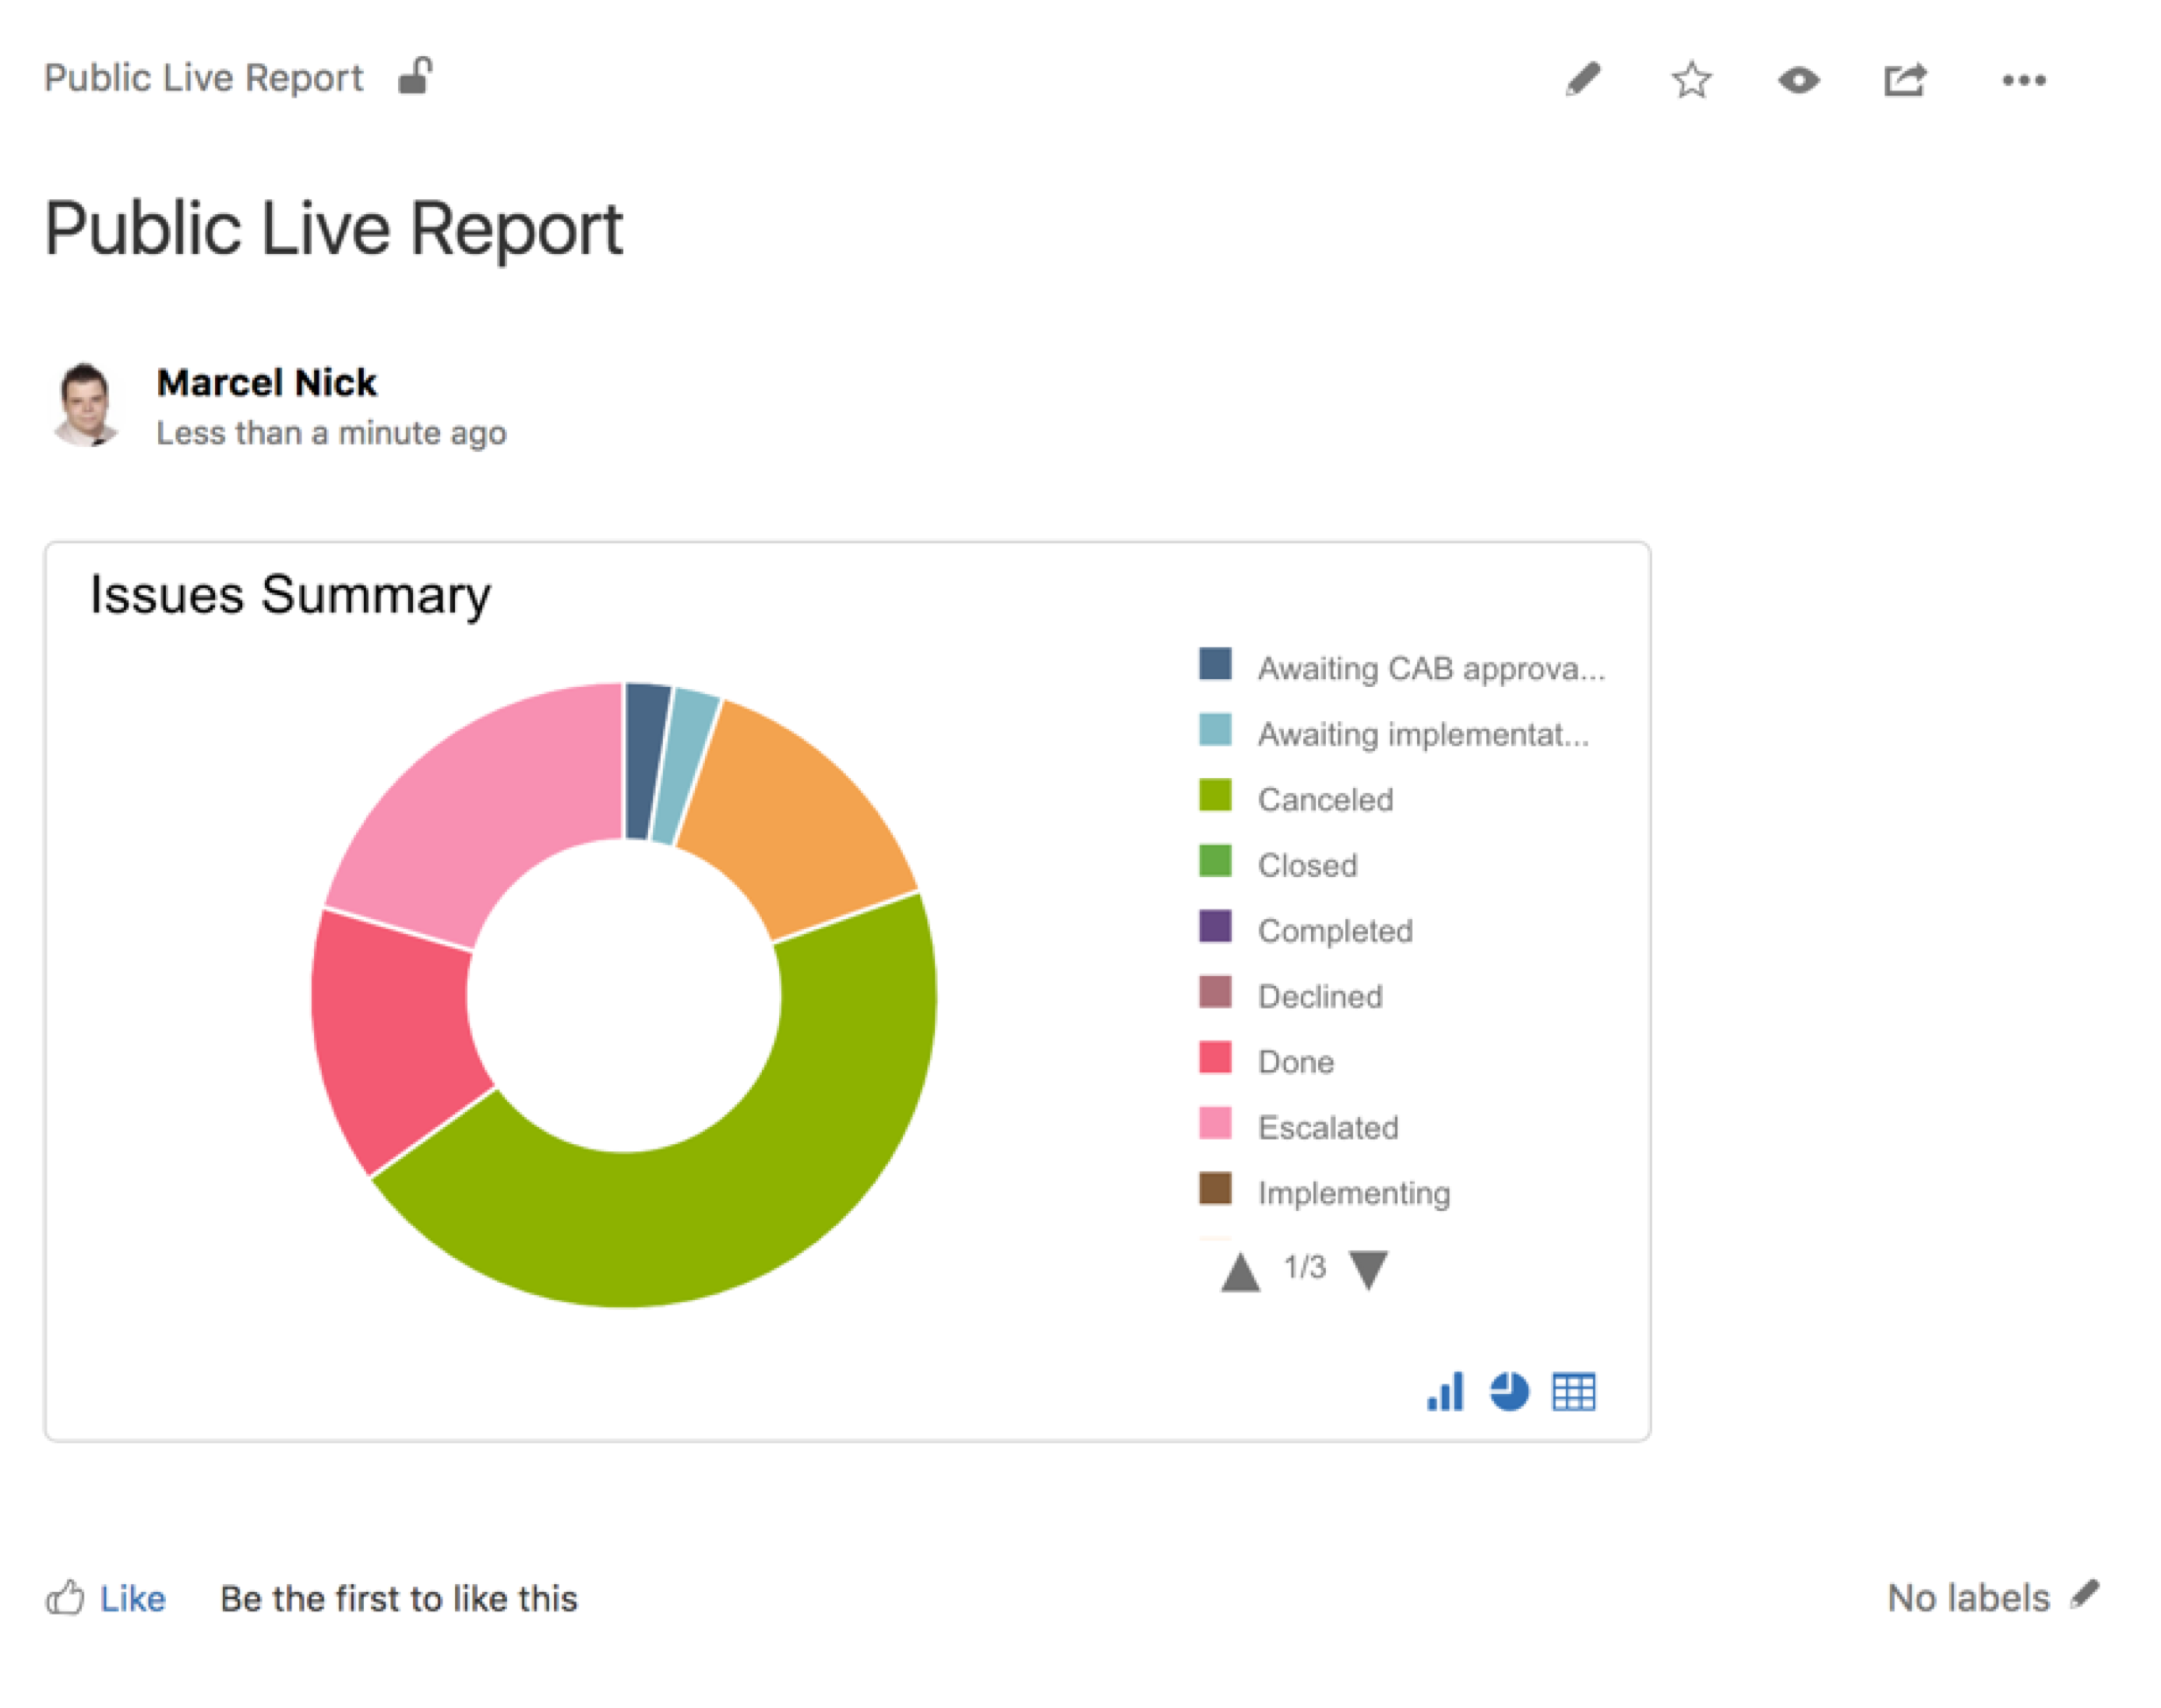
Publish charts to Confluence page
-
Share custom reports with your stakeholders

Inspiration
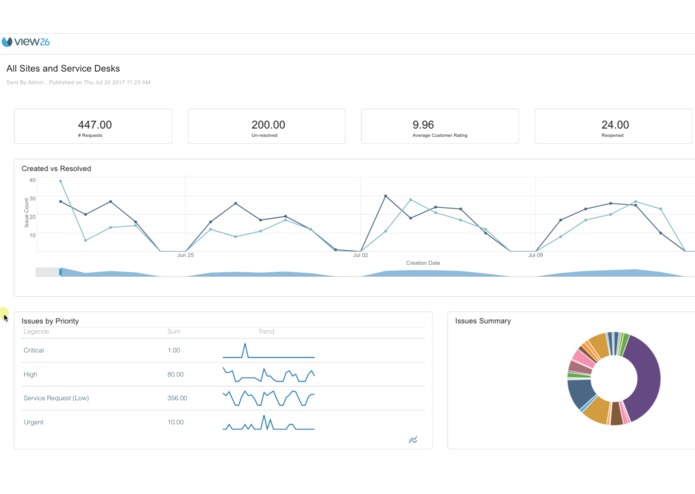
It all started during a customer meeting when we received a request for having a wall-board for Service Desk metrics which needed to be aggregated across several Service-Desk projects. We decided to create the add-on using the Atlassian Connect framework to start with.
What it does
- The add-on creates custom charts and reports across multiple Service Desk Projects with easily.
- Add-on allows you to share custom Service Desk reports with your stakeholders with one click reporting including publish reports to Confluence Pages.
- Add-on has several analysis tools for slicing and dicing data to get to actionable insights.
Accomplishments that we're proud of
The plugin achieves its goal of providing reporting transparency for organisations and to people outside the Service Desk team with easy to use Report builder.
What we learned
Working with Atlassian Connect framework is very easy and is well documented for rapid development.
What's next for Charts & Reports for Service Desk
Extending the add-on as a Server plugin.
Built With
- angular.js
- connect
- html5


Log in or sign up for Devpost to join the conversation.