-
-

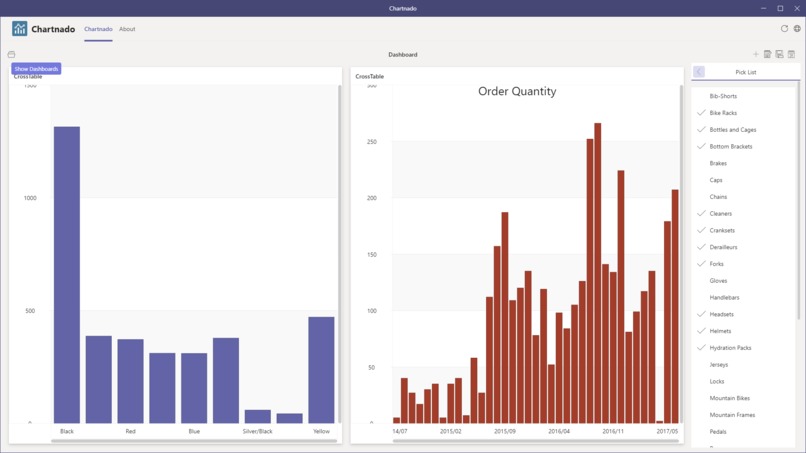
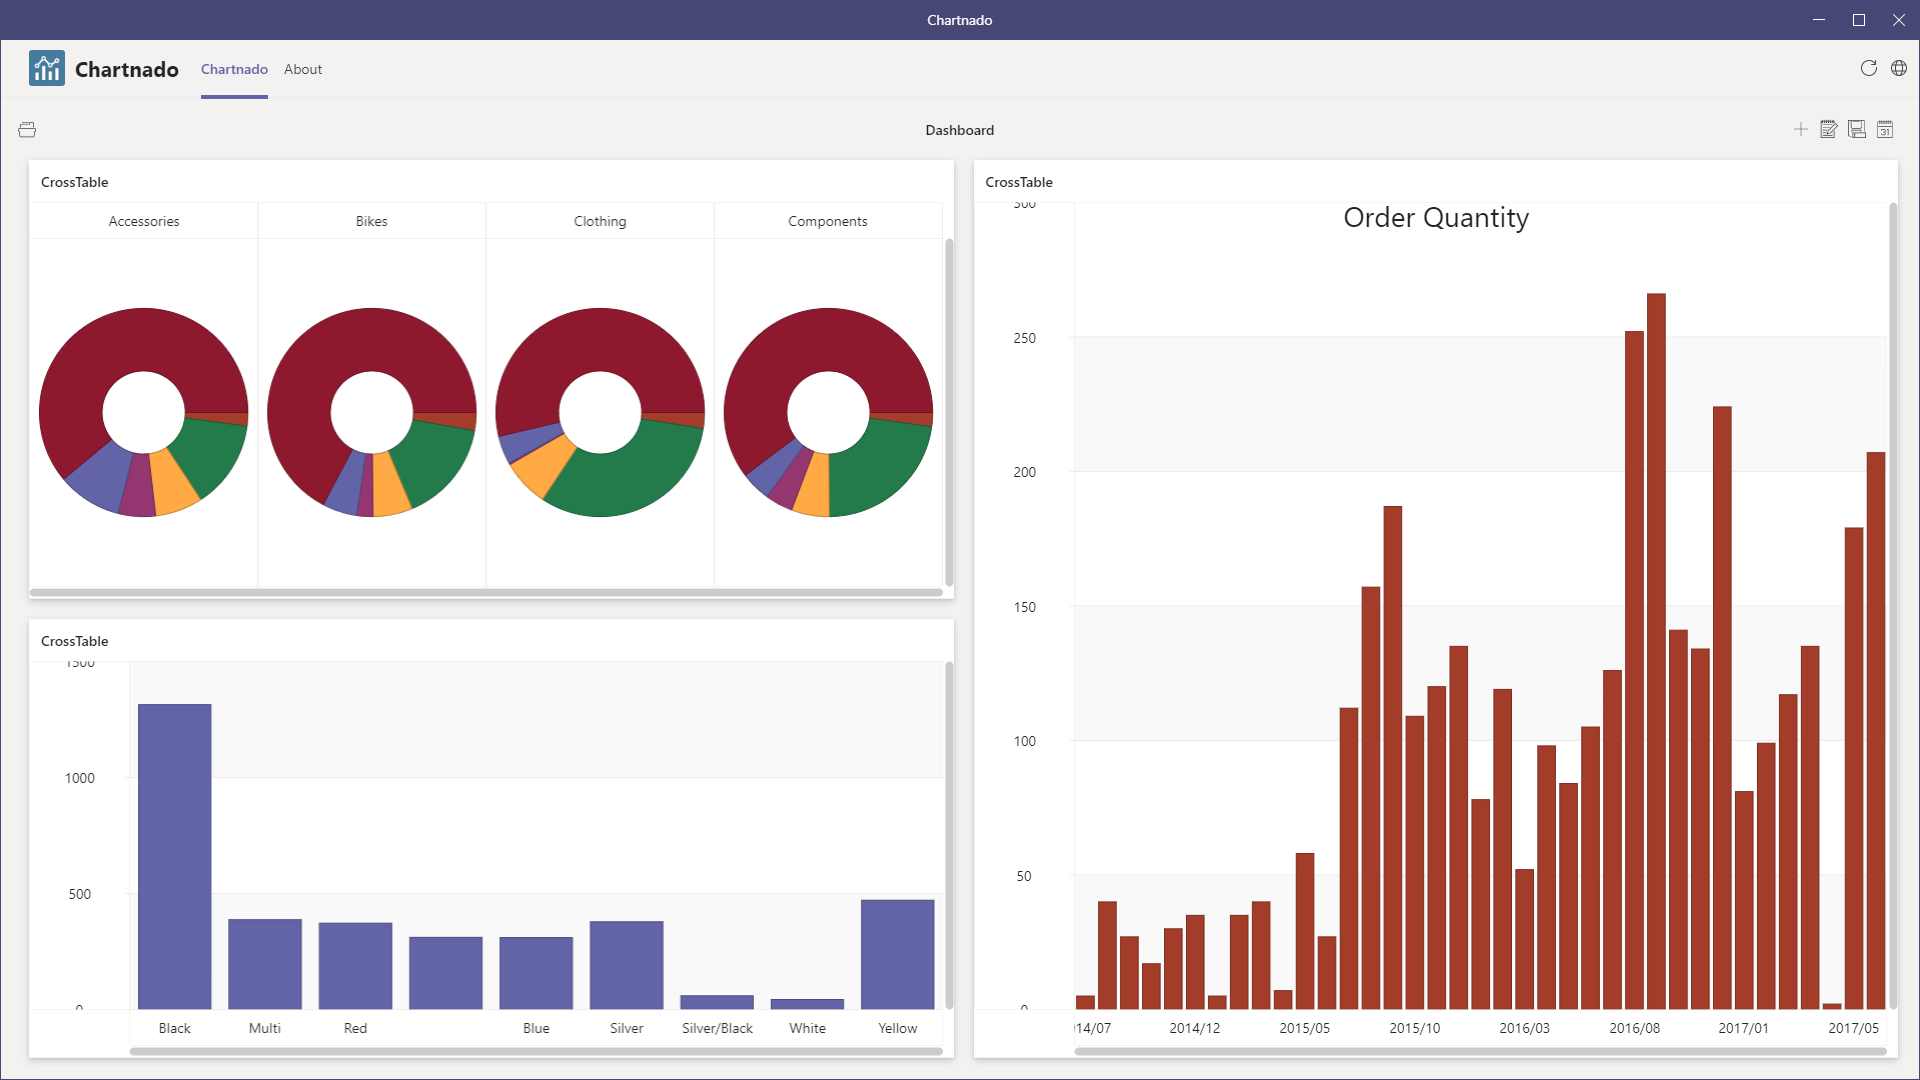
Dashboard
-
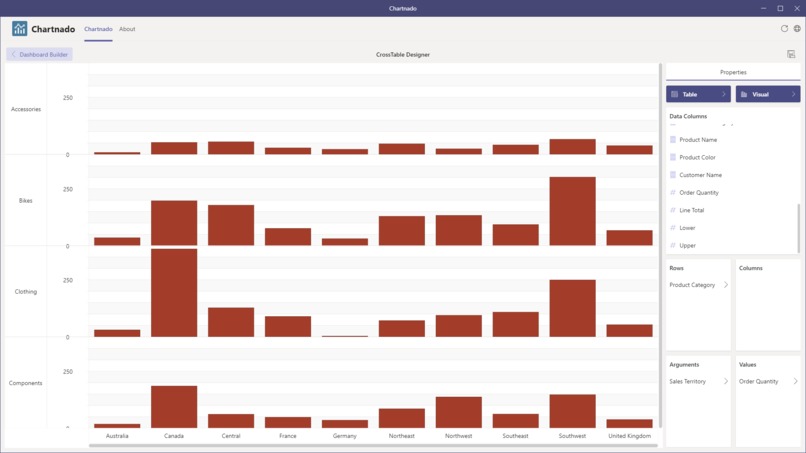
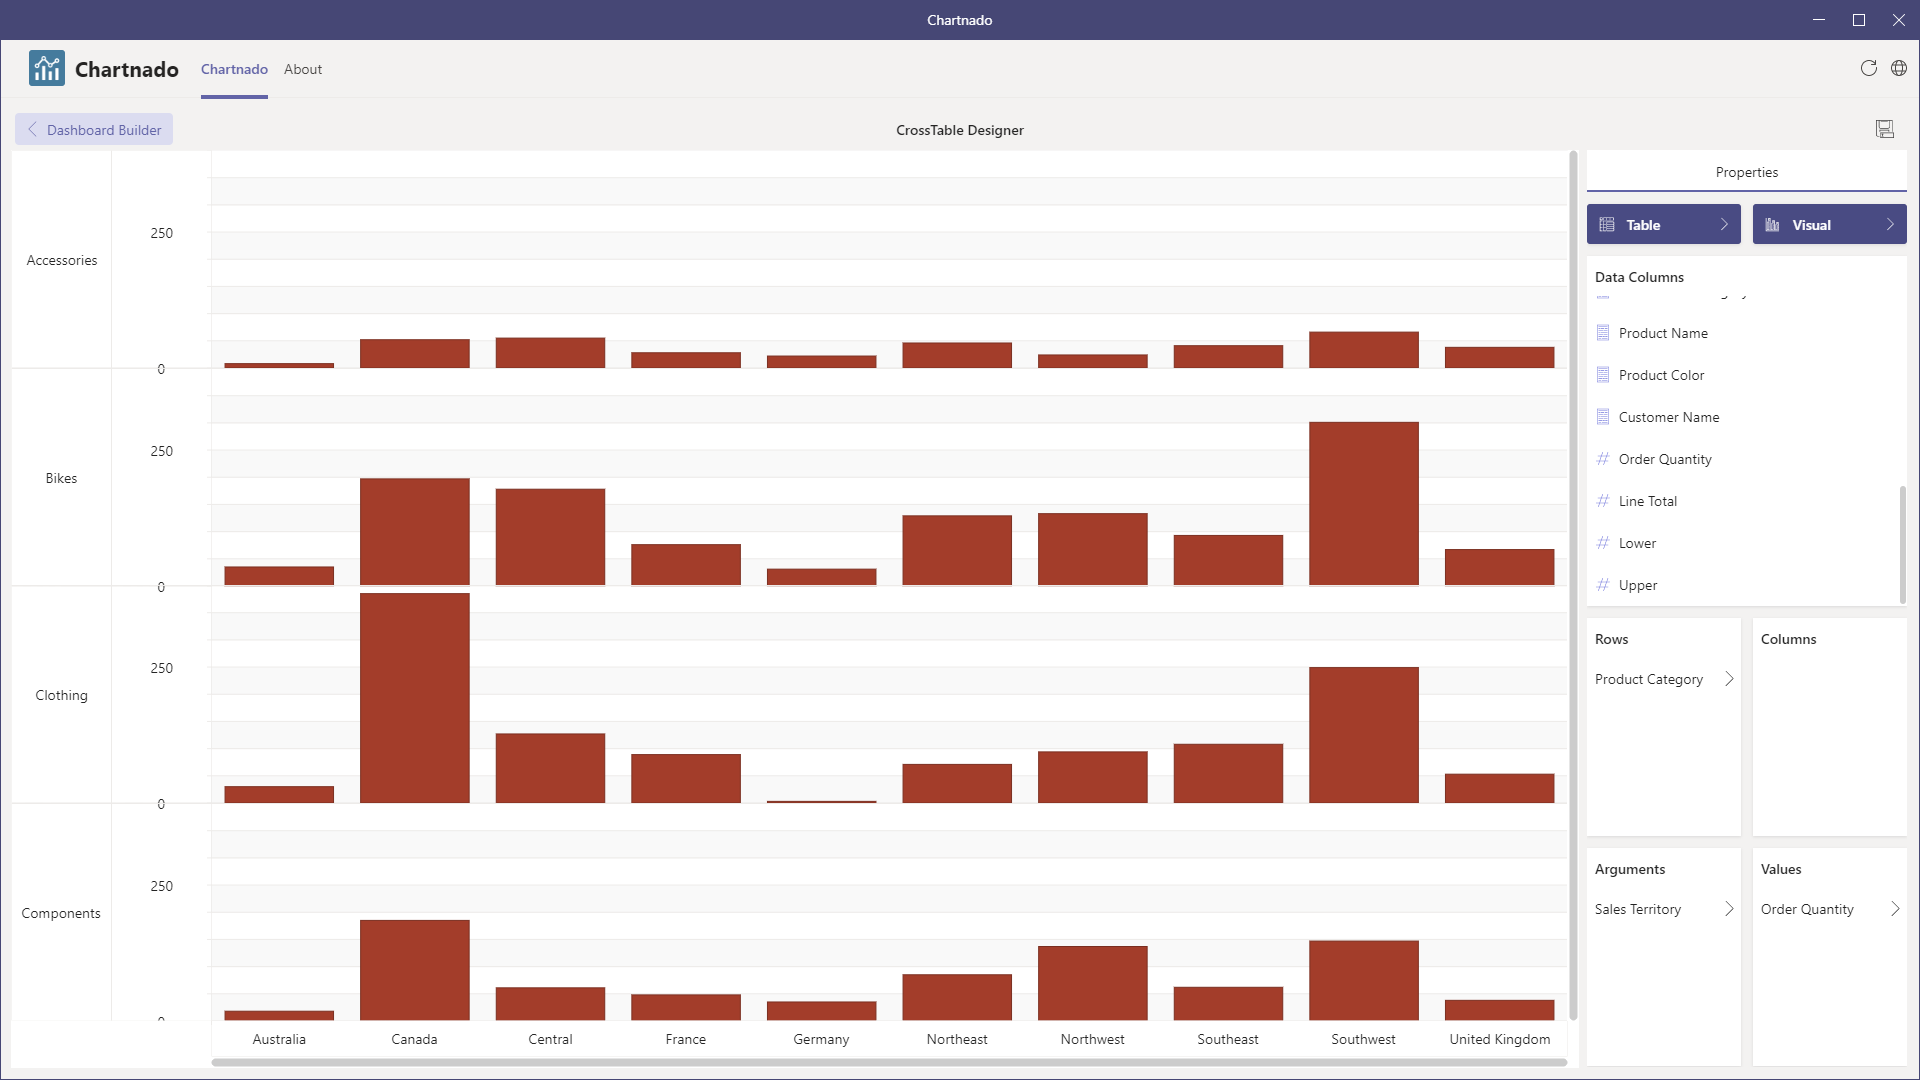
Cross table
-
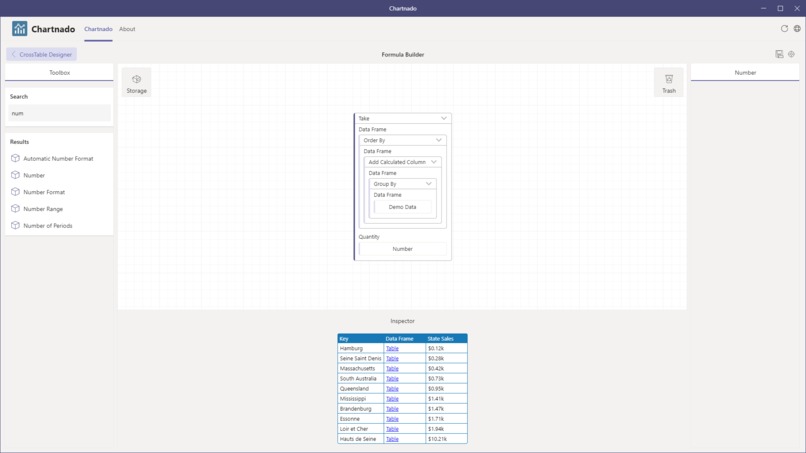
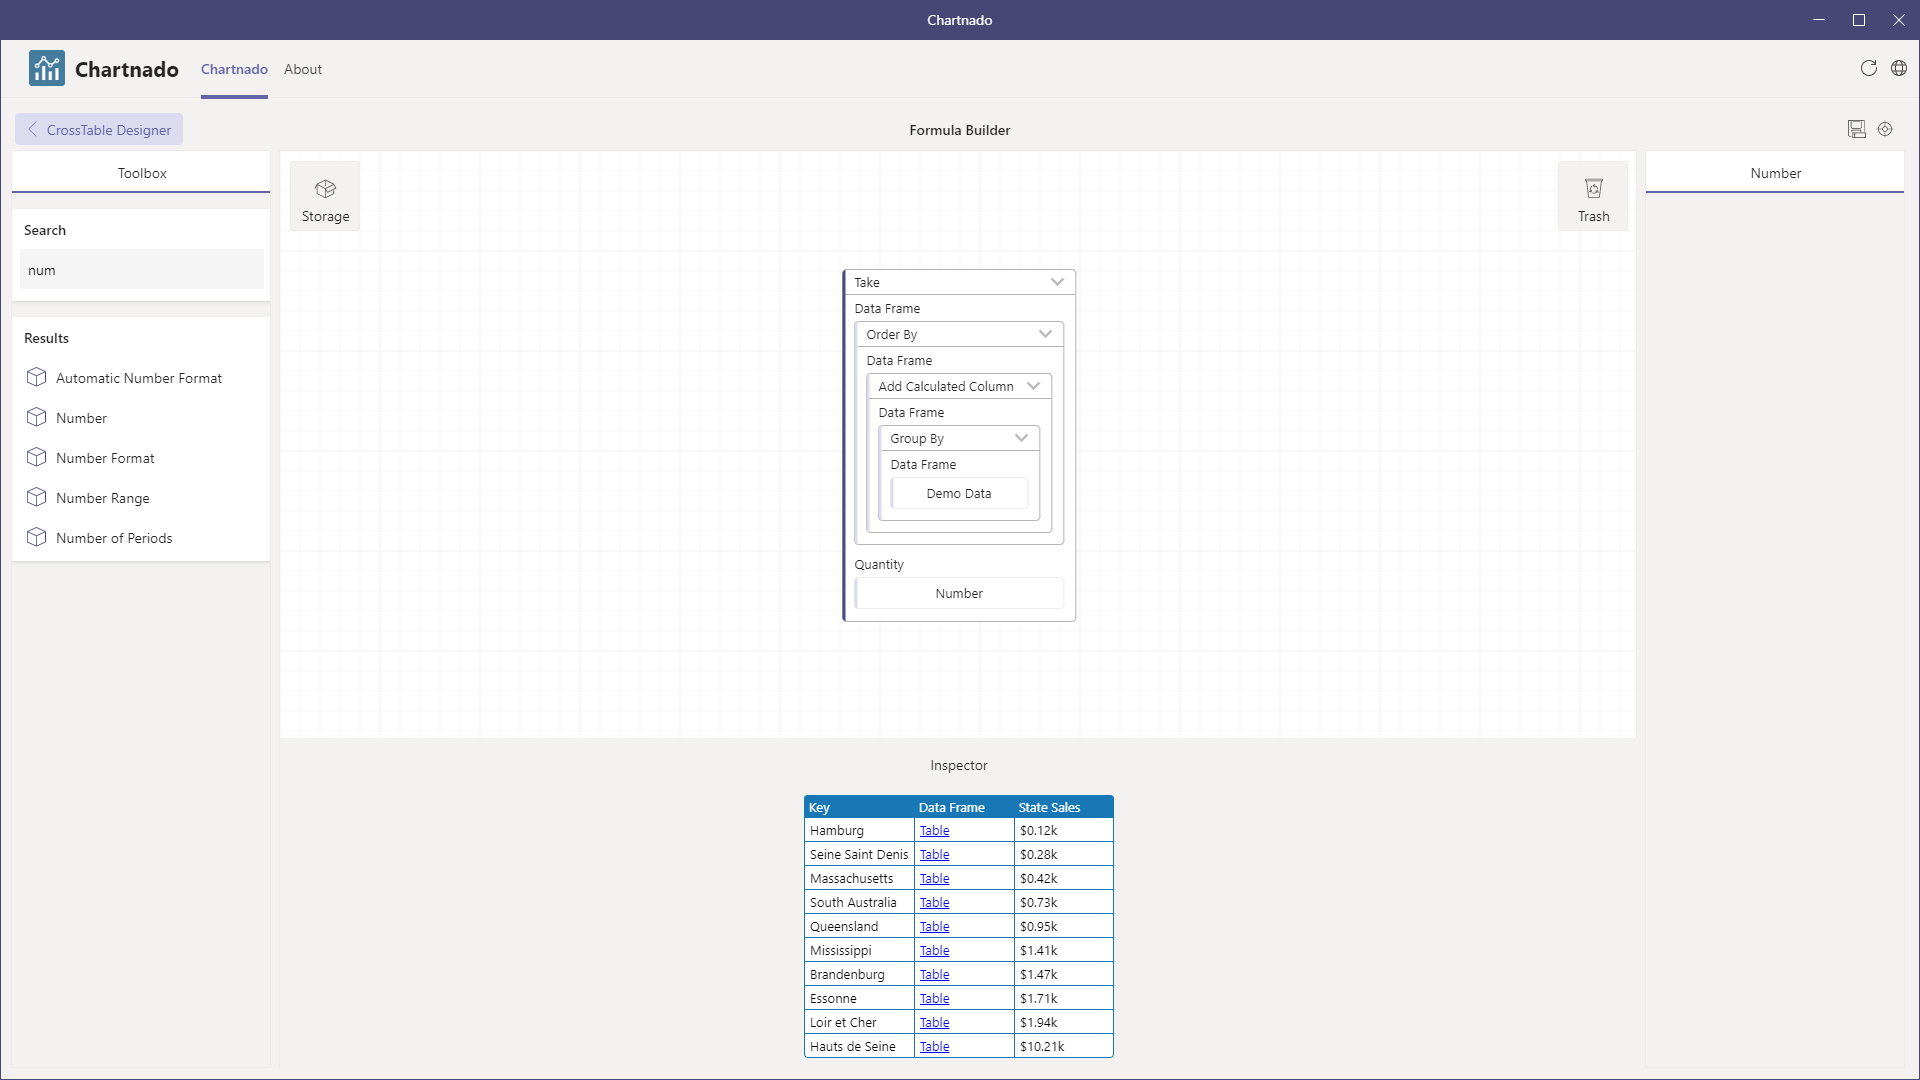
Data frame calculation
-
Parameters
-
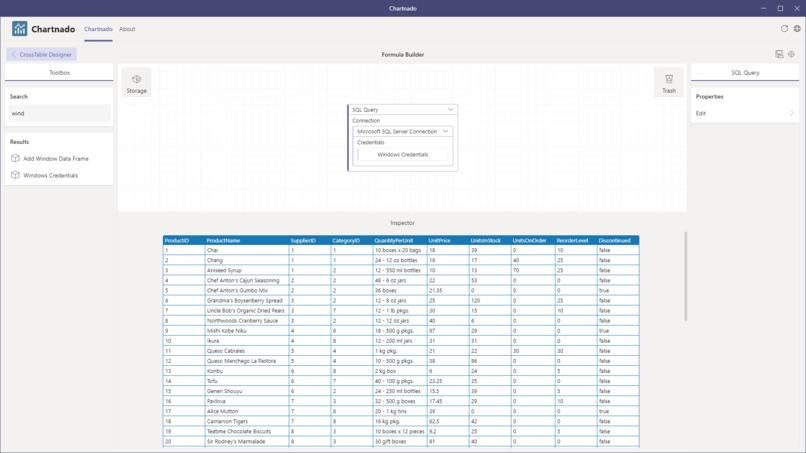
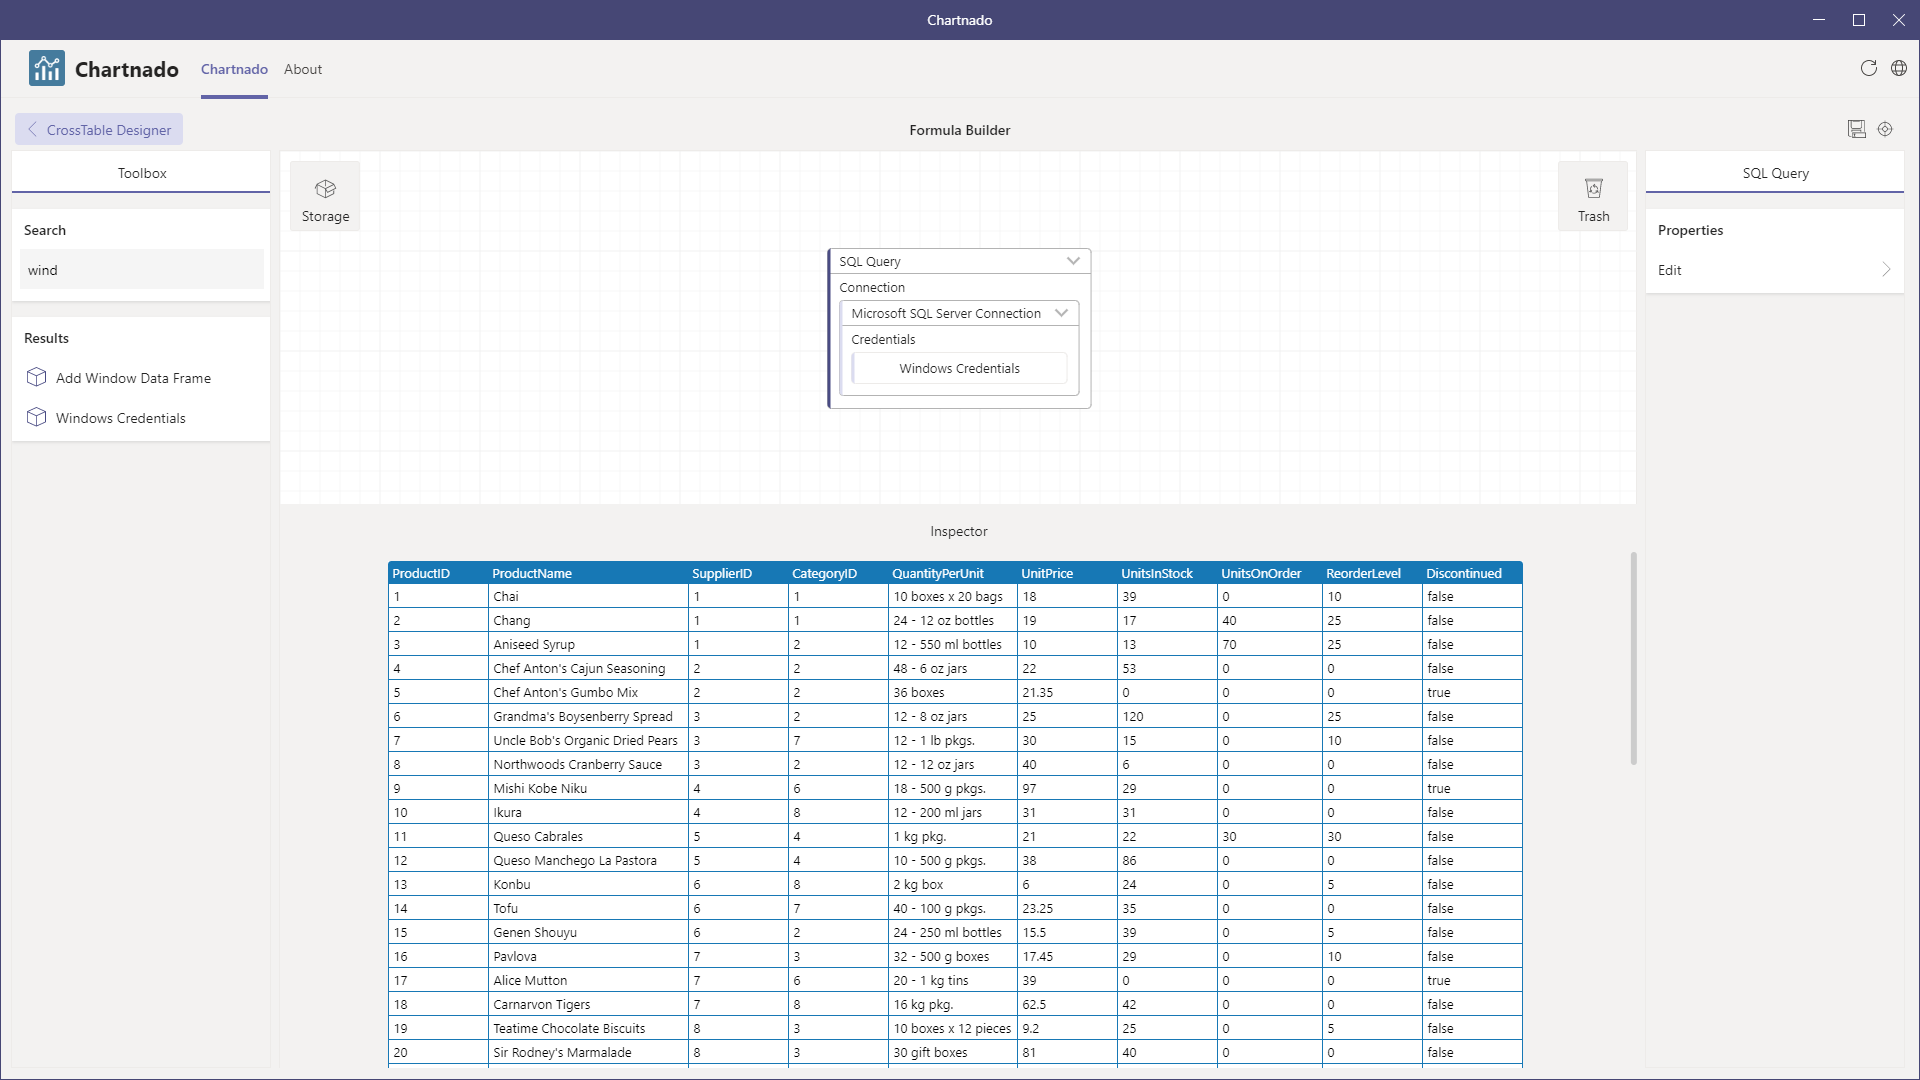
SQL Server connection

Inspiration
We wanted to combine the power and flexibility of big SQL data, the transformation capability of Power Query and the visual appeal of Tableau.
What it does
Chartnado queries a variety of data sources including:
- Excel Files
- SQL Server
- Analysis Services
- Power BI
- Kusto
- and more to come, including Oracle, PostgreSQL and MySQL
and feeds the query results through a business user friendly graphical functional expression builder, and finally supplies aggregated data to the visuals. There is significant conditional formatting capability based on the functional expression builder.
How we built it
Chartnado is a single page application built in TypeScript that uses an ASP.NET Core back-end as a data proxy to database servers hosted in the cloud. In a future version Chartnado will also connect to on-premise data sources using Teams tenant app deployment combined with a local data proxy.
Challenges I ran into
OAuth token authentication for data access was an interesting learning experience.
Accomplishments that we're proud of
We are a small team with limited resources but we managed to deliver a big application in a small package.
What we learned
esbuild is excellent. Webpack is less excellent.
What's next for Chartnado
We plan to add additional visuals, data sources and the on-prem data proxy.
Built With
- asp.net
- azure
- c#
- chart
- data
- microsoft-graph
- sql
- teams
- typescript

Log in or sign up for Devpost to join the conversation.