-
-
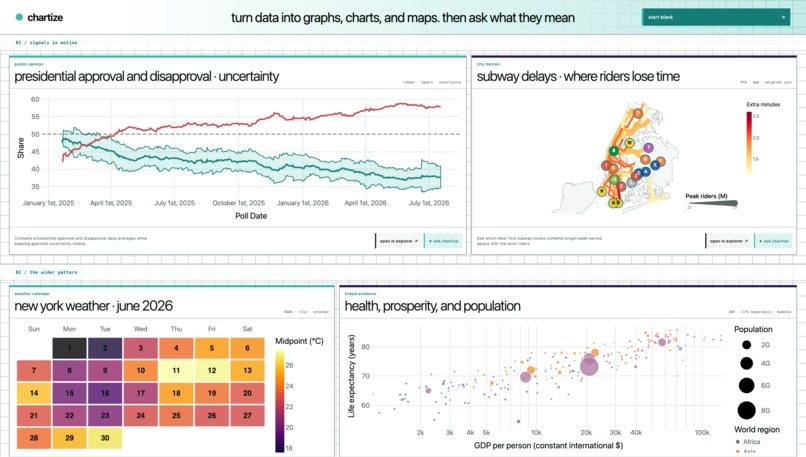
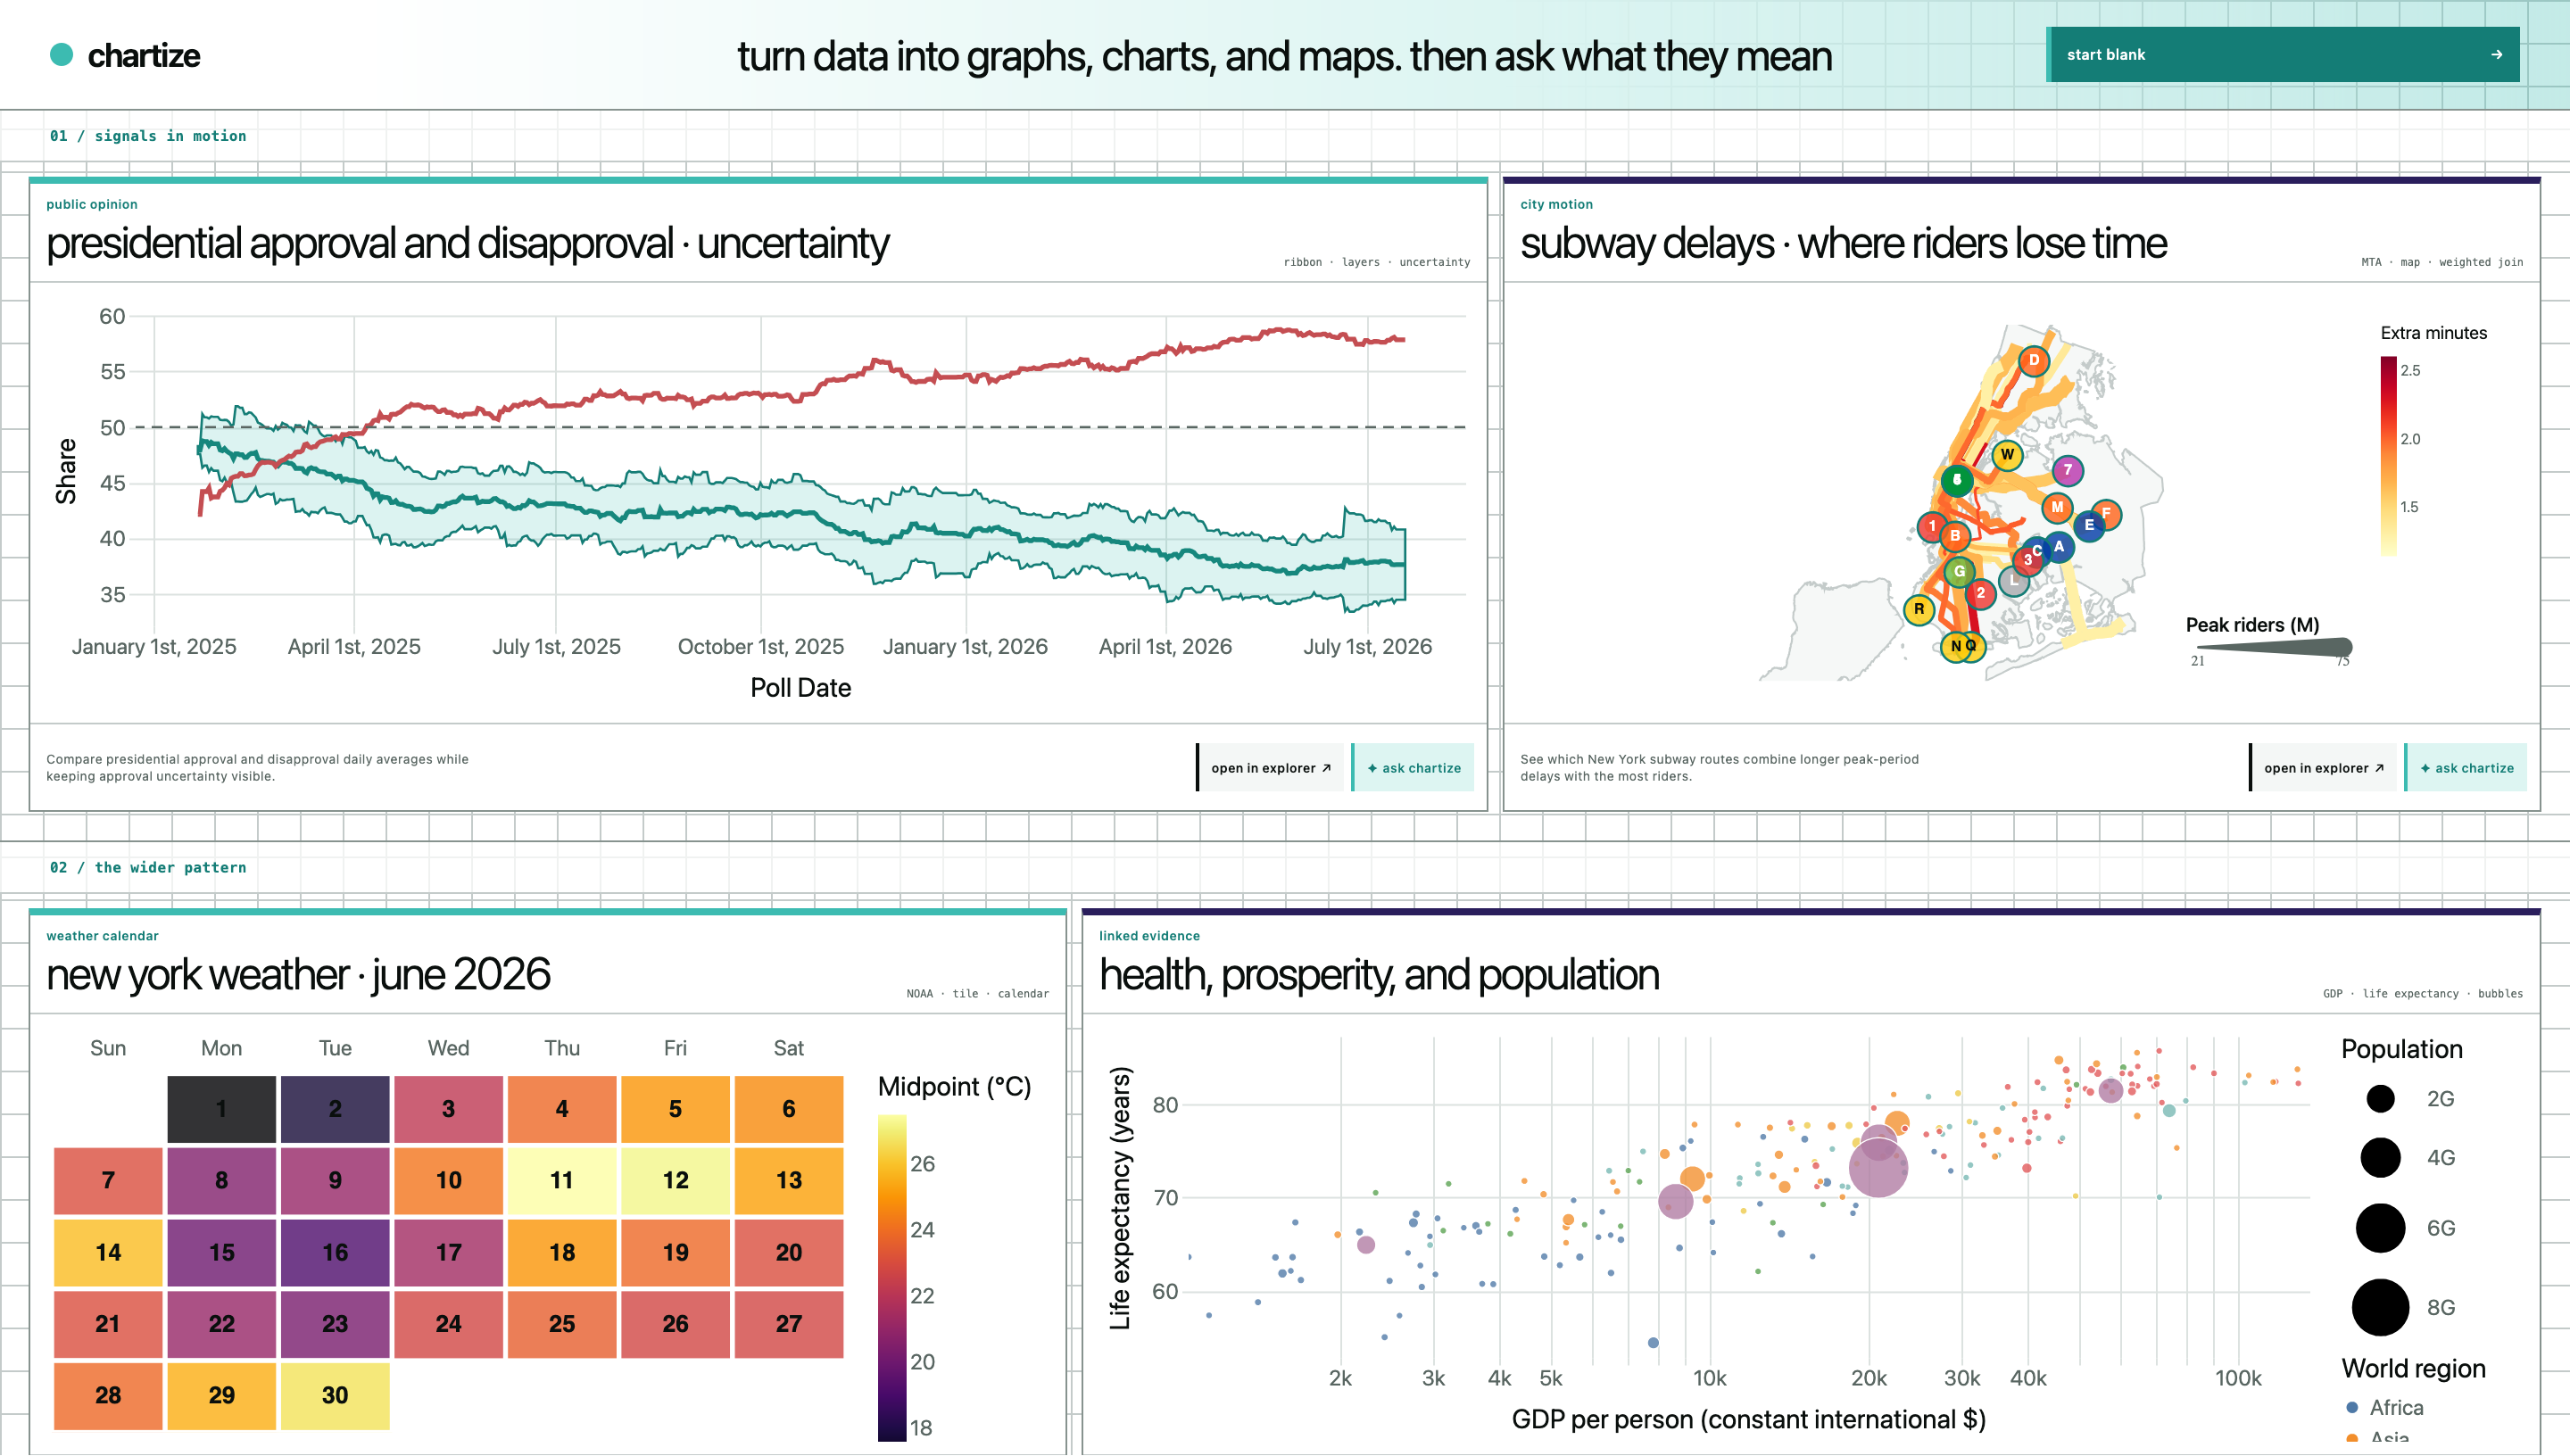
Chartize splash
-
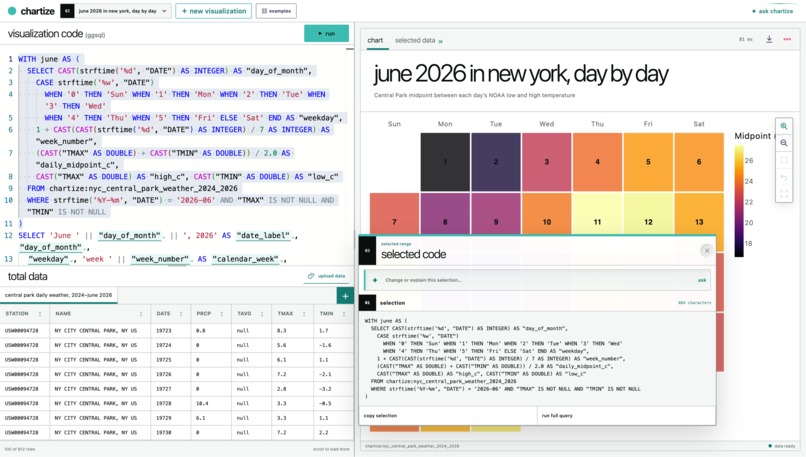
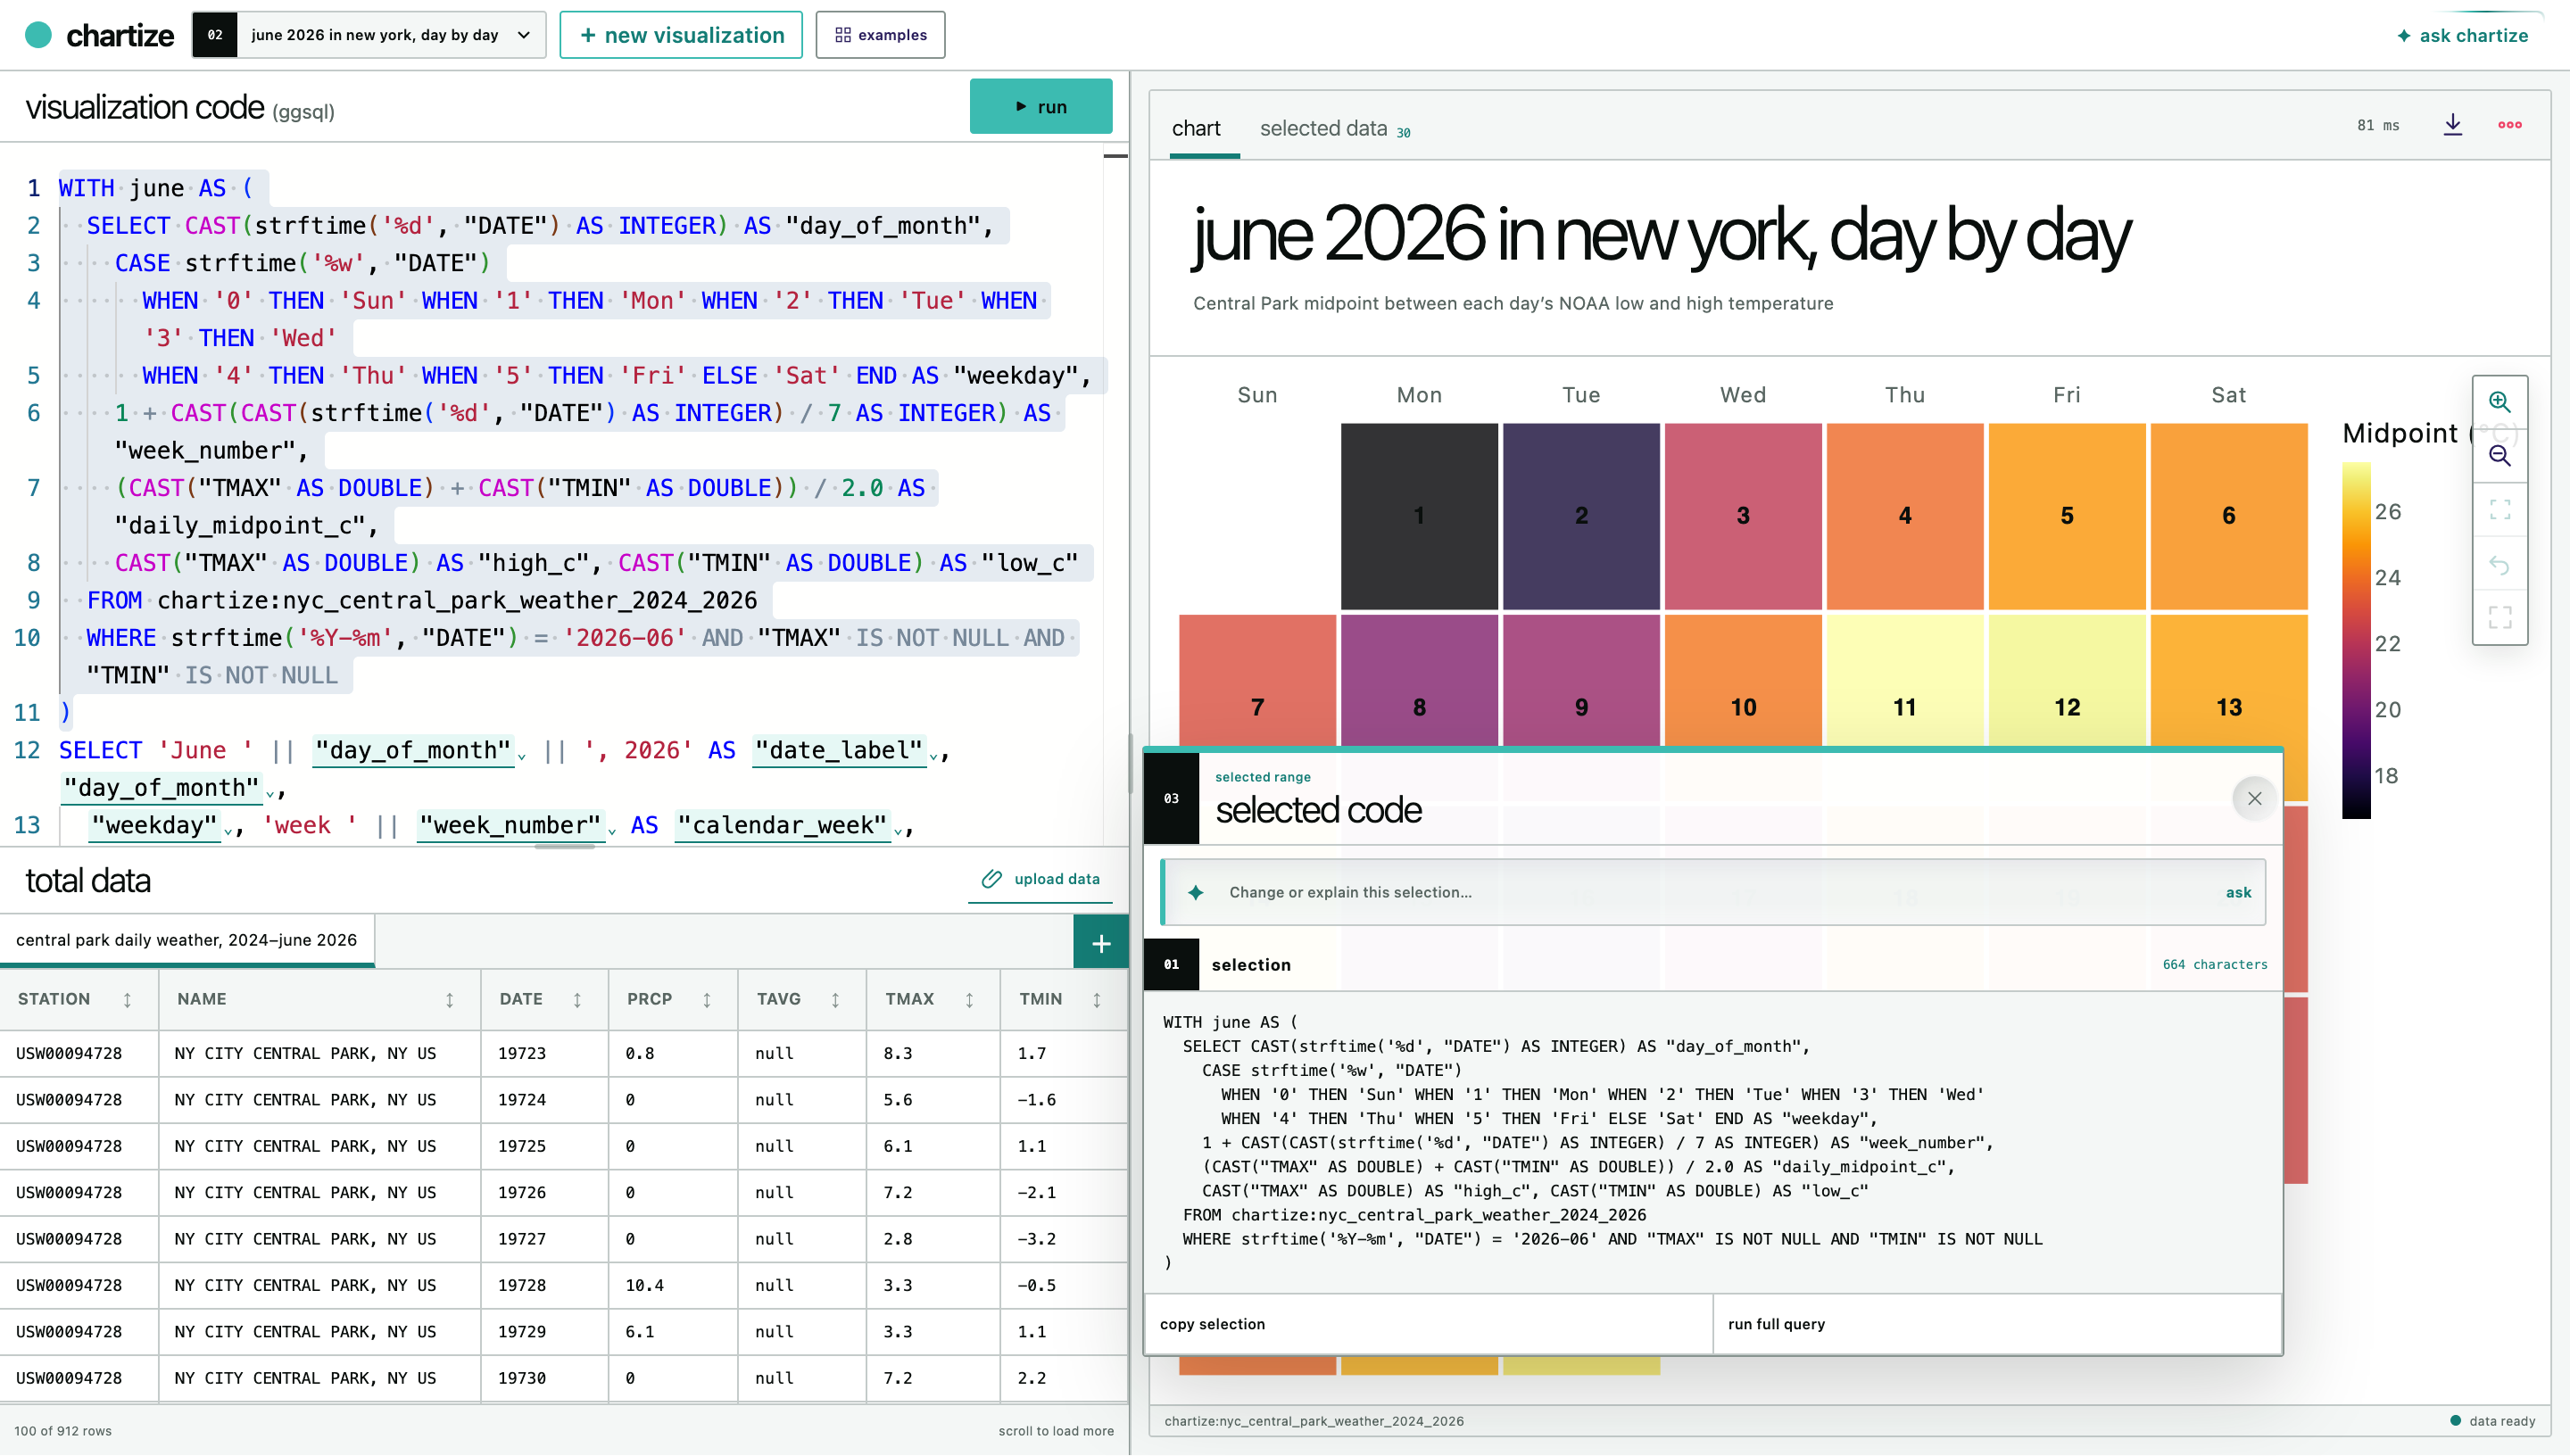
Chartize code explorer
-
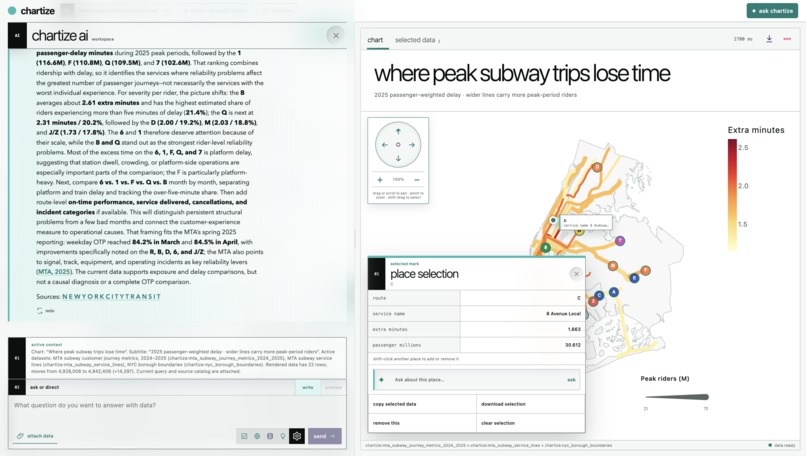
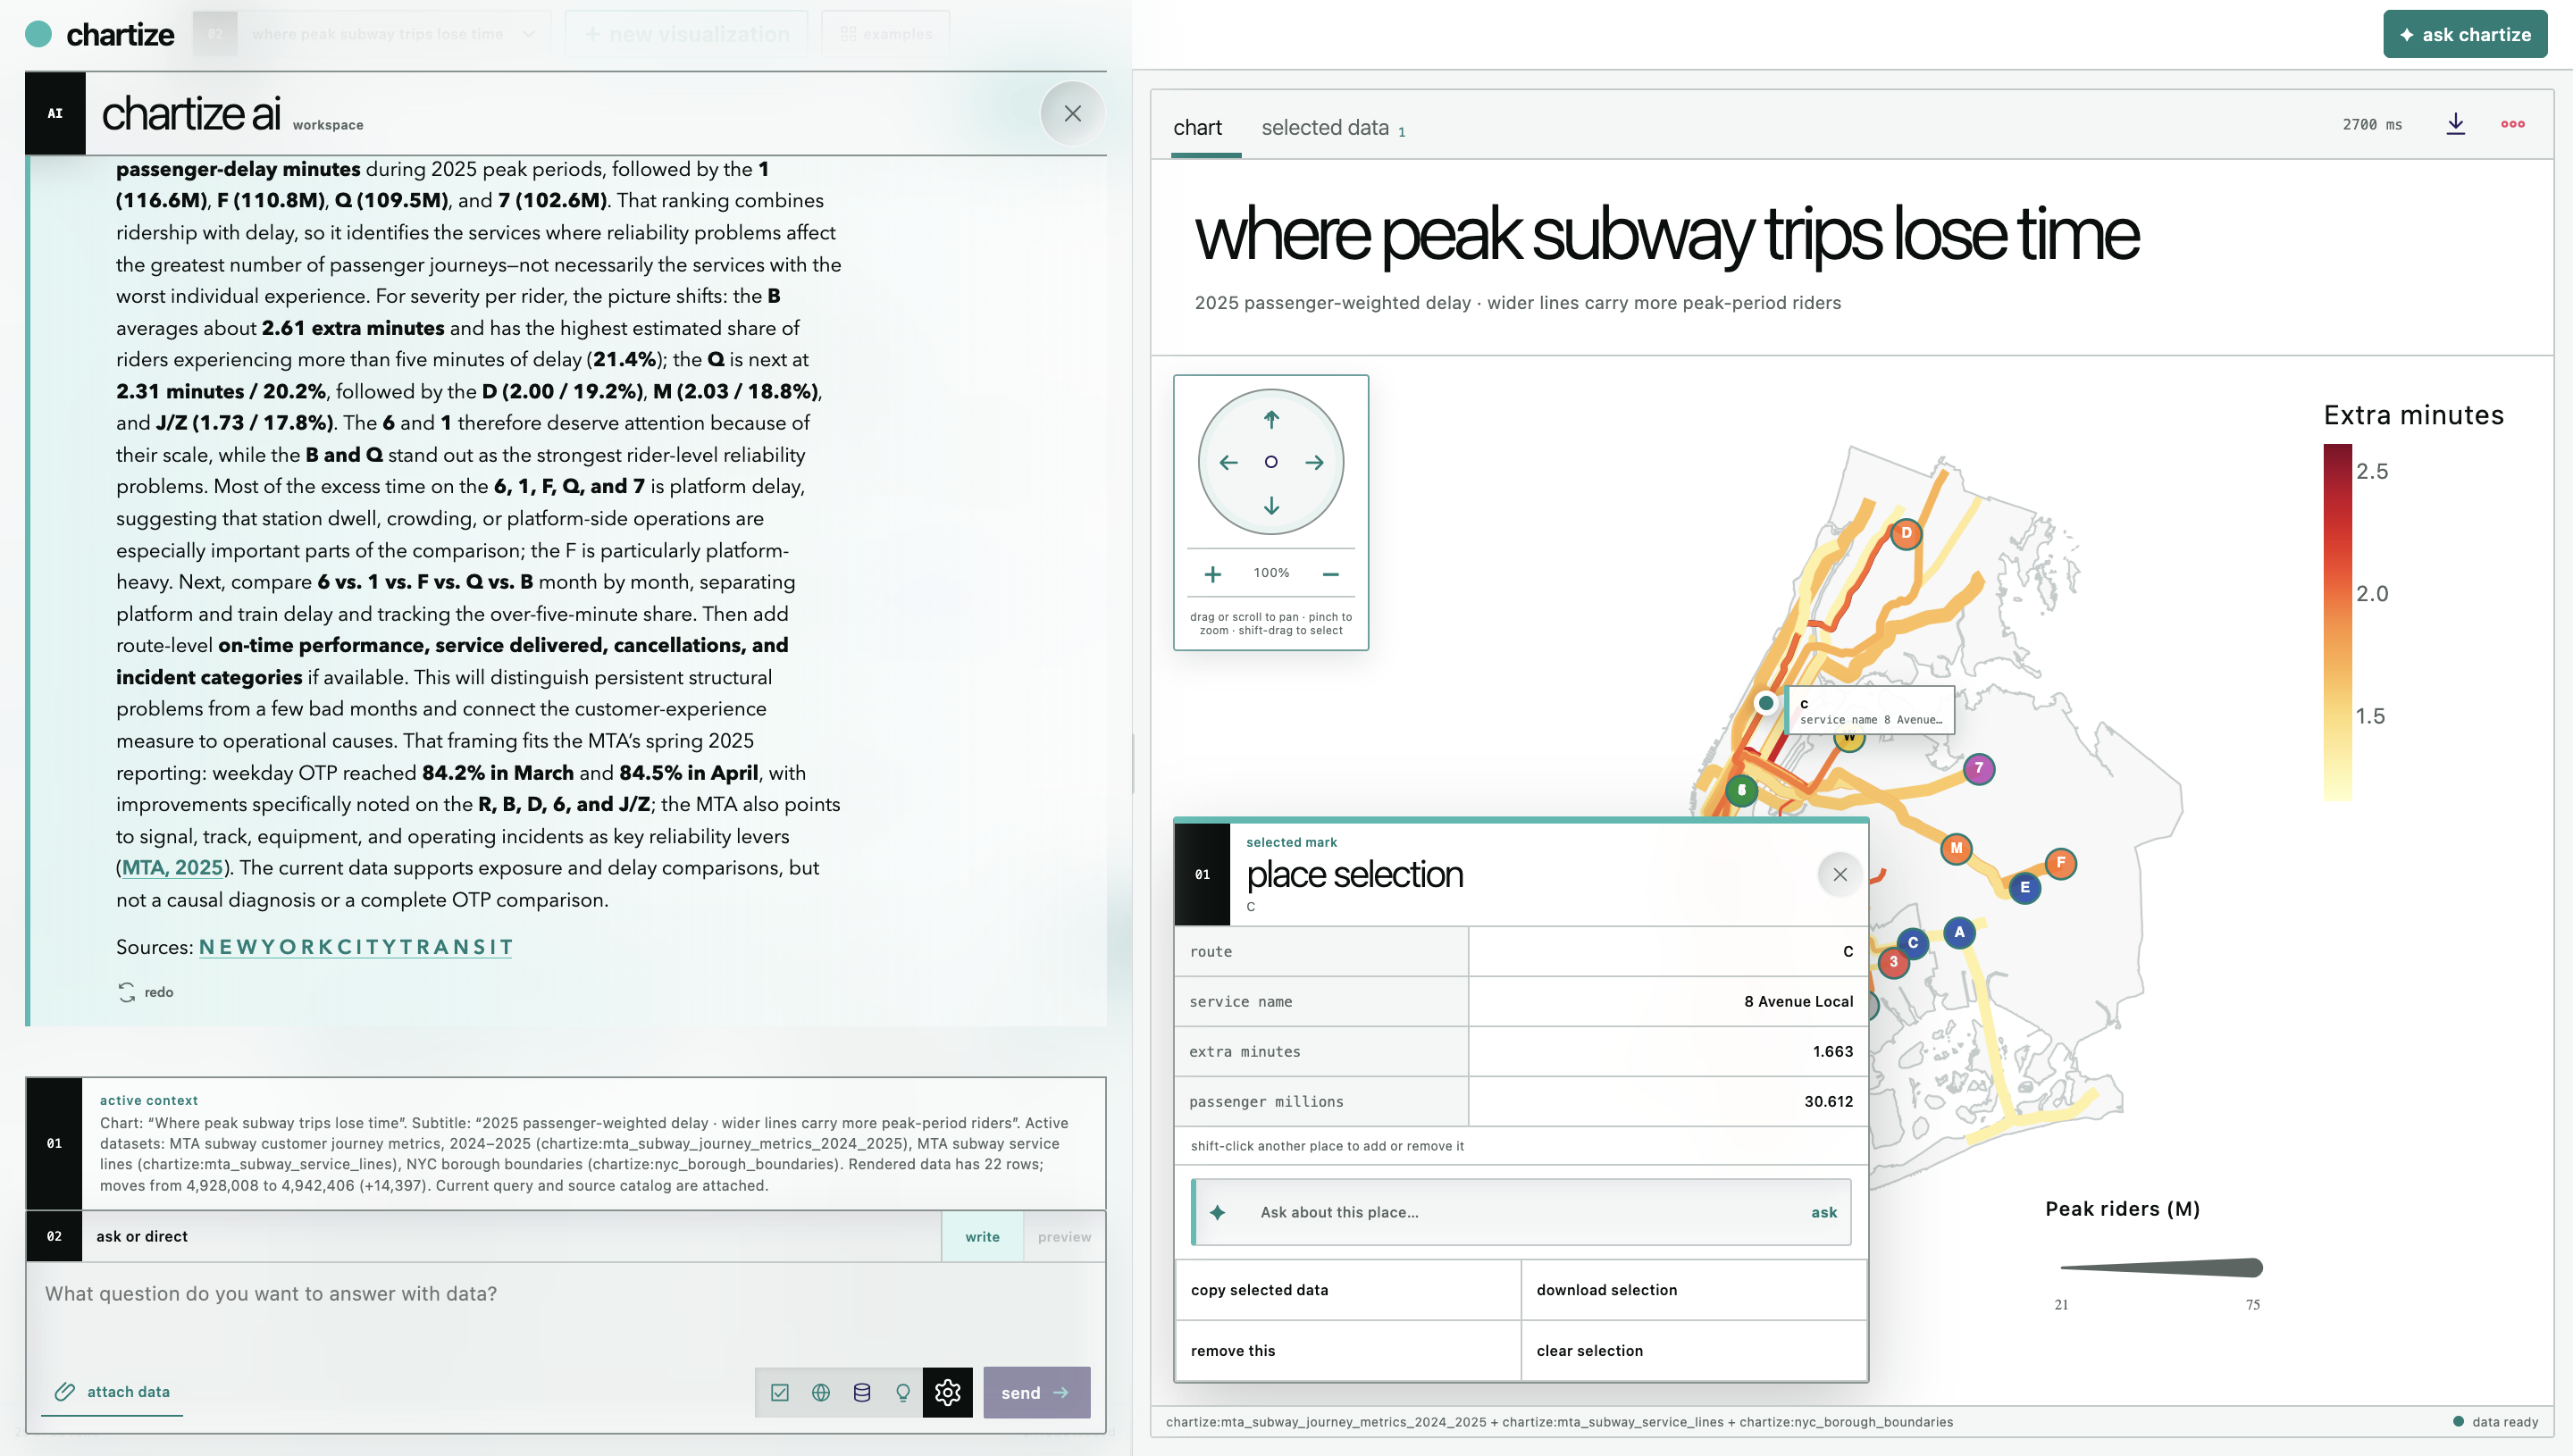
Chartize AI
-
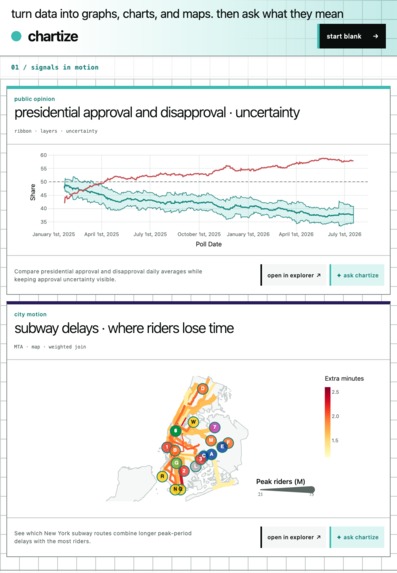
Chartize splash mobile
-
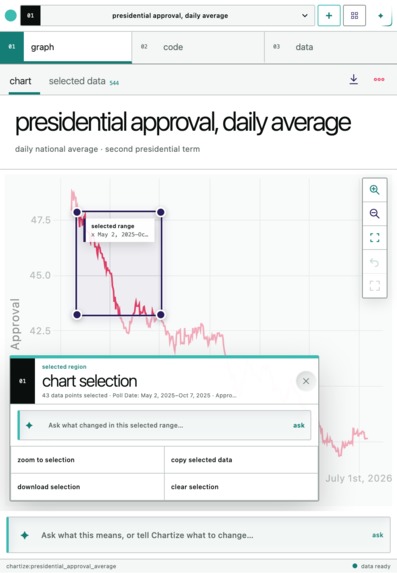
Chartize explorer mobile
Inspiration
This was inspired by Posit's release of GGSQL, which adds the Grammar of Graphics (their most famous project in the R community) as an extension to SQL, combining data query and visualization in the same language, as demonstrated in the GGSQL playground. This led to me to imagine a system where AI could help generate these visualizations (since AI is very good at generating SQL) as well as explain them.
What it does
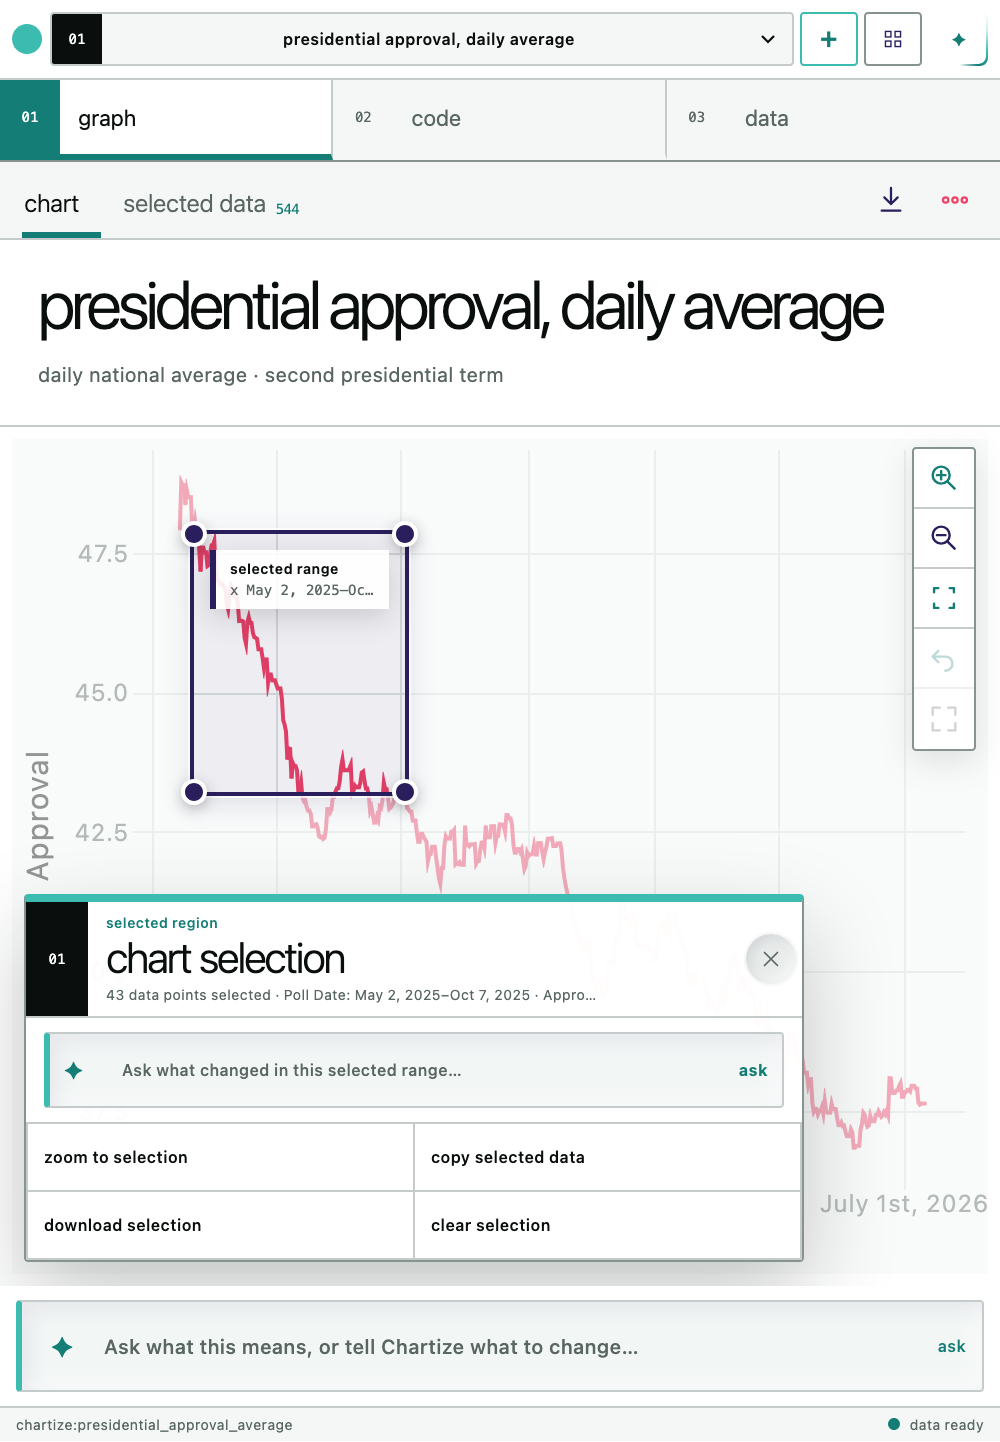
Chartize is a local-first visualization studio for exploring public or private data with GGSQL and GPT-5.6 (luna). Code, source rows, charts, marks, and AI discussion are one workspace, with context and interactive modals inspired by GNU Emacs' DWIM (do what i mean) interface, so every suggestion can be inspected against the data with appropriate context intelligently attached and executed or explained, with a "Chartize AI" agent at the heart helping you with data cleaning, graph and map enhancement, and contextual explanation.
How I built it, with Codex
This system was built start-to-finish in a single codex session using gpt-5.6-sol on max thinking, with access to the Chrome MCP for testing the live website, with all code on the project being AI-generated. This uses next.js and react both for the frontend as well as for managing api routes for generating AI responses and for sending in preloaded data. Monaco is the editor component of choice. GGSQL-wasm is used to process the GGSQL, Spatialite and Vega-lite are used to handle GeoJSON, with the rendering of the graphs by Vega-lite on HTML canvas. The AI model used for the "Chartize AI" is gpt-5.6-luna on low, with access to web search, local mutations, and other tools as toggleable options, implemented using the Responses API.
Challenges I ran into
Since this is a visual product, the challenges to resolve were mostly visual (especially with respect to the various popups and interactables as well as phone-screen responsive design), but with one cache storage issue that caused me to change the architecture of the project to be local-first and remove a whole rust-based GGSQL server interface. I also had to clearly specify design descriptions to prevent Codex from creating a rounded rectangle shadcn/ui default AI-generated site design, this remained an ongoing issue at the start, until I clearly insisted on the design language I wanted
Accomplishments that I'm proud of
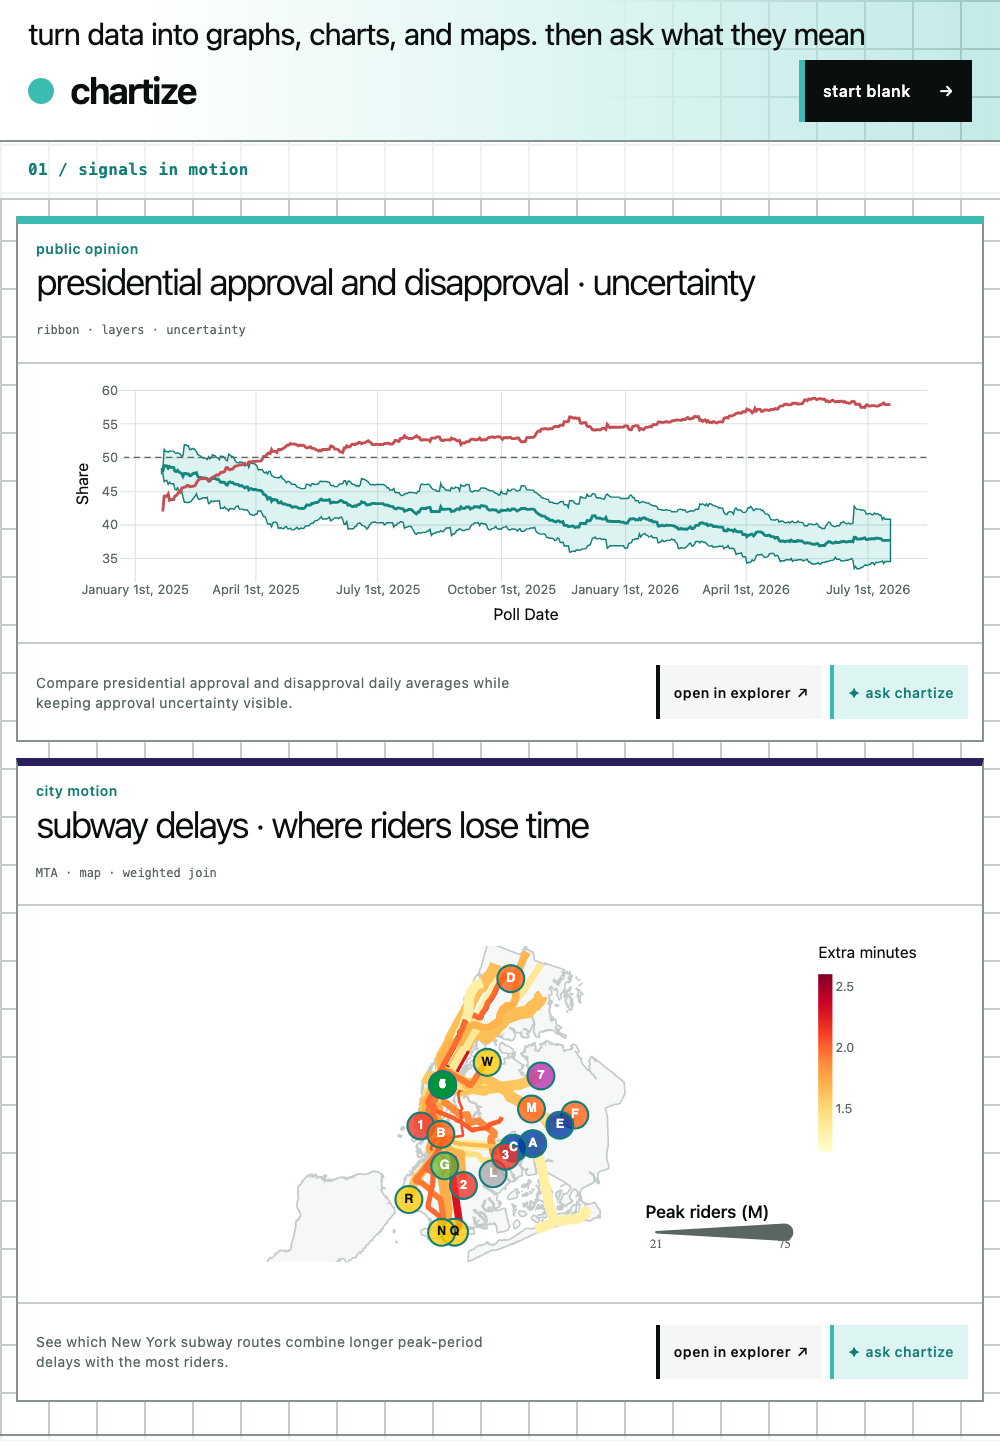
The visualizations for the MTA lines by delay and usage, the calendar-like heatmap of temperatures for the month of june, and the clipped US map showing land usage, all are AI-generated through iteration and show what the system is capable of. I am also proud of the local-first data storage system where AI only issues arbitrary (GG)SQL to a local web worker stored database, while the path between the client and server is read only, preserving the preloaded datasets
What I learned
GPT-5.6-sol is far more powerful than I realized, when given access to the right tools like a full web browser. GPT-5.6-luna is a capable ai assistant for generating the GGSQL and explaining the events of the world when asked to give context for particular data. With some guidance Codex can create entire working products. GGSQL is also really impressive and full featured, and my examples on the Chartize homepage haven't scratched the surface.
What's next for Chartize
- Shareability, the ability to share not just charts but the current workspace itself, so that the link preview can show the current chart and other users can extend upon your visualization and analysis.
- Live API access to various datasets instead of some save parquet files, to incorporate things like live weather and traffic.
- 3D, if GGSQL adds support for that.
Built With
- codex
- ggsql
- monaco
- nextjs
- react
- typescript
- vega-lite


Log in or sign up for Devpost to join the conversation.