-
-
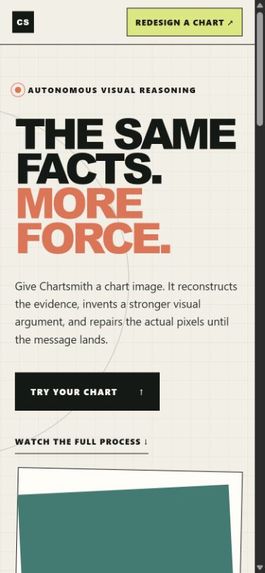
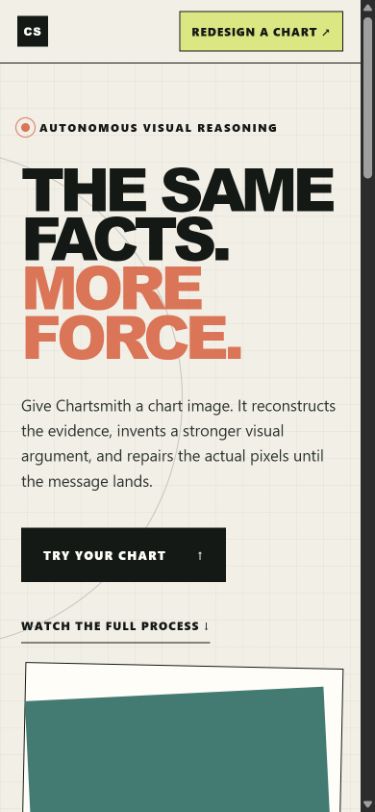
The public showcase is responsive and production-ready.
-
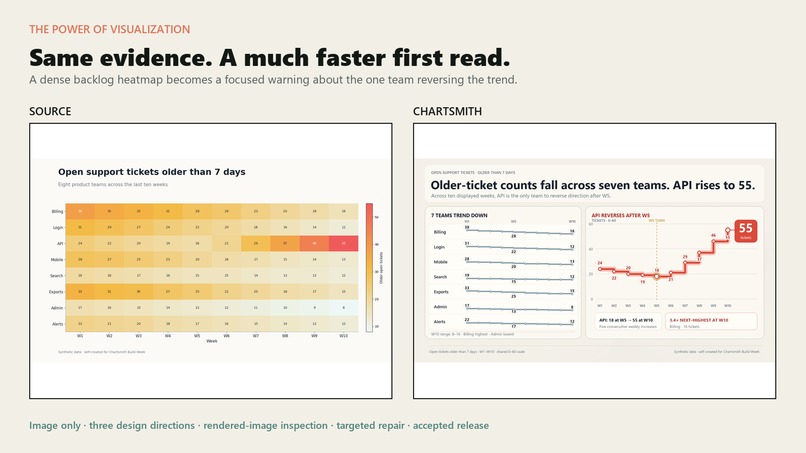
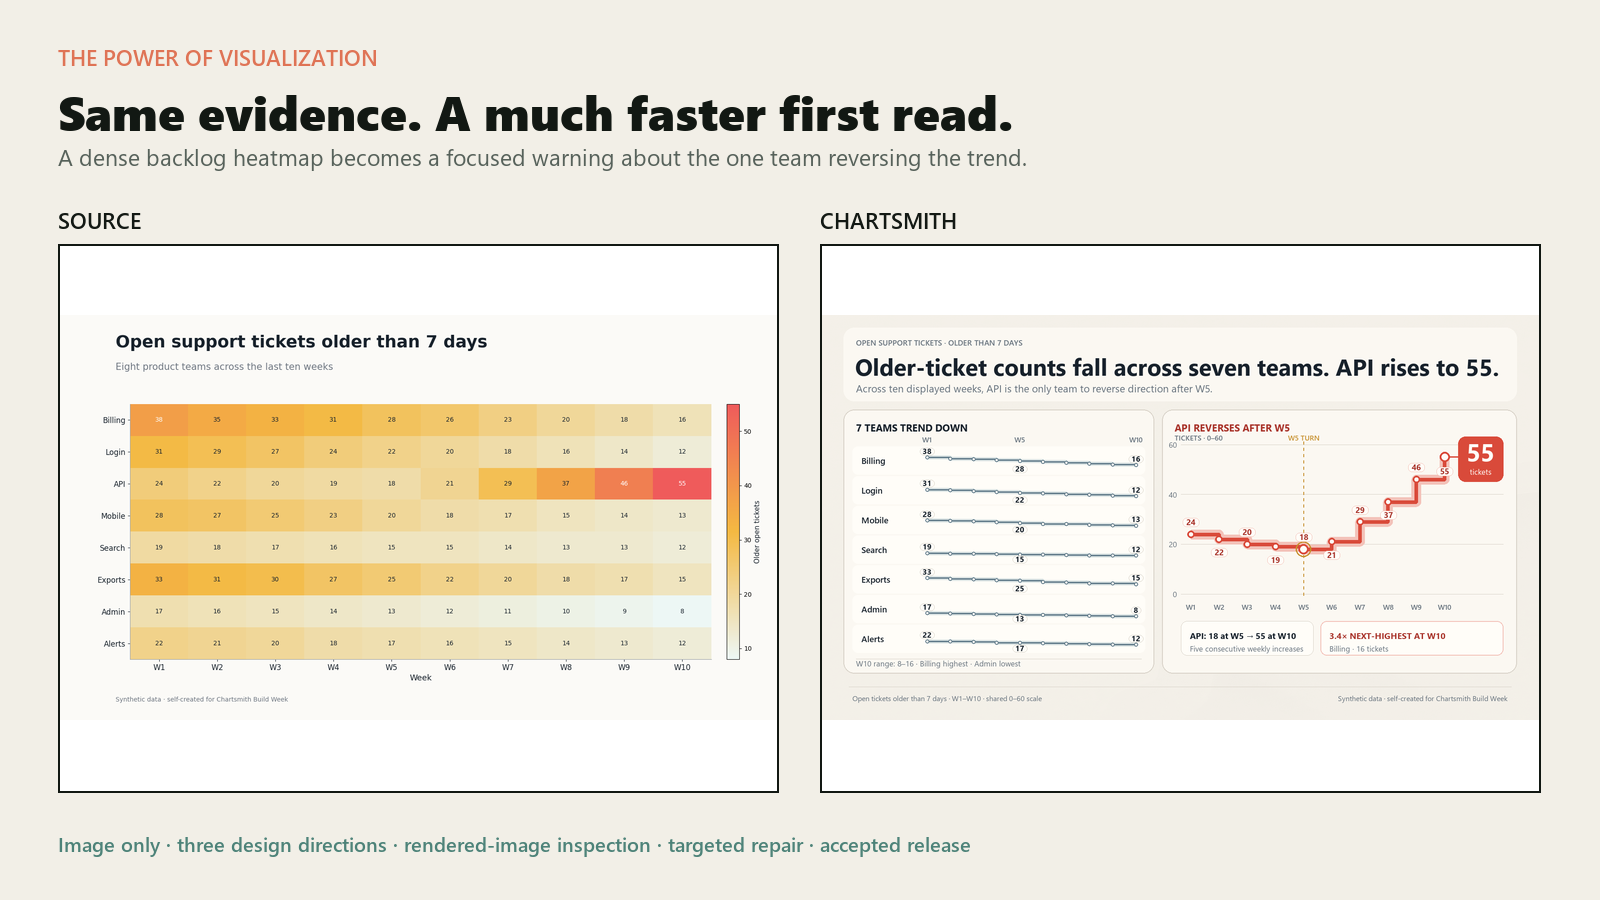
The same evidence becomes a much faster, more persuasive first read.
-
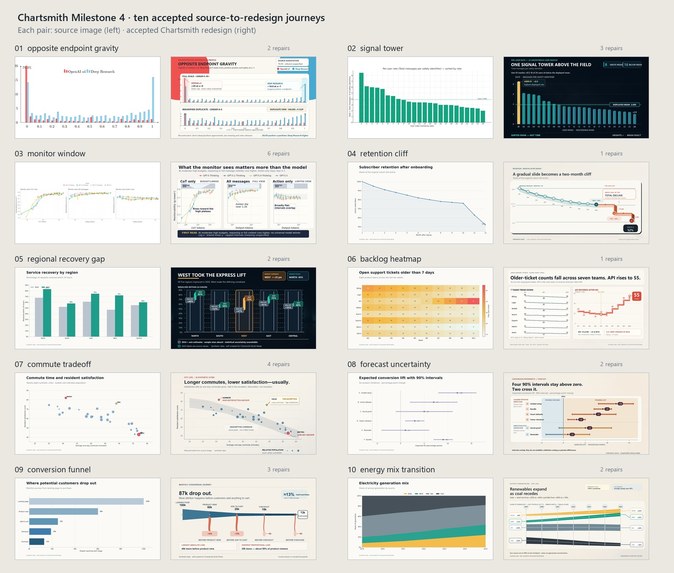
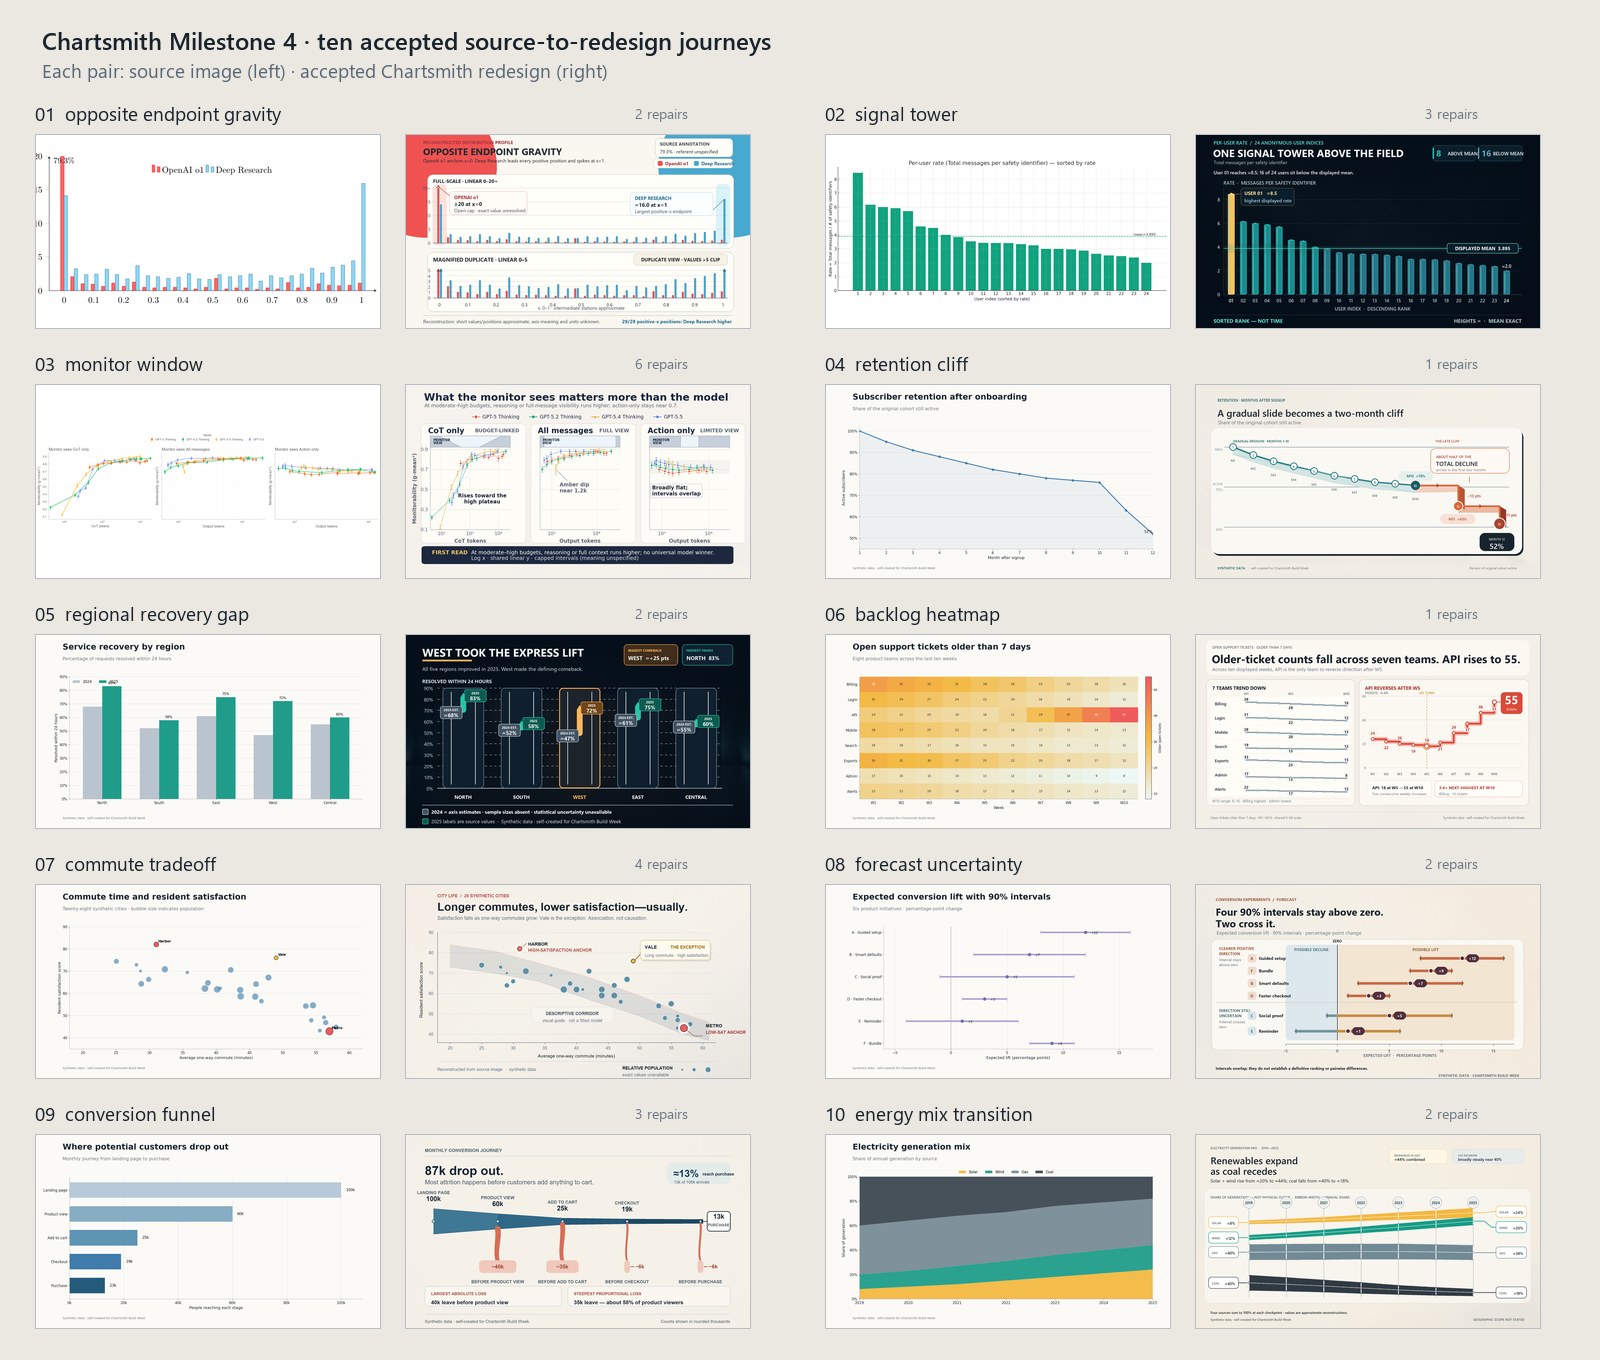
Ten accepted journeys across ten distinct chart grammars.
-
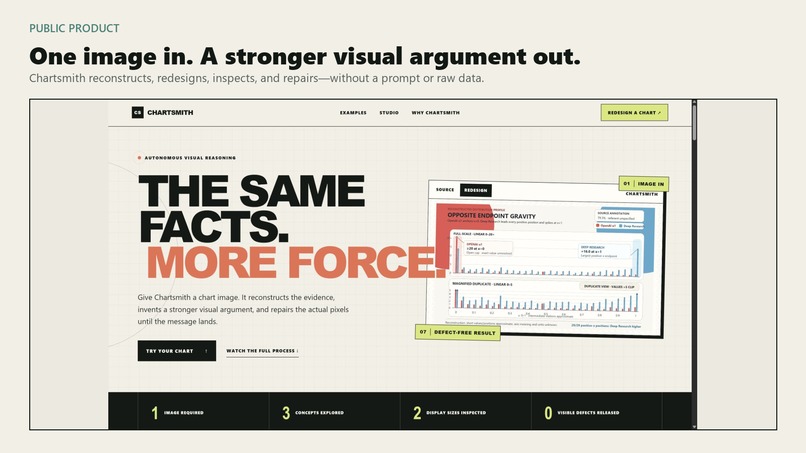
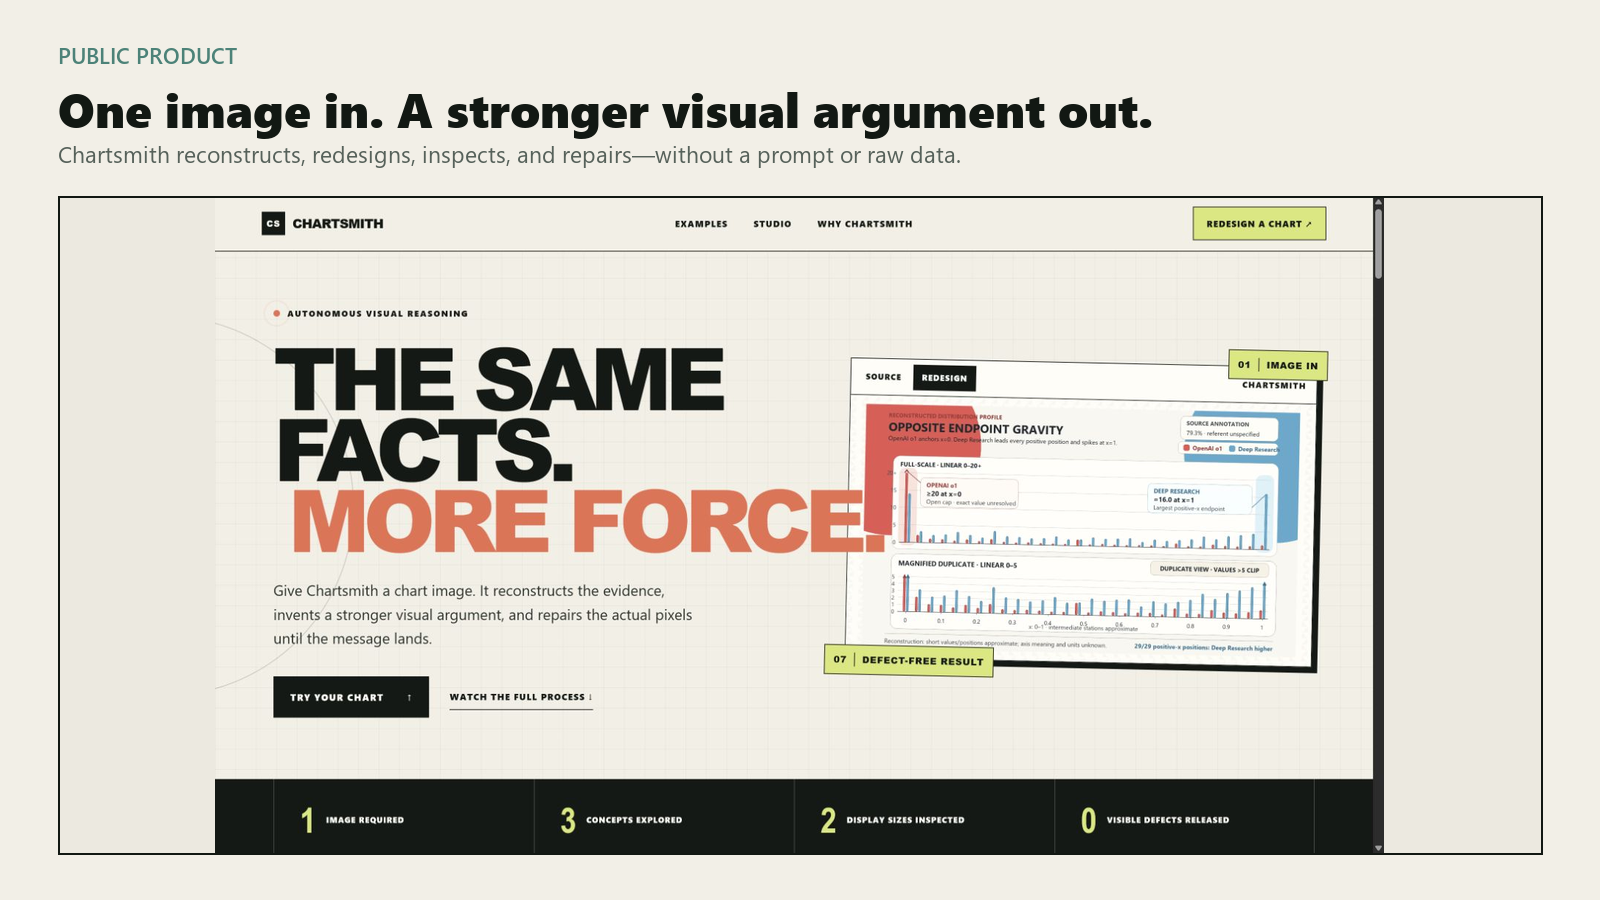
Chartsmith turns one chart image into a stronger visual argument.
-
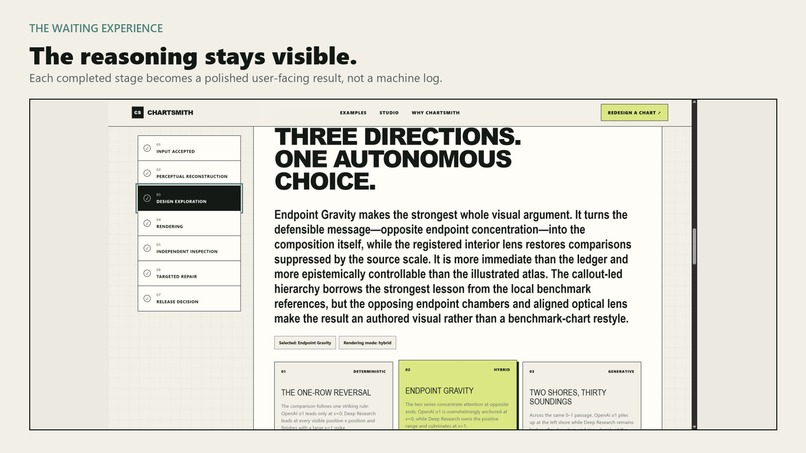
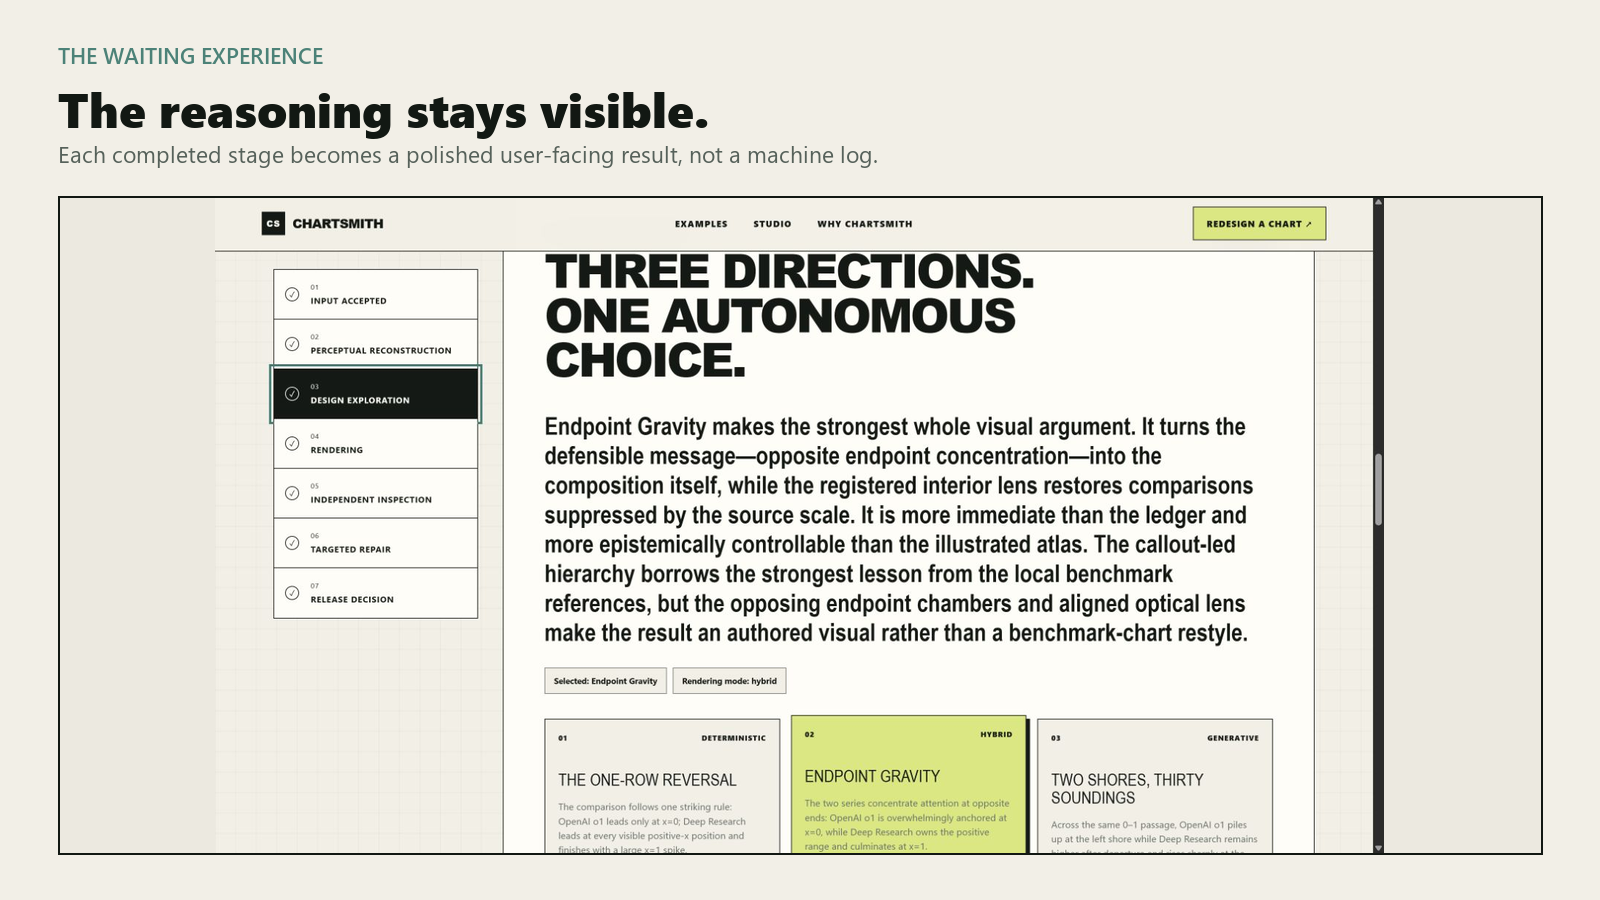
Intermediate reconstruction, exploration, inspection, and repair stay visible.
Inspiration
My boss is really busy, and he usually reads only one chart from my emails. So I needed to create a single chart that could catch his eye and deliver my whole message.
I don't think this is purely artistic work. It is work that requires reasoning, where each design decision can be made based on reason and an understanding of the context. This is something AI can do better than I can. With the surprising image-understanding capabilities of recent models like GPT-5.5 and GPT-5.6, this became much more achievable.
Ambitiously, I wanted to build a system without providing raw data, context, or guidance. I wanted to give it only a chart image and have it reverse-engineer the underlying data, understand the context, infer the message, and come up with an amazing result.
That's what Chartsmith does.
What Chartsmith does
Chartsmith turns a chart image into a more immediate, persuasive, and memorable visualization.
It is not just an automatic restyling tool. It may change the visual grammar, reorganize the composition around a stronger message, add purposeful annotations, or introduce visual devices that would be difficult to create with a conventional charting library.
The experience is one-shot:
- Upload one chart image.
- Chartsmith reconstructs what the source appears to communicate.
- It explores three materially different design directions.
- It selects and renders one direction.
- An independent visual review inspects the actual rendered image.
- Targeted repairs correct visual or epistemic problems.
- The final chart is released only after passing its quality gates.
The user does not need to interpret the chart for the system, choose a design direction, or manage the repair process.
How I built it
The outer workflow is a deterministic Python orchestrator. GPT-5.6 supplies bounded visual reasoning inside explicit stages rather than controlling the global schedule.
GPT-5.6 is used for:
- perceptual reconstruction from the source image;
- identifying the chart's likely message and uncertainty;
- proposing and comparing different visual concepts;
- translating the selected concept into a render direction;
- inspecting the rendered candidate for visual and semantic problems;
- recommending targeted repairs; and
- making the final comparative release judgment.
GPT Image 2 can be used when a concept benefits from generative visual flexibility. Deterministic Python rendering remains available when exact typography and geometry provide better control.
The web product is built with React, TypeScript, Next.js/vinext, and a Python service around the promoted workflow. It presents the process as seven polished, user-facing stages rather than exposing prompts, logs, or JSON. Ten accepted example journeys load immediately, while the local product also supports genuine image uploads and reconnect-safe long-running jobs.
Every accepted run retains its reconstruction, concepts, model provenance, candidate history, review findings, repairs, final evaluation, and source-to-result comparison.
What I built during Build Week
Chartsmith existed before Build Week as a larger experimental chart-redesign workflow. That earlier version delegated too many decisions across too many steps and had accumulated multiple workflow versions, evaluation experiments, and stale documentation.
During Build Week, I used Codex to turn it into a coherent product:
- cleaned and restructured the repository around explicit current and historical boundaries;
- preserved the older v2.6 system as a recoverable rollback baseline;
- designed and implemented a shorter persuasion-first GPT-5.6 workflow;
- made image-only, one-shot operation the defining input contract;
- added mandatory rendered-image inspection and bounded targeted repair;
- created a judge-facing web product with meaningful intermediate results;
- added a fair comparison against a direct single-model-call baseline;
- built a portfolio of ten distinct accepted redesign journeys;
- created seven original synthetic CC0 chart sources;
- retained provenance and release evidence for every example; and
- hardened the runner using problems discovered during real portfolio runs.
The ten examples span distributions, ranked bars, scatter panels, a line chart, grouped bars, a heatmap, bubble scatter, an interval plot, a conversion funnel, and a stacked-area chart. Together they required 26 targeted repair cycles before release.
Challenges
Being ambitious without becoming misleading
Chartsmith is intentionally allowed to overstep the source's design. A boring near-copy would fail the purpose of the project. However, creative authority cannot justify reversing a visible trend, inventing a category, or making an unsupported claim.
I addressed this by separating approximate perceptual reconstruction from a minimum epistemic floor. Small imperceptible numerical drift is acceptable, but obvious semantic errors are not.
Eliminating visible defects
People notice overlap, overflow, awkward line breaks, malformed geometry, and strange annotation placement immediately. Even a strong design concept feels untrustworthy when these defects remain.
For that reason, production integrity is a hard release gate. Chartsmith reviews the actual rendered image—not merely its code or design plan—and repairs defects before returning the result.
Making the system's complexity genuinely useful
A judge could reasonably ask why this needs a system at all instead of one prompt to a general model.
The answer cannot simply be that Chartsmith has more steps. The value has to appear in the result. The workflow repeatedly found issues that a single generation pass missed: misleading bubble-size encoding, a headline that confused point estimates with uncertainty intervals, annotation collisions, broken connector geometry, and claims that were not fully supported by the image.
The product exposes these intermediate decisions so users can see what the system understood, what it considered, what review discovered, and how the final result improved.
Hosting a long-running agentic workflow
A full-quality run can take many minutes and depends on a Python/Codex execution environment. The submission therefore separates a public showcase containing ten complete, truthful journeys from the genuine local upload engine. It does not pretend that a precomputed example is live generation.
What I learned
It was really difficult to define what makes a chart good or bad, or beautiful or unattractive. I also soon realized that my feedback was not always consistent and could be biased. I know that I am not a design expert, so my input or feedback might introduce bias into the system.
I believed that GPT could reasonably judge whether a chart was good or bad—not from a universal perspective, but in terms of our specific goal: creating a better presentation that is more eye-catching and delivers its main points more efficiently.
So I wanted AI to find its own way instead of giving it detailed instructions about what was good or bad. I focused more on what kind of input I should give AI to help it build the system. That input was not design feedback, but greater clarity about my intentions and motivations: when a chart felt bad to me, why it felt bad, and why I needed a better one.
Once AI had a good understanding of my intentions, it built the system in the way I had hoped.
What's next
The current project explores the frontier of image-only chart redesign rather than high-stakes audited reporting. Future work could add optional raw data, hosted durable workers, more rendering backends, and broader evaluation without weakening the defining one-image, one-shot experience.
Chartsmith's central idea will remain the same:
A user should be able to provide one chart image and receive one meaningfully stronger visual story.


Log in or sign up for Devpost to join the conversation.