-
-

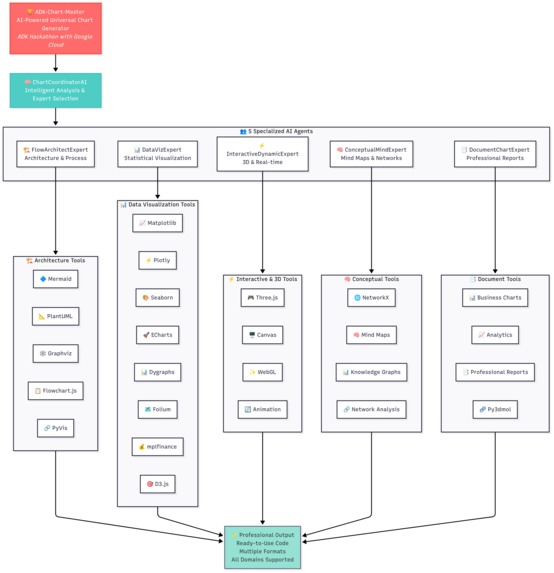
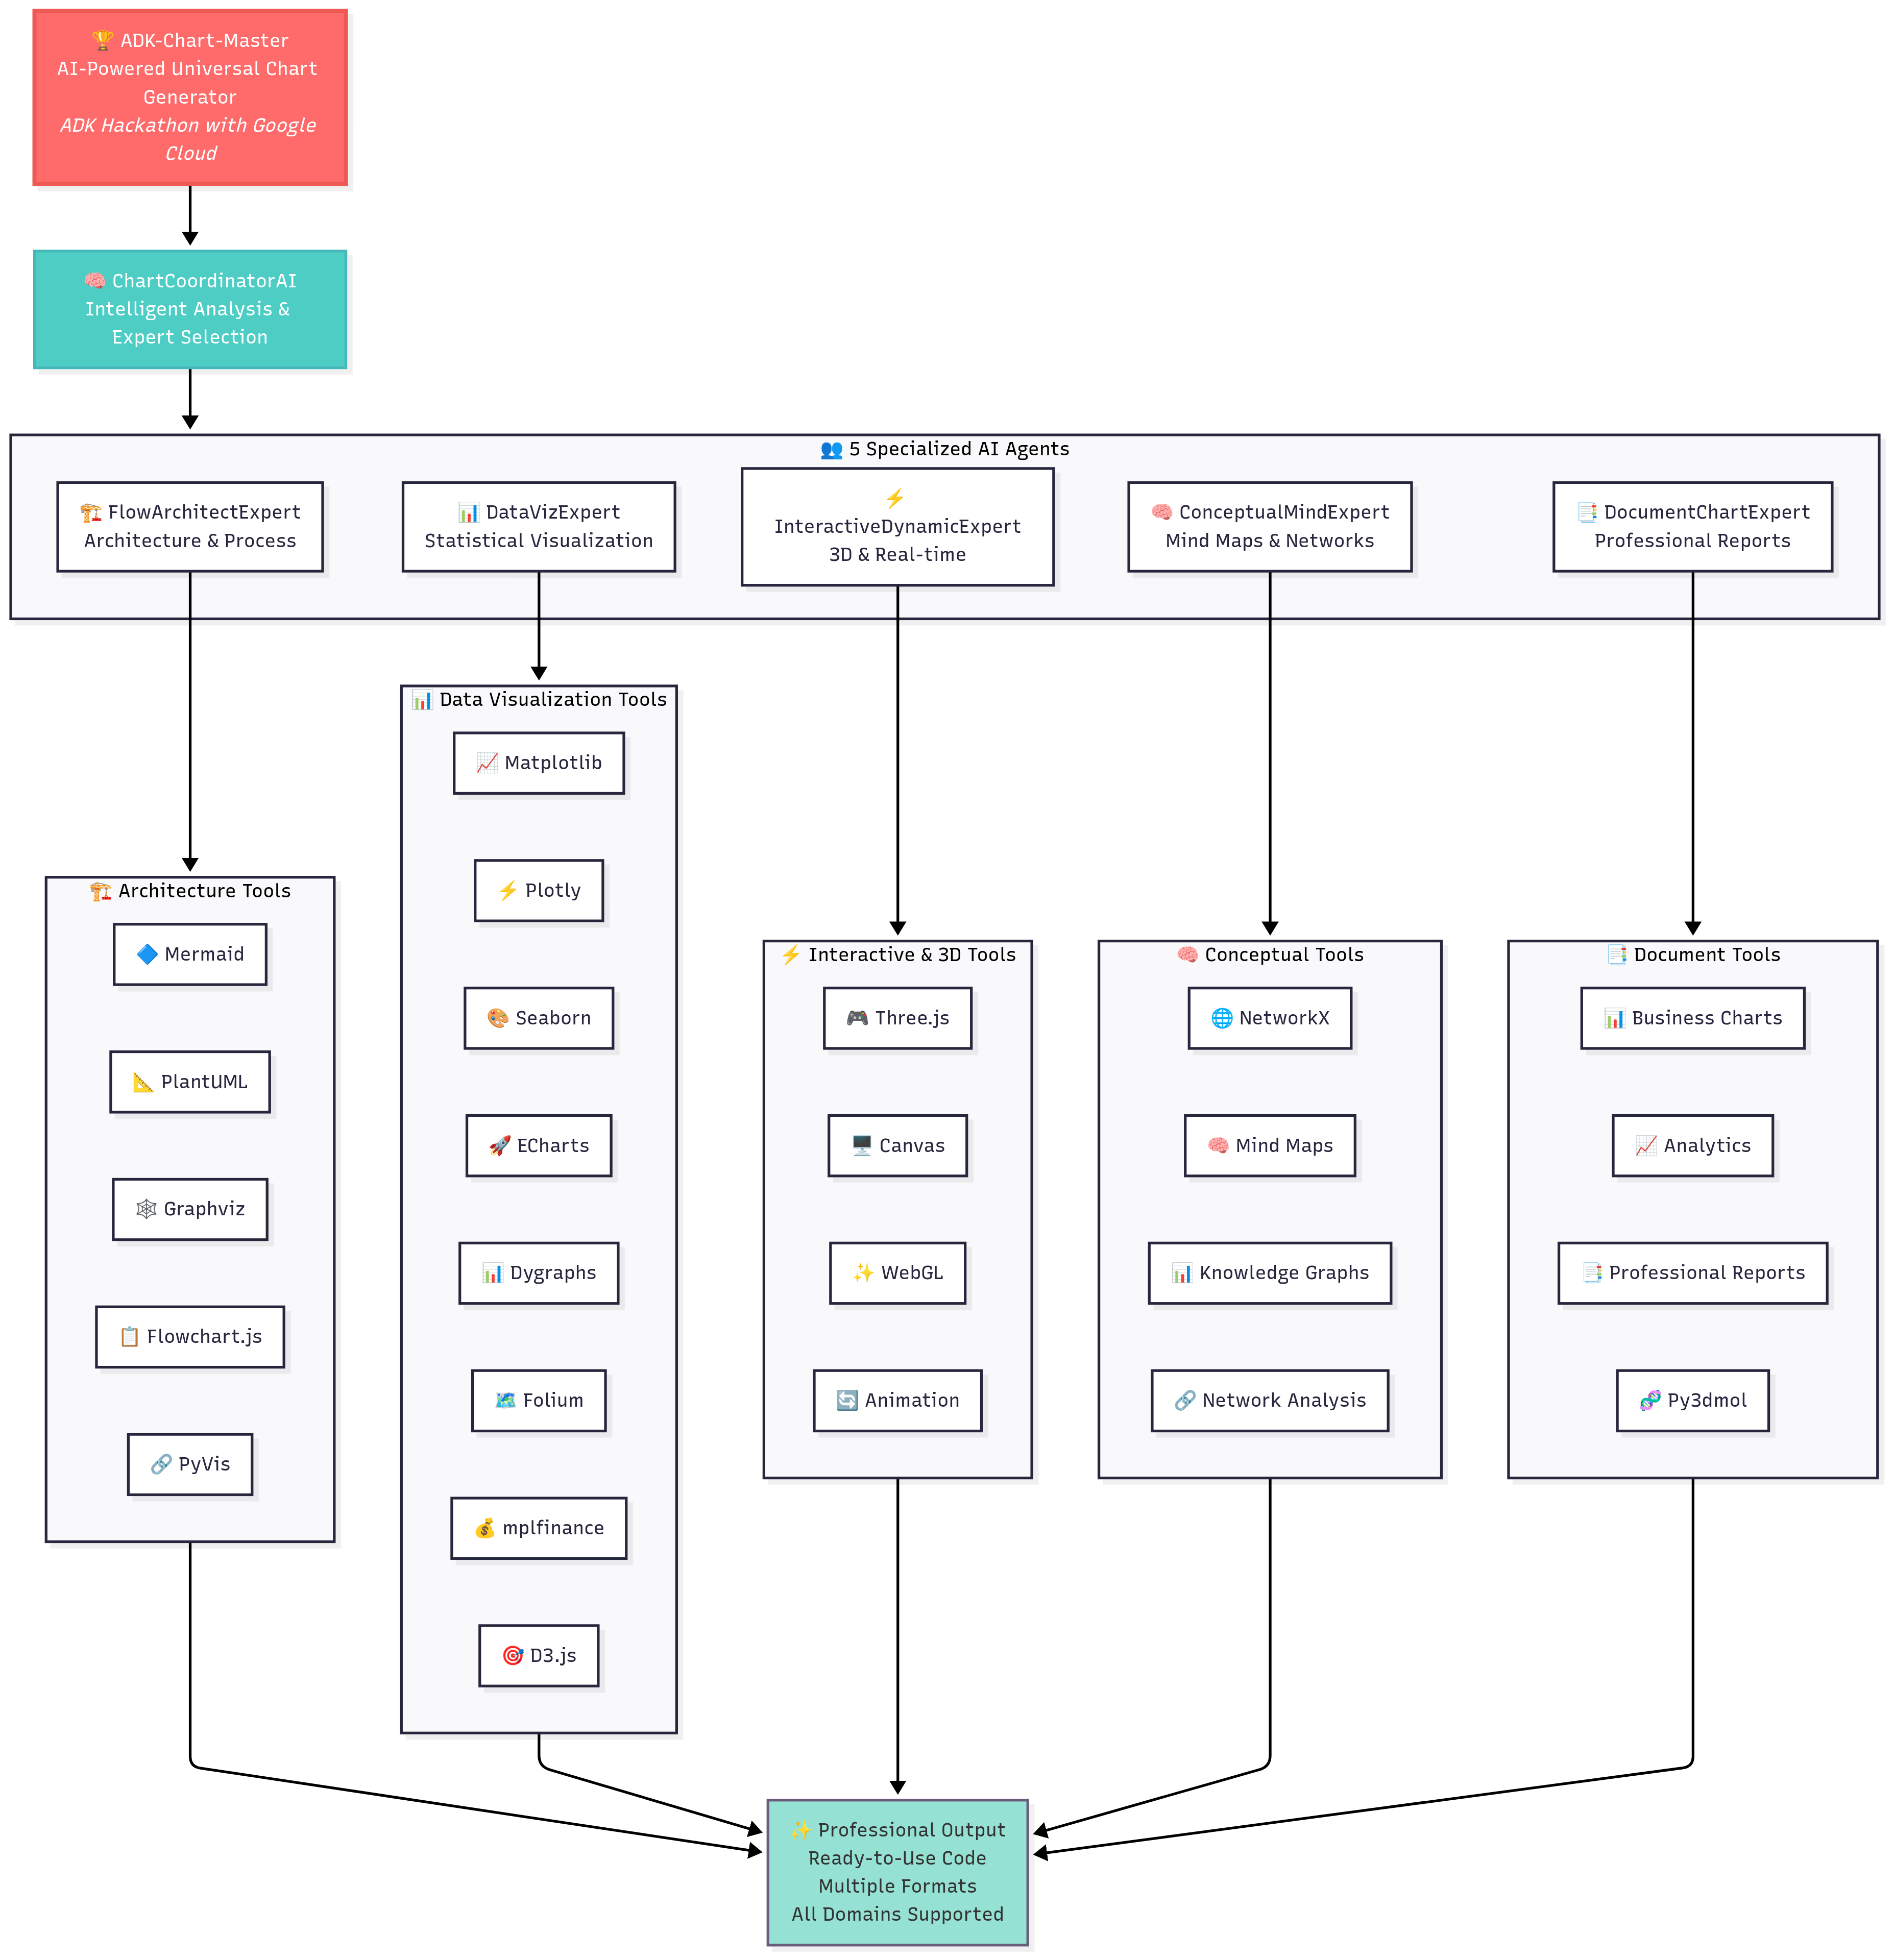
ADK-Chart-Master System Architecture - 5 AI Expert Agents with 15+ Rendering Tools
-
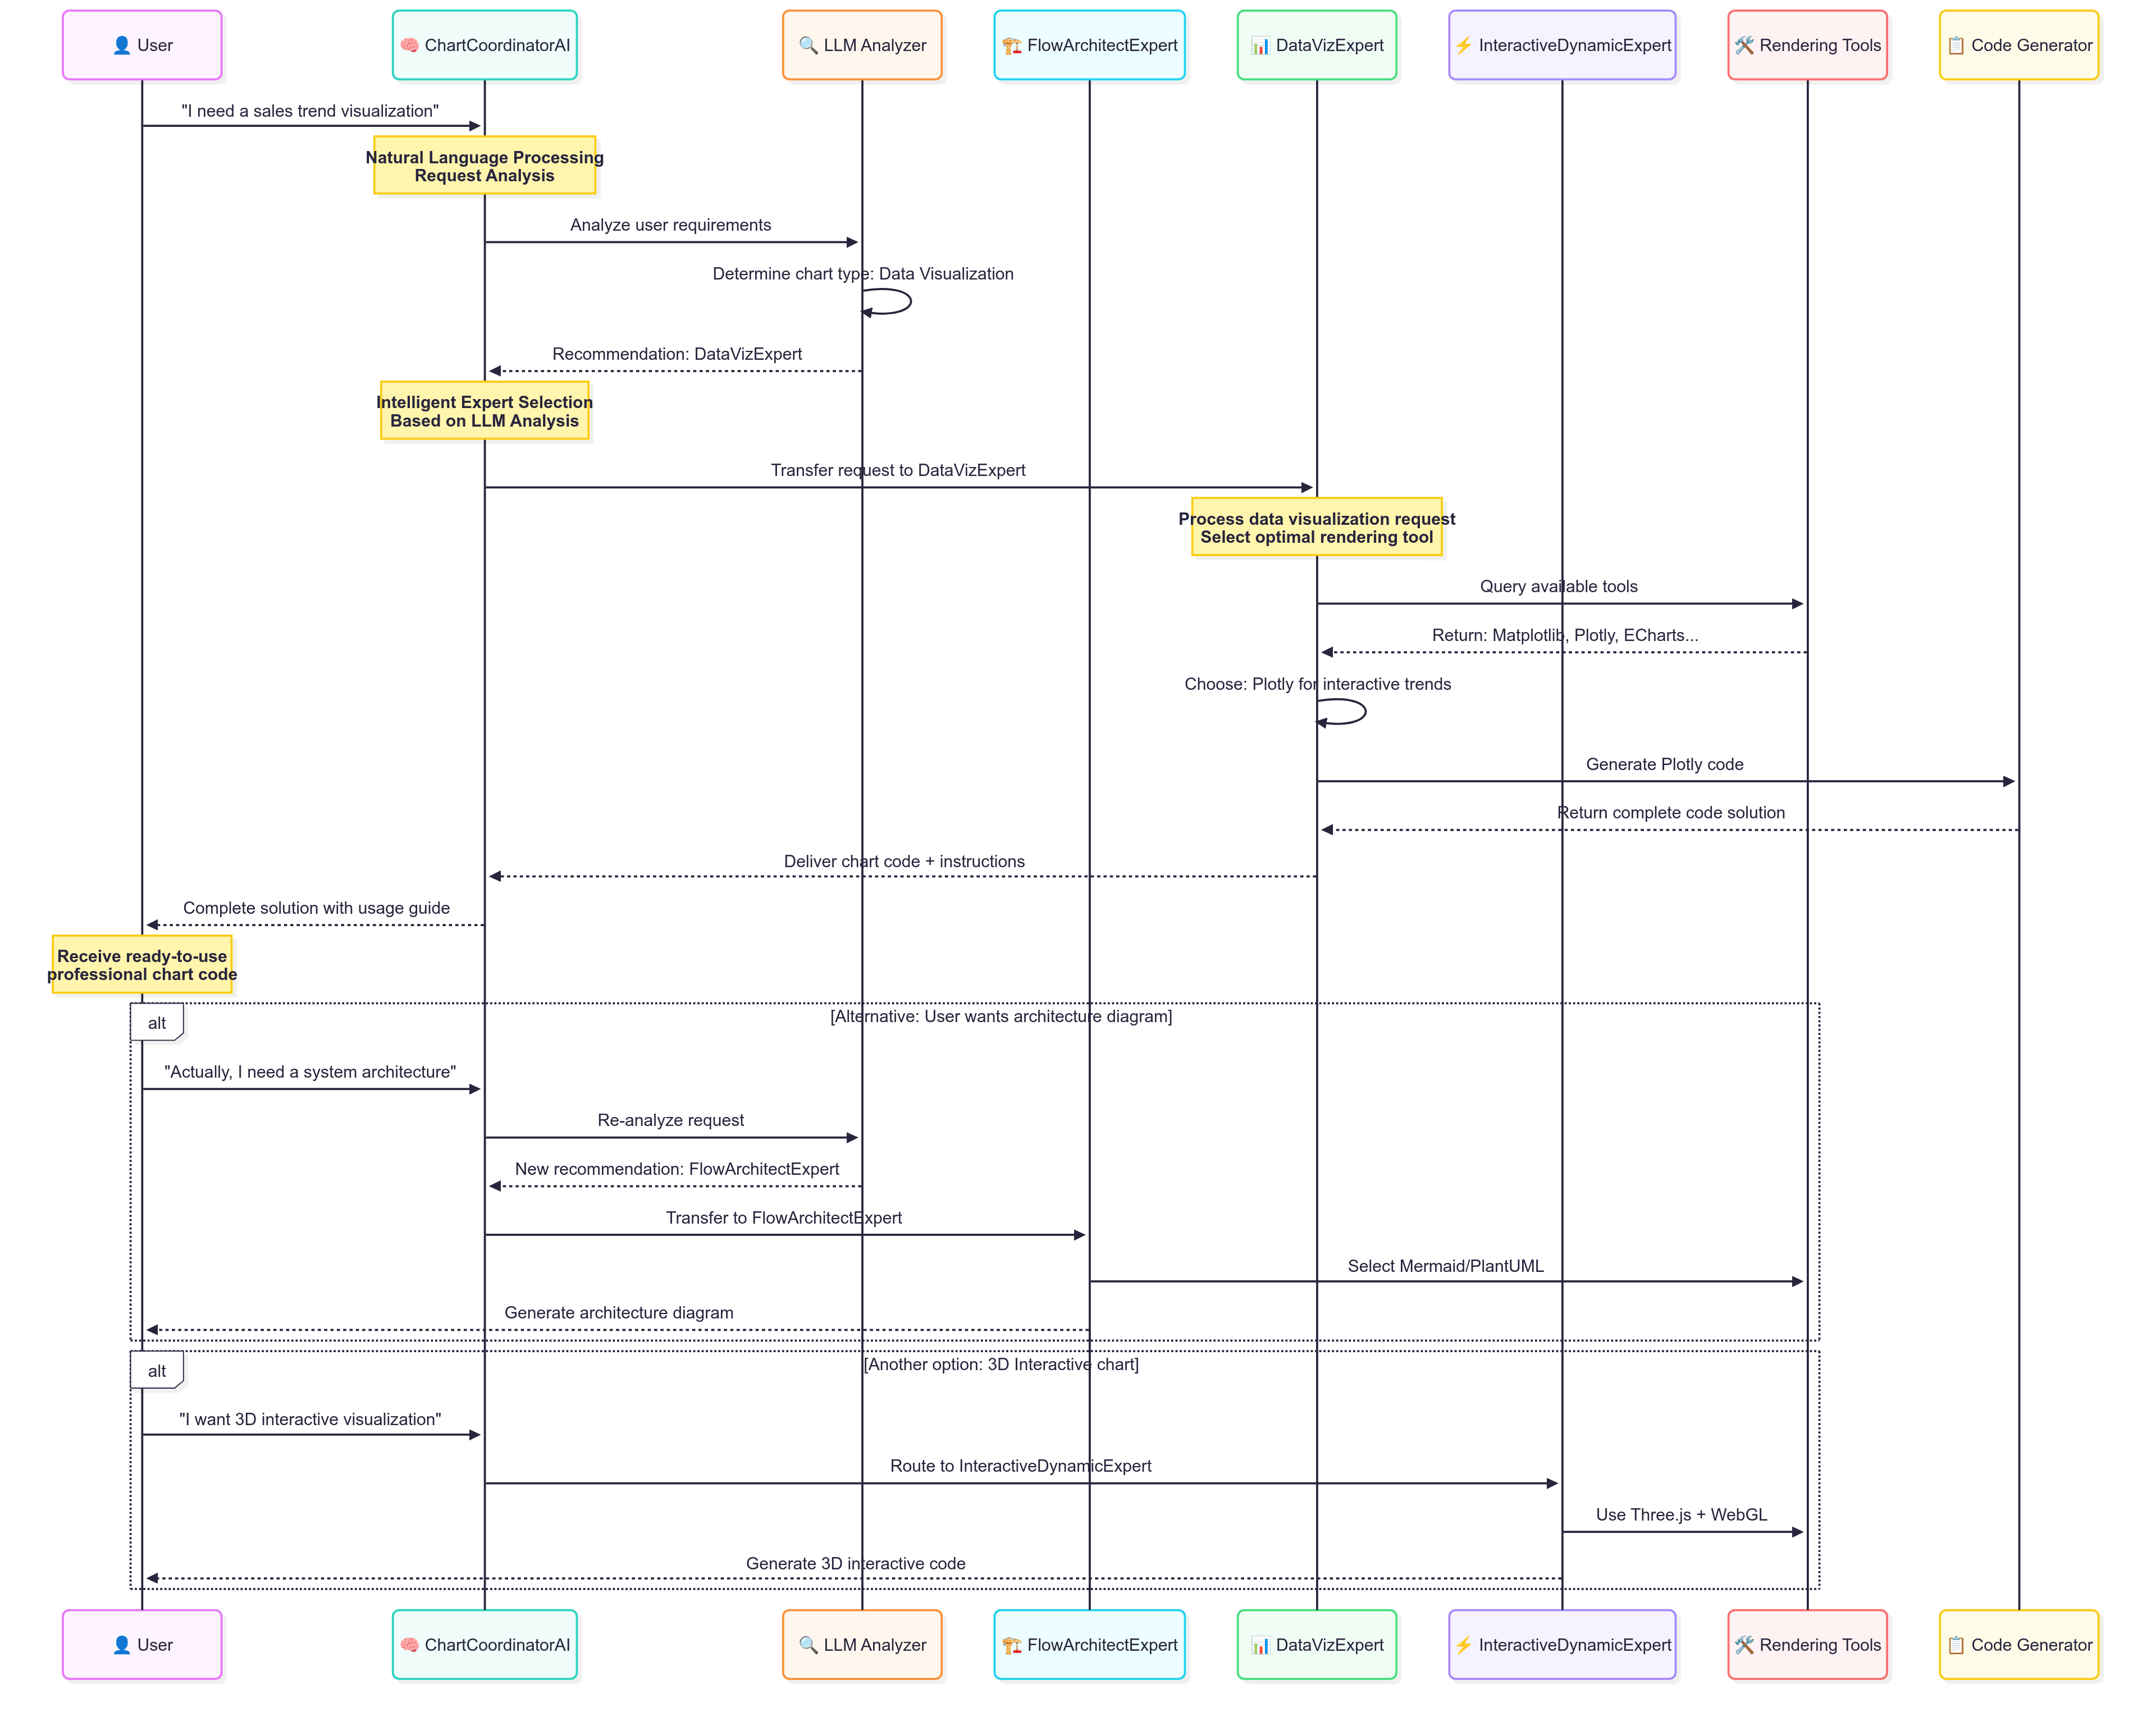
System Workflow - AI-Driven Chart Generation Process from Natural Language to Code
Inspiration
I am a psychology student, and my major is an interdisciplinary field that requires knowledge in both humanities and sciences. A key requirement is that students must learn to use SPSS and R language to perform data analysis and create various charts. I found the process of learning SPSS and R was extremely boring. I was very frustrated with it, spending a huge amount of time just clicking around or wrestling with code to draw one decent-looking chart. Furthermore, I felt the rate of return on learning this skill was extremely low.
So, I started to wonder if I could leverage the power of today's large models to translate my natural language into beautiful charts and get the output directly. This seemed especially useful in scientific research—could I create charts ready for academic papers, like ANOVA visualizations, just from a prompt? This led me to start this project to solve this 'annoying task'. My idea was that even if a student's statistical knowledge is vague and they are unskilled with tools like SPSS and R, they should still be able to produce all kinds of beautiful charts. The core principle of my system is to let students focus their energy on thinking about and questioning problems, rather than spending it on navigating endless clicking operations.
The final effect I want to achieve is for a user to input data, provide a relatively vague prompt, and receive a satisfactory chart in return, saving university students the time spent learning all this code. In the process of building the project, I gradually integrated more and more charting capabilities, which finally resulted in this system responsible for generating charts for users.
What it does
Chart Coordinator AI transforms how users interact with data by replacing complex software and tedious clicking with simple, natural language conversation. Here's what it does:
- A "Team of Experts" at Your Service: At its heart, the system features a team of five specialist sub-agents, each with a distinct role. The central
ChartCoordinatorAIacts as a project manager, routing tasks to the right expert:-
DataVizExpert: For all standard data visualizations, from bar charts to scatter plots. -
FlowArchitectExpert: Master of flowcharts, sequence diagrams, and process maps. -
InteractiveDynamicExpert: Handles requests for interactive, dynamic, or 3D charts. -
ConceptualMindExpert: Specializes in explaining concepts visually, like decision trees. -
DocumentChartExpert: Creates charts optimized for inclusion in documents and reports.
-
- A Comprehensive Arsenal of 15 Rendering Tools: To execute these tasks, our agents are equipped with a powerful and mature toolkit of 15 fully integrated rendering engines, giving them immense flexibility:
- Python Scientific Stack (7 Tools):
Matplotlib,Plotly,Seaborn,Folium(for maps),Mplfinance(for financial charts),PyVis(for network graphs), andPy3dmol(for 3D molecular structures). - JavaScript Interactive Stack (5 Tools):
ECharts,Dygraphs,Three.js(for 3D scenes),D3.js, andFlowchart.js. - Universal Diagramming Standards (3 Tools):
Mermaid,PlantUML, andGraphviz.
- Python Scientific Stack (7 Tools):
- Seamless, End-to-End Workflow: The system manages the entire process. A user provides a prompt, the right agent picks the right tool, generates the code, and renders the final chart as a standard
ADK.Artifact(Image or HTML file), which is then automatically displayed in the web UI.
How we built it
Building Chart Coordinator AI was a journey in architecting an intelligent system. We didn't just want a simple script; we wanted a robust, scalable, and genuinely smart framework. The Google Agent Development Kit (ADK) was not just a tool for us—it was the bedrock of our entire philosophy. Here's how we brought it to life, step-by-step:
1. The Blueprint: Embracing a Multi-Agent "Team of Specialists"
Our first and most crucial decision was to avoid a single, monolithic agent. The world of data visualization is too vast for one agent to master. Inspired by human organizations, we used the ADK's sub_agent pattern to create a "team of specialists."
- Our
ChartCoordinatorAIacts as theroot_agent. It's not a doer; it's a thinker and a delegator. Its only job is to analyze the user's prompt and intelligently route the request to the most qualified expert on its team. - The five
sub_agents(likeDataVizExpertandFlowArchitectExpert) are the true workhorses. Each is given a very specific mission and a fine-tuned prompt, making them experts in their narrow domain. This design choice prevents the "jack of all trades, master of none" problem and makes the system highly effective.
2. The "Aha!" Moment: Solving the Multi-Technology Puzzle
A major challenge was making vastly different technologies—like a Python-based Matplotlib and a browser-based ECharts—work together seamlessly. Our breakthrough came when we designed a universal BaseRenderTool abstract class.
- Every one of our 15 tools, regardless of its language or type, must inherit from this base class. This forced us to create a standardized interface.
- This simple architectural rule was a game-changer. It made our system incredibly extensible. Adding a new visualization library, whether Python or JavaScript, is no longer a major engineering task. We simply create a new tool class that conforms to the standard, and it plugs right into the system.
3. The Brain: State, Context, and LLM-Powered Code Generation
With the structure in place, we needed to give it intelligence.
- We leveraged the ADK's
InvocationContextas the system's "short-term memory." This powerful feature allows theroot_agentto pass down the user's original request, along with any intermediate thoughts or plans, to thesub_agentand finally to the tool. This ensures that context is never lost and every component has the full picture. - The LLM (Large Language Model) acts as the reasoning engine within each agent. Through carefully engineered prompts, the agent "convinces" the LLM to generate the precise Python or JavaScript code needed to fulfill the user's request.
4. The Final Mile: From Raw Output to a Polished Artifact
A piece of code is useless until its result is displayed. This is where we leveraged the ADK's output mechanism.
- Once the generated code is executed, its raw output (e.g., a Matplotlib figure object, a string of HTML from ECharts) is immediately packaged into a standard
adk.Artifact. - This is the final, crucial step. The ADK's web server natively understands how to handle these artifacts, automatically rendering the image or HTML file in the UI without us having to write any custom frontend display logic. This created the seamless, "prompt-to-picture" experience we aimed for.
Challenges we ran into
Building this ambitious project wasn't a straight line; it was a series of complex technical puzzles. We believe that sharing these challenges transparently showcases the true depth of our engineering efforts. Here are four of the most significant hurdles we overcame:
Navigating a Real-World API Catastrophe: We initially built our system on the Google Gemini API. Midway through development, we were hit by the widely reported global Google service outage. This wasn't just a minor bug; our core dependency vanished, grinding our progress to a halt. This event was a wake-up call, proving that relying on a single API provider is a critical vulnerability. Our Solution: We made a strategic decision to re-architect for resilience. We integrated the
LiteLLMlibrary, a powerful adapter that supports over 100 LLM APIs. This allowed us to immediately pivot to the Deepseek API, restoring our workflow within hours. More importantly, it made our system future-proof and provider-agnostic, a truly robust engineering achievement born from a crisis.Taming the LLM: From Verbose Conversationalist to Precise Coder: The LLM is a powerful reasoning engine, but its default behavior is to be a helpful, conversational assistant. In our case, we needed a silent, precise code factory. Early on, the model would often return code wrapped in conversational fluff like "Of course, here is the Python code for your chart..." This extra text would break our code execution pipeline. Our Solution: This required meticulous prompt engineering. We designed highly-structured, zero-shot prompts with strict instructions, essentially training the LLM to suppress all conversational output and return only the raw, executable code block. This was a game of precision, iterating dozens of times to find the perfect phrasing that disciplined the model.
Decoding the "Black Box": Mastering ADK's
_get_declaration: The Google ADK is powerful, but making our 15 custom tools visible and usable to the agent was our deepest technical challenge. The key was a single, critical method:_get_declaration. This method acts as a tool's "instruction manual" for the LLM. If this manual is even slightly unclear, the agent gets confused and fails to use the tool correctly. Our Solution: There was no shortcut. We had to perform a deep dive into the ADK's source code to truly understand howFunctionDeclarationobjects are constructed and interpreted by the agent. We learned to write crystal-clear descriptions and define exact parameter schemas. Mastering this was the "Aha!" moment that unlocked the full potential of the ADK, transforming our tools from inert code into active, discoverable capabilities for the agent.Bulletproofing the Frontend: The Local-First Asset Strategy: Many of our most impressive charts (ECharts, Three.js) are rendered using JavaScript libraries. Our initial approach of loading these from public CDNs was fragile, frequently failing due to network latency or temporary CDN outages. Our Solution: We implemented a robust "local-first, CDN-fallback" strategy. We downloaded all required libraries into our project's
static/jsdirectory. The application now attempts to load the local script first, ensuring near-instant and reliable loading. Only if that fails does it fall back to a public CDN. This seemingly simple change had a massive impact, making our application dramatically more stable and professional.
Accomplishments that we're proud of
Building a Truly Multi-Tool, Multi-Technology Agent: We are incredibly proud of successfully integrating 15 distinct and complex visualization libraries into a single, cohesive system. This wasn't just about quantity; it was about taming heterogeneity. We managed to make Python libraries like
Matplotlib, JavaScript libraries likeECharts, and even standalone engines likeGraphvizwork together seamlessly. This provides users with an unprecedented level of flexibility to choose the perfect visualization for their needs.Achieving Production-Level System Reliability: We moved beyond a simple proof-of-concept to build a genuinely robust application. By implementing the "local-first" strategy for frontend assets and integrating
LiteLLMfor API flexibility, we eliminated critical points of failure. Our system is not just a demo; it's a stable tool that can withstand real-world challenges like network instability and unreliable third-party services.Designing a Highly Extensible and Scalable Architecture: Our architectural decisions—like the
BaseRenderToolabstract class and the "Team of Specialists" agent model—were made with the future in mind. We didn't just build a product; we built a framework. This design means adding a 16th or 17th visualization tool is no longer a monumental effort but a straightforward, templated process. We're proud to have created a system that is built to grow.Fulfilling Our Core Mission of Accessibility: Our greatest accomplishment is realizing our initial vision: empowering non-technical users. We successfully transformed the frustrating, code-heavy process of data visualization into a simple, conversational experience. The fact that a student with limited coding skills can now generate a publication-ready chart with a single sentence is the ultimate validation of our work and what makes us most proud.
What we learned
This project provided four core insights into building scalable, agentic systems with the Google ADK:
Hierarchical Agent Design is Key for Complex Tasks. I learned that effective agent systems rely on a clear separation of concerns, best implemented through a hierarchical structure. The project uses a
root_agent(ChartCoordinatorAI) that functions solely as a router, leveraging a meticulously crafted prompt to guide the LLM'stransfer_to_agentdecisions. State and context are passed down seamlessly to the specialistsub_agents(e.g.,DataVizExpert) via theInvocationContext, allowing for complex, multi-step reasoning without losing the user's original intent.The
FunctionDeclarationis a Non-Negotiable Contract. A tool is only as good as its definition. My key takeaway is that reliable tool use by the LLM is not based on the natural languagedescriptionalone, but on the rigid schema provided by the_get_declarationmethod. Crafting a precisetypes.FunctionDeclarationwith a well-definedtypes.Schemafor parameters is critical. This structured "contract" is what allows the LLM's reasoning loop to reliably generate correct function calls, bridging the gap between probabilistic language and deterministic code.The Template Method Pattern Maximizes Scalability. To manage 15 heterogeneous tools, I implemented a
BaseRenderToolabstract class. This class uses the Template Method design pattern: the baserun_asyncmethod defines the invariant sequence of operations (logging, rendering, creating anadk.Artifact), while deferring the variant rendering logic to the_render_syncmethod in each subclass. This abstracted away all common ADK-interaction logic, allowing for the rapid and robust integration of new tools.A Panoramic View of the Visualization Ecosystem. On a practical level, building out the 15 tools required a deep dive into a vast ecosystem of visualization libraries. I gained hands-on experience across different paradigms: the scientific stack in Python (
Matplotlib,Plotly,Seaborn), declarative diagramming engines (Graphviz,Mermaid,PlantUML), and the modern interactive JavaScript world (ECharts,D3.js,Three.js). This process provided an invaluable, panoramic view of the data visualization landscape.
What's next for Chart Coordinator AI
Chart Coordinator AI has laid a robust foundation, but we see a clear roadmap ahead to make it even more powerful, user-friendly, and accessible. Our next phase of development will focus on four key pillars:
Hyper-Focus on Publication-Ready Scientific Charts (with RAG): Our top priority is to deeply enhance the system's capability for academic research, fulfilling the project's original mission. We will build a specialized knowledge base containing the specific conventions and style requirements for charts used in various academic disciplines, with a special focus on psychology (e.g., APA style interaction plots, path analysis diagrams). We will then integrate Retrieval-Augmented Generation (RAG) technology. This will allow the agent to retrieve precise formatting rules from this knowledge base before generating the code, ensuring the output is not just visually correct, but truly "publication-ready."
Seamless Data Integration: To streamline the user workflow, we will move beyond text-based data input. We will add a suite of tools that can directly connect to and query data sources like Google Sheets, databases (via SQL), and uploaded files (CSV, Excel). This will allow users to simply point the agent to their data, making the process faster and more intuitive.
Conversational Chart Refinement: We want to empower users to iteratively improve their charts through dialogue. We will implement a stateful conversational mechanism where a user can have a follow-up conversation with the agent to modify a generated chart. For example, a user could say: "That's great, but can you make the title bigger and change the color scheme to blue?" The agent would then edit the chart without regenerating it from scratch.
Deployment to the Cloud for Global Access: To make Chart Coordinator AI accessible to everyone, our ultimate goal is to package the application and deploy it as a public service on Google Cloud Run. This would transform it from a local project into a globally available tool for students, researchers, and analysts everywhere, empowering them to visualize their data with the power of natural language.


Log in or sign up for Devpost to join the conversation.